Notebooks: User-Specific Structured Listing Configurations
Users can now configure personal listing views for structured listing cells in notebooks, separate from the default configuration set by admins.
Previously, all users shared the same listing configuration for notebook cells. If one user changed the columns or filters, it affected everyone viewing that notebook. With this update, individual users can customize their own view with unique columns, filters, and sorting that persists across sessions—without affecting what others see.
This is especially useful for dashboard-style notebooks where team members need different views of the same data.
How to customize your personal view:
- Open a structured listing cell in a notebook.
- Modify columns, filters, and sorting to create your personal view.
- Your configuration will automatically persist when you leave and return to the page.
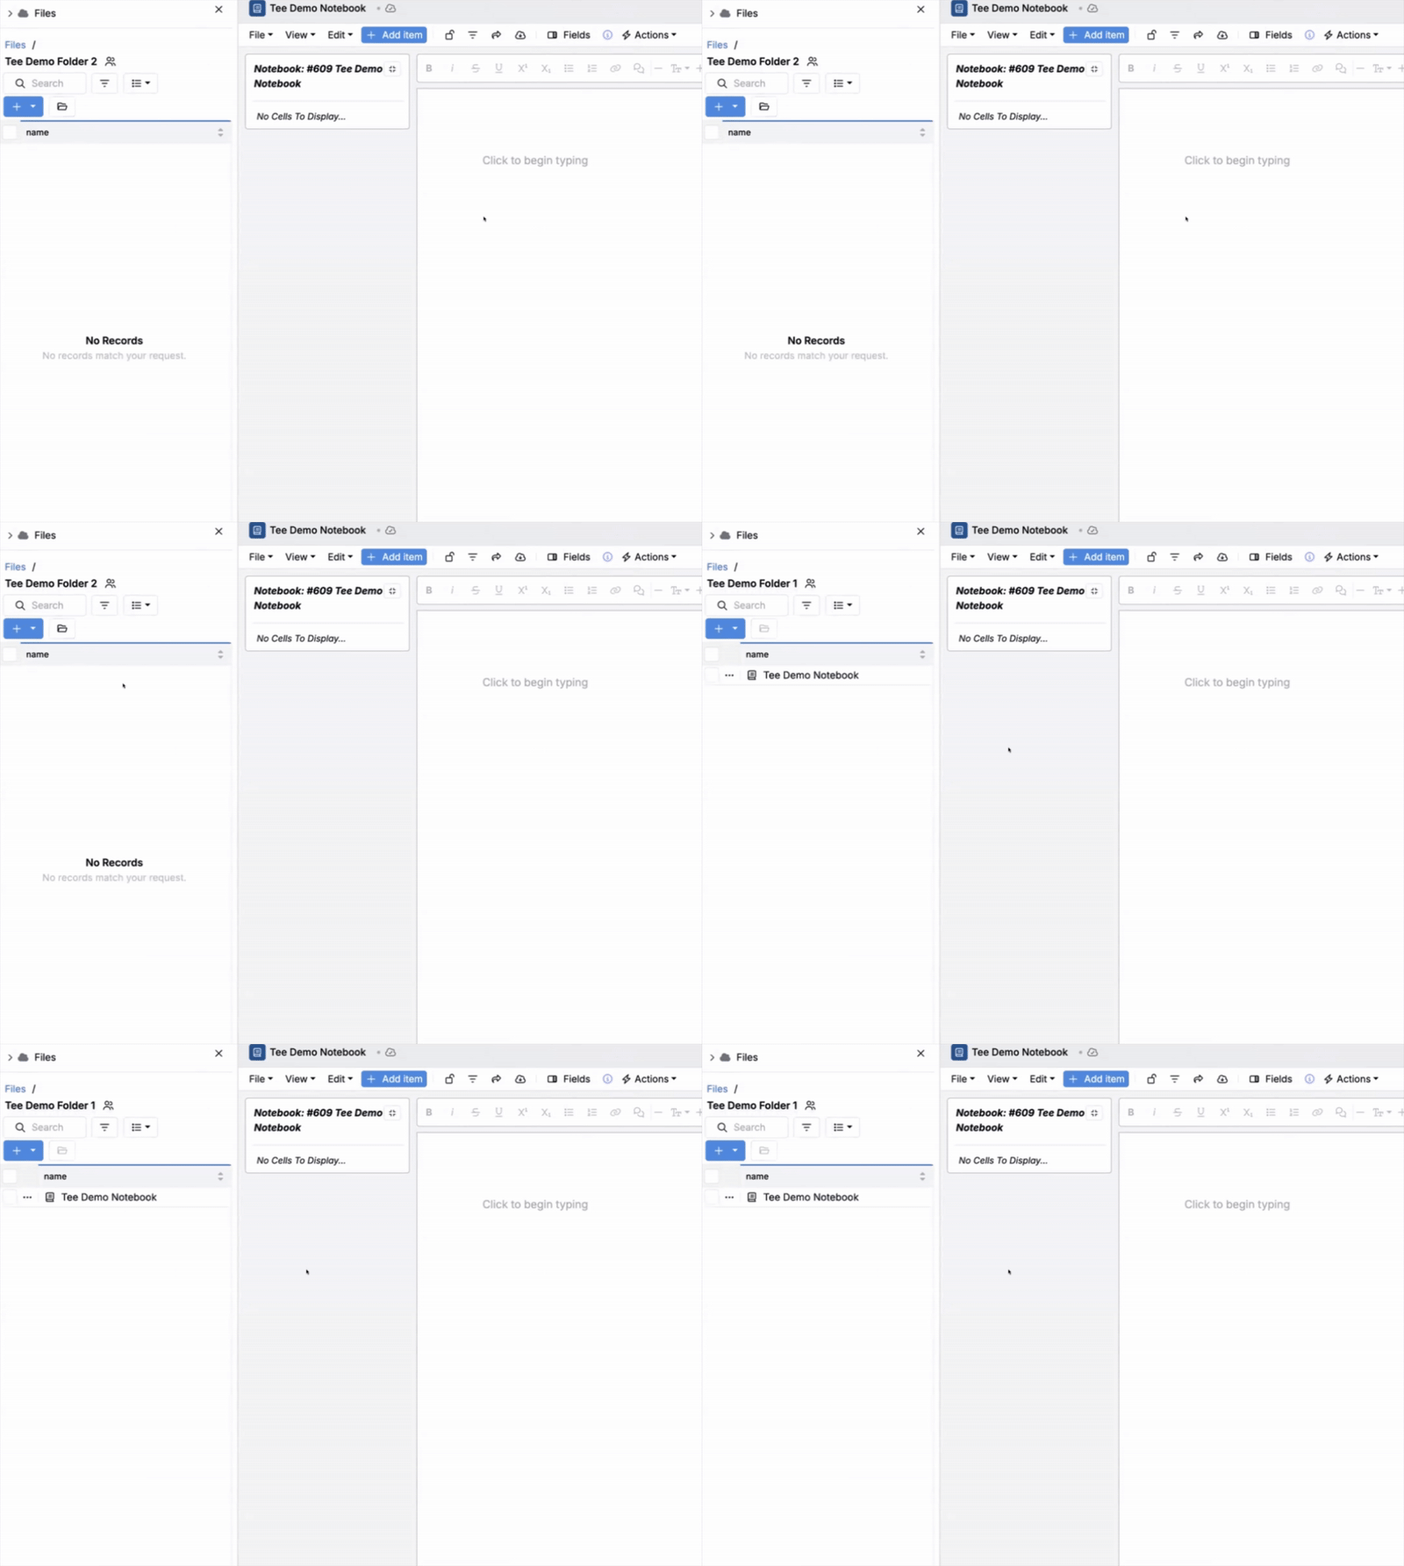
- To return to the default configuration, click List > Columns > Reset Listing.
Export Signed Notebooks as PDFs
Notebooks can now be exported as digitally signed PDFs with automatic signature block insertion and asynchronous processing.
Previously, notebook exports did not support digital signatures, making it difficult to create validated documentation for compliance or quality assurance workflows. With this update, you can configure notebooks to automatically export as signed PDFs when locked and signed, with the signature verifiable in Adobe.
This feature is especially useful for regulated environments requiring validated electronic records.
How to set up:
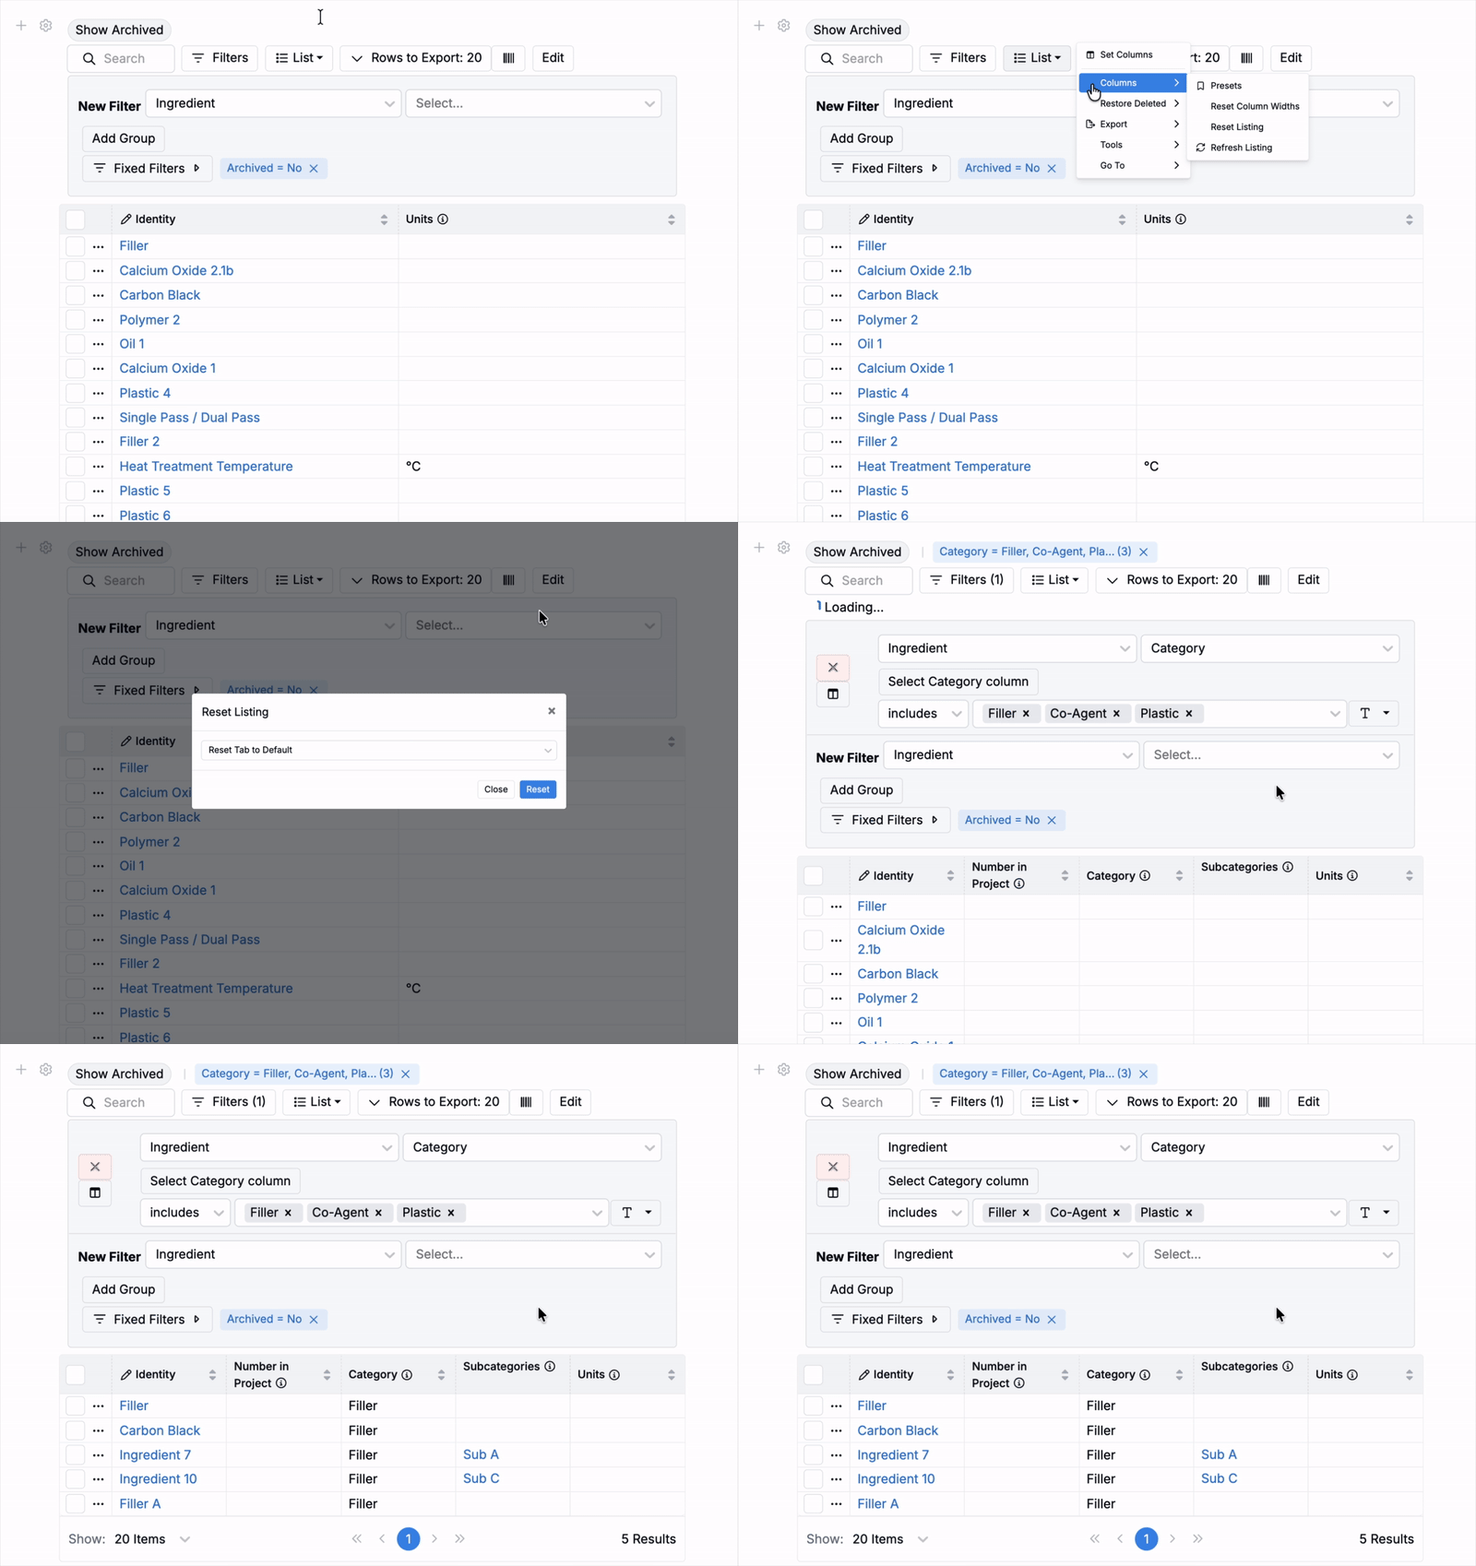
- Create a Signing Config entity with your public/private key pair.
- The private key is uploaded to AWS (or Azure for VPC deployments).
- Set the ref name that corresponds to how the key is accessed.
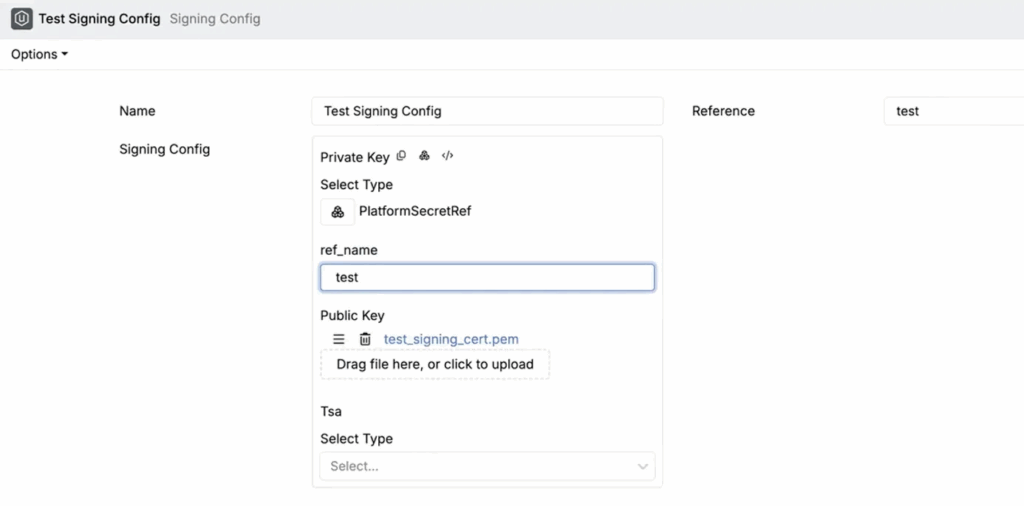
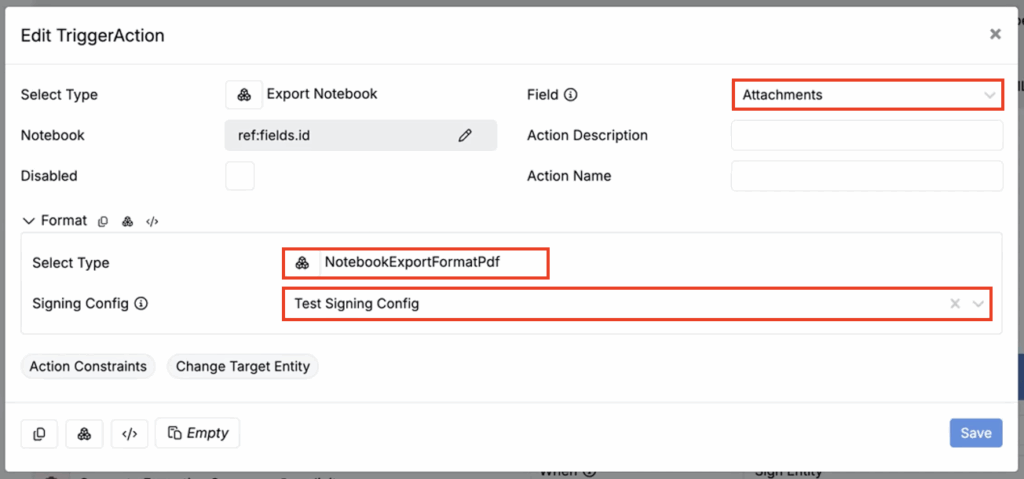
- On your notebook definition, add a trigger with the Export Notebook action.
- Assign a trigger name.
- Optionally, set When to “Sign Entity” to make the trigger run when signing the entity.
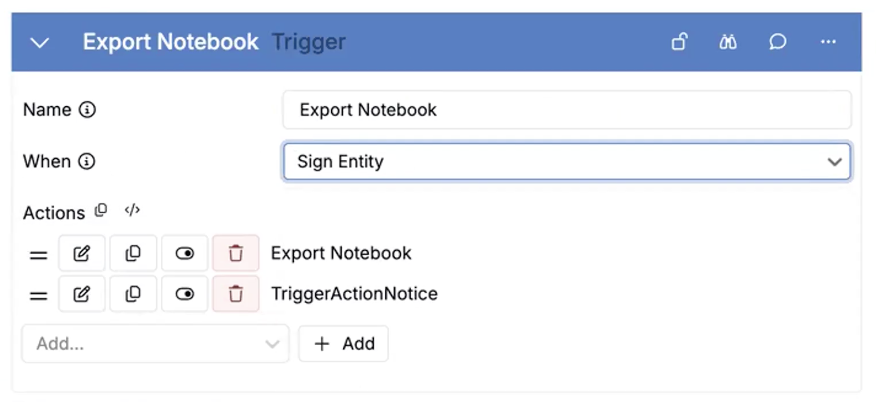
- Add and configure an Export Notebook trigger action.
- Set Field to your attachments field to add the export to your notebook’s attachment field.
- Use the Select Type field to select NotebookExportFormatPdf
- Use the Signing Config field to select your signing config.
How to use:
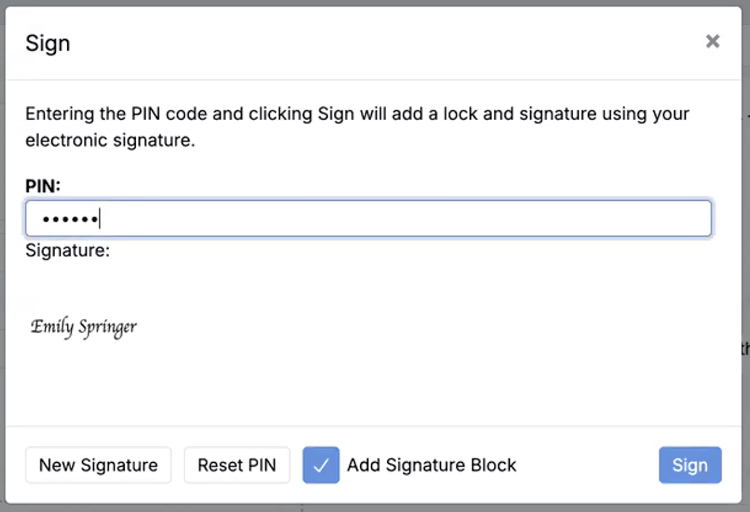
- Open a notebook and lock and sign it.
- Optionally enable Add Signature Block to automatically insert a signature block before locking.
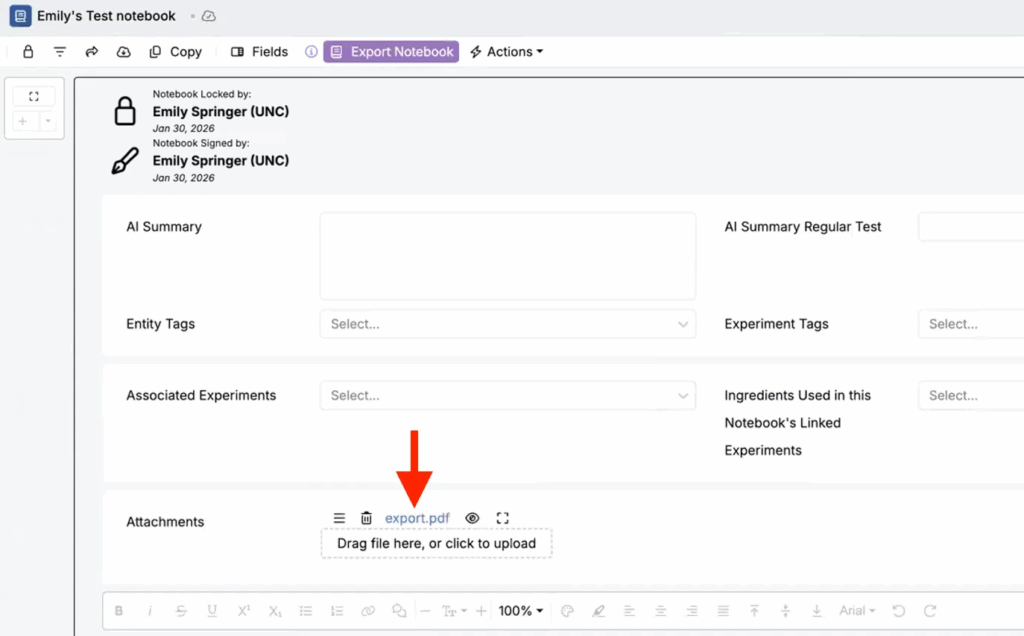
- The export runs asynchronously in the background.
- Once complete, the signed PDF appears in the configured attachments field.
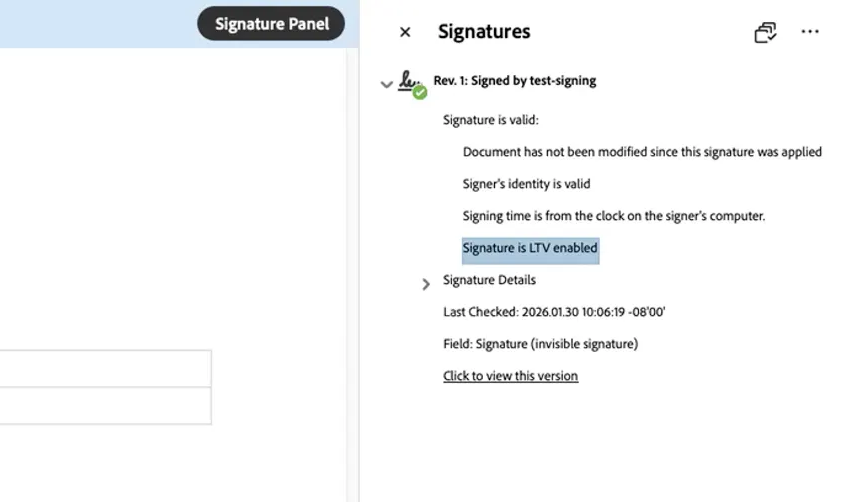
- Open the PDF in Adobe to verify the digital signature with timestamp and signing config information.
Curve Visualization: Customizable Legend Labels
You can now customize legend labels in curve visualizations, including which components to display and their order.
Previously, legend labels were fully displayed with all components in a fixed order. With this update, you can remove or reorder label components, such as moving an average tag to the front or back of the label, or hiding it entirely, giving you more control over how curves are presented.
How to use:
- Open the Curve Visualization page.
- Access Custom Chart Settings.
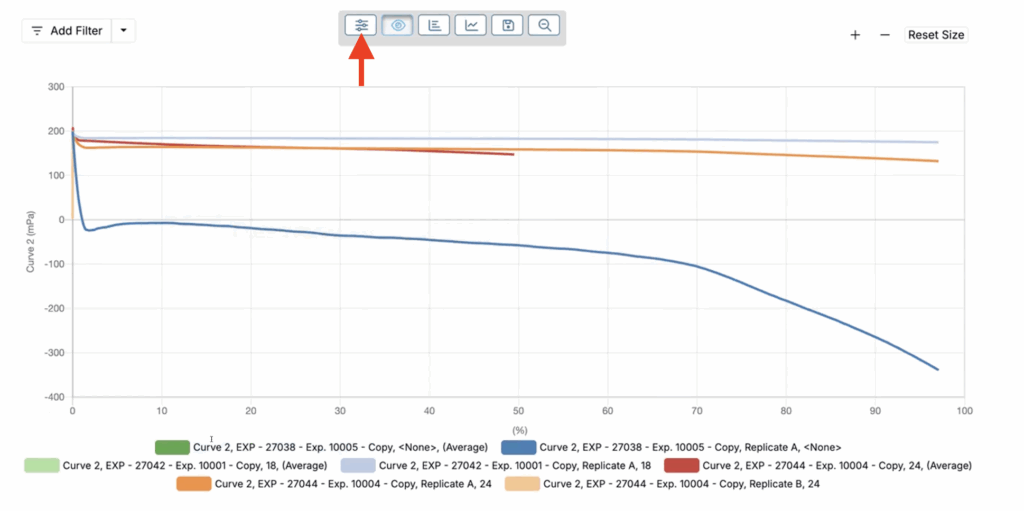
- Find the Legend Label dropdown.
- Remove components you don’t want to display.
- Reorder components by dragging them to your preferred position.
- Save your changes.
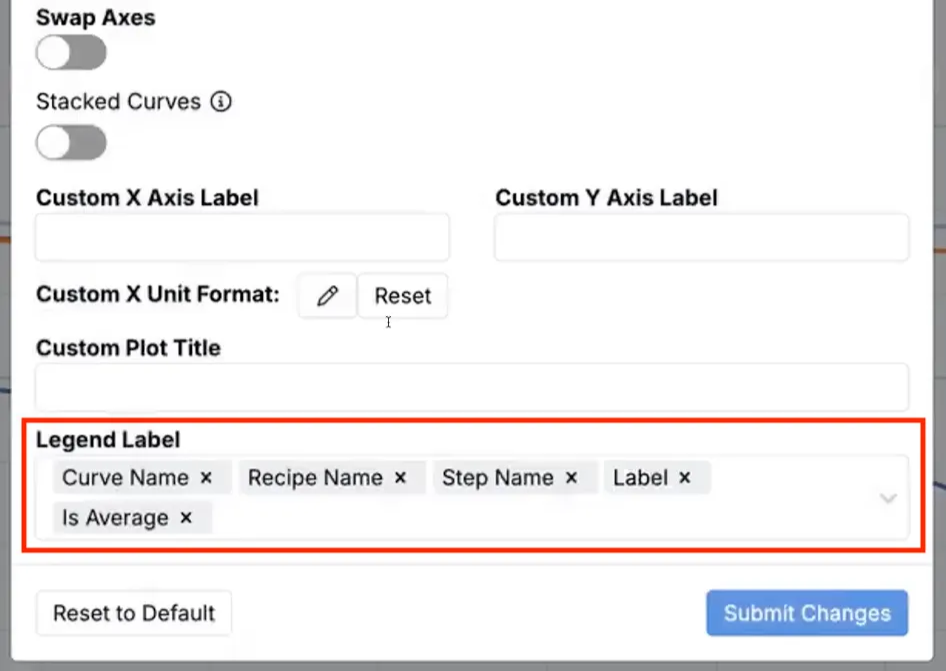
The legend labels will update to reflect your configuration.
Flip Axes on Curve Outputs
You can now swap the X and Y axes on curve outputs directly from the output’s details page.
Previously, if you wanted to visualize a curve with reversed axes, you had no way to do this without recreating the output. With this update, you can flip axes on any curve output, changing how the data is displayed on the chart. This new setting may be useful in cases when you need to present data with a different orientation for analysis or reporting purposes.
Note that this is different from the transpose feature, which only affects table display.
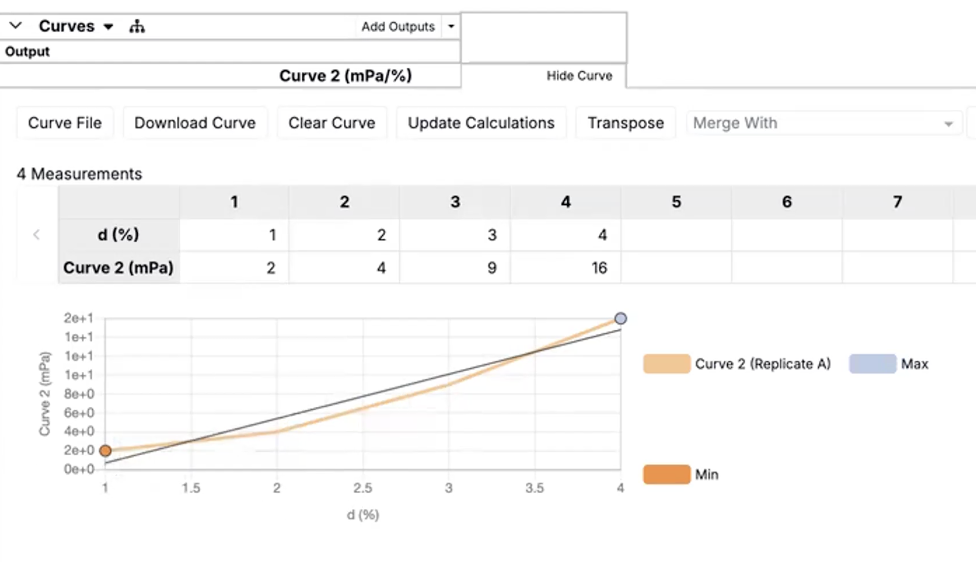
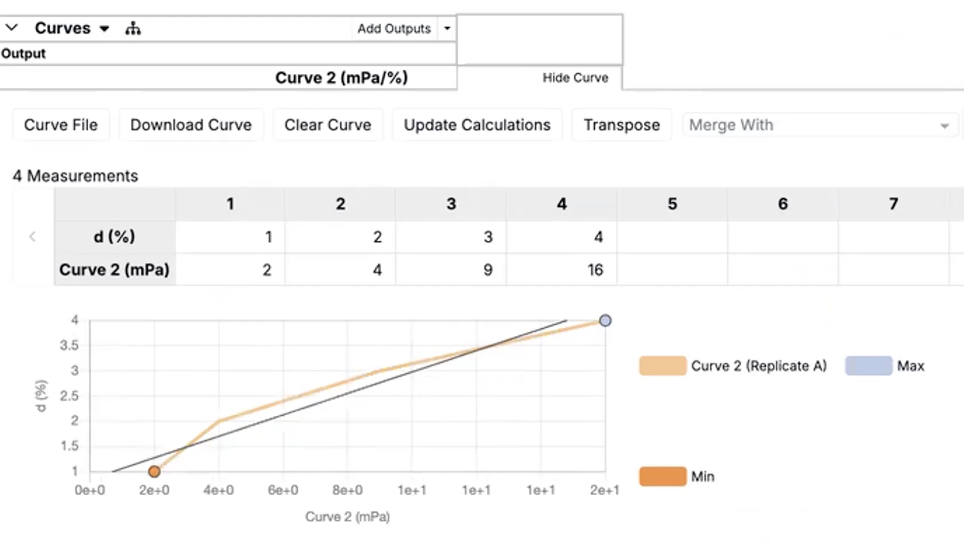
How to use:
- Access the curve output’s details page.
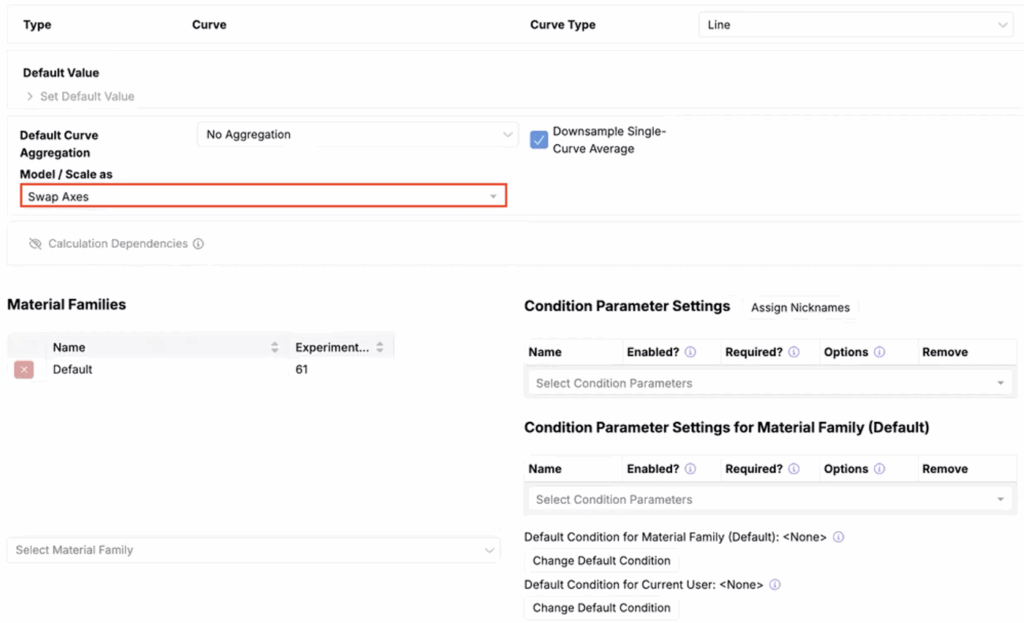
- Use the Model/Scale as field to select Swap Axes for the curve output.
Configurable Ordinal Export Formatting
On an output’s details page, you can now configure how ordinal values are formatted when exporting recipes to runsheets.
Previously, ordinals were exported with a fixed format. With this update, you can choose between several formatting options: label and value, label and value when different, label only, or value only. This makes exported documents easier to read and more flexible for different use cases.
How to configure:
- Navigate to your output’s details page.
- Use the Ordinal Export Display Mode field to select your display mode.
- Export your experiment to a runsheet to see the formatting applied.
Example:
Consider two ordinal outputs:
- Ordinal (Kanta) (Fruit Type) — has numeric value 2 and text label Apple Pie
- Ordinal Testing — has numeric value 2 and text label two
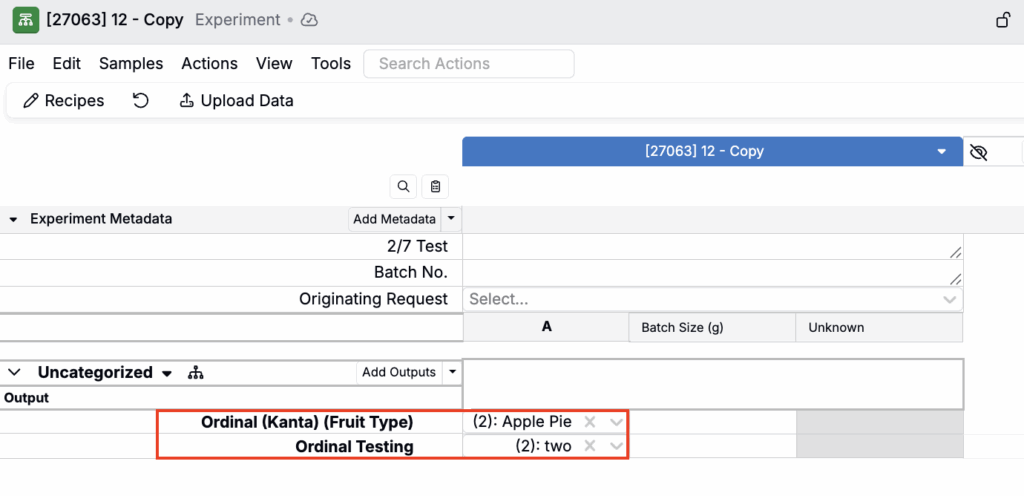
You can configure each output’s display mode independently on its details page:
- Ordinal (Kanta) (Fruit Type) → set to Label Only
- Ordinal Testing → set to Label and Value
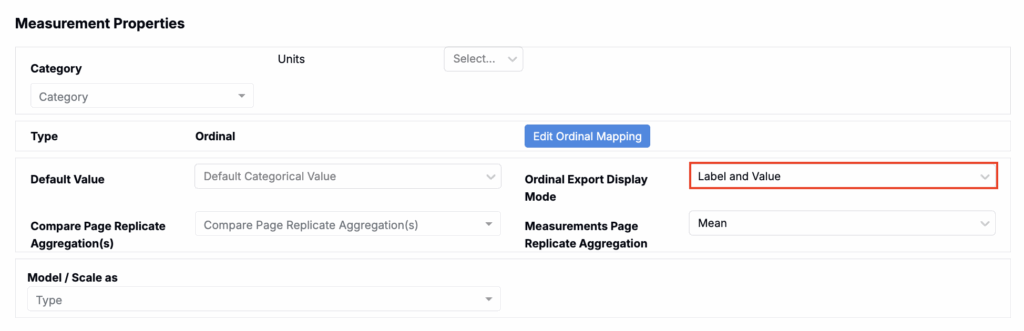
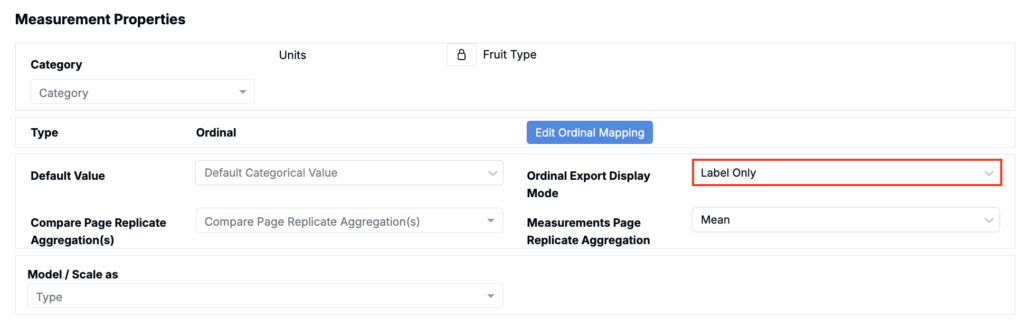
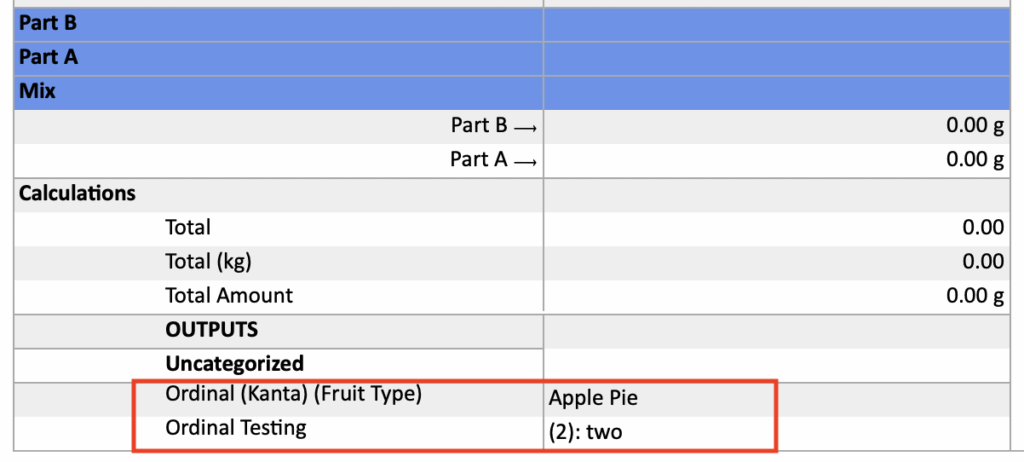
Exported runsheets will reflect these settings. In this example, on the runsheet:
- Ordinal (Kanta) (Fruit Type) displays as “Apple Pie” (label only)
- Ordinal (Testing) displays as “(2): two” (label and value)
Mix Order Instructions
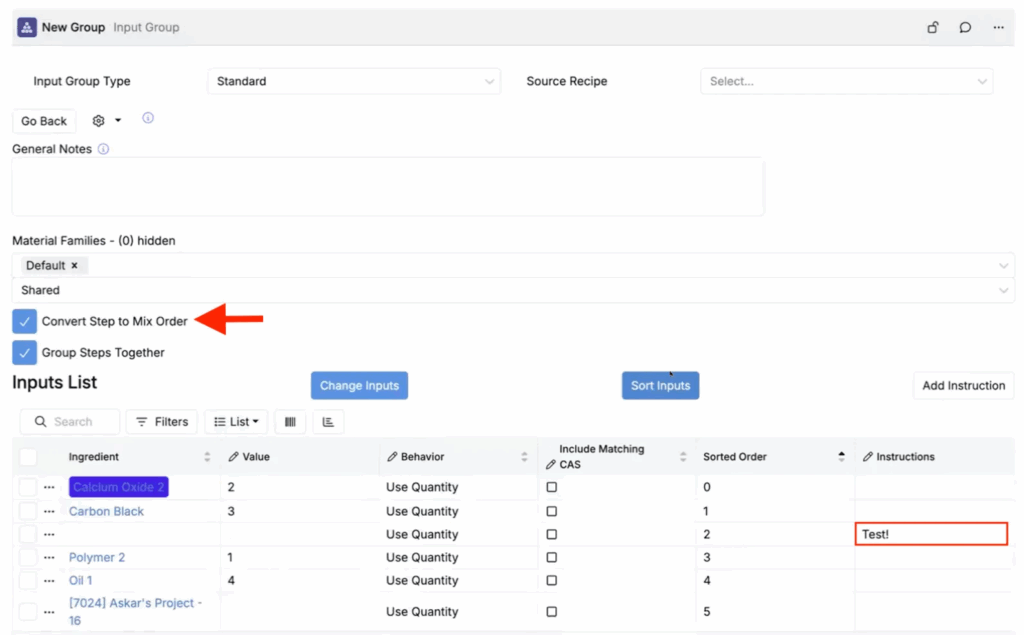
Input groups can now be converted to mix orders using the Convert Step to Mix Order setting on the input group. When you add the input group to an experiment, it will be added as a workflow step with all standard workflow step controls and behaviors.
This includes the ability to add instructions via an instructions column on the input group table. This allows you to use input groups as templates for mix orders, standardizing manufacturing procedures across experiments while maintaining flexibility to adjust individual workflows. Any changes made to the mix order in an experiment are independent of the original input group template.
How to use:
- Create or edit an input group.
- Add inputs.
- Enable the Convert Step to Mix Order setting.
- Add an Instructions column (List > Set Columns). Learn more.
- Use the instructions column to type in instructions manually. You can also click the Add Instruction button (only visible with the Convert Step to Mix Order setting is enabled).
- To rearrange mix order steps, including instructions, click Sort Inputs.
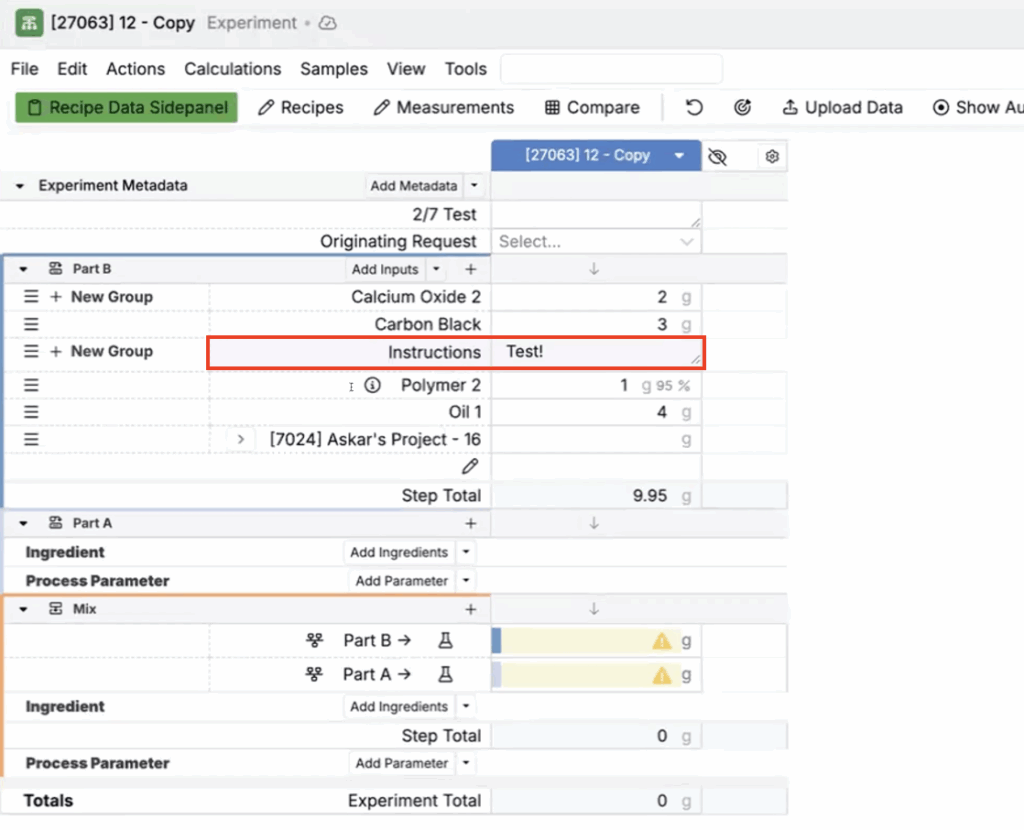
- When you add this input group to an experiment, it will appear as a workflow step with mix order functionality.
- Instructions from the input group will appear as instruction rows in your recipe.
AI Model Selection and Management
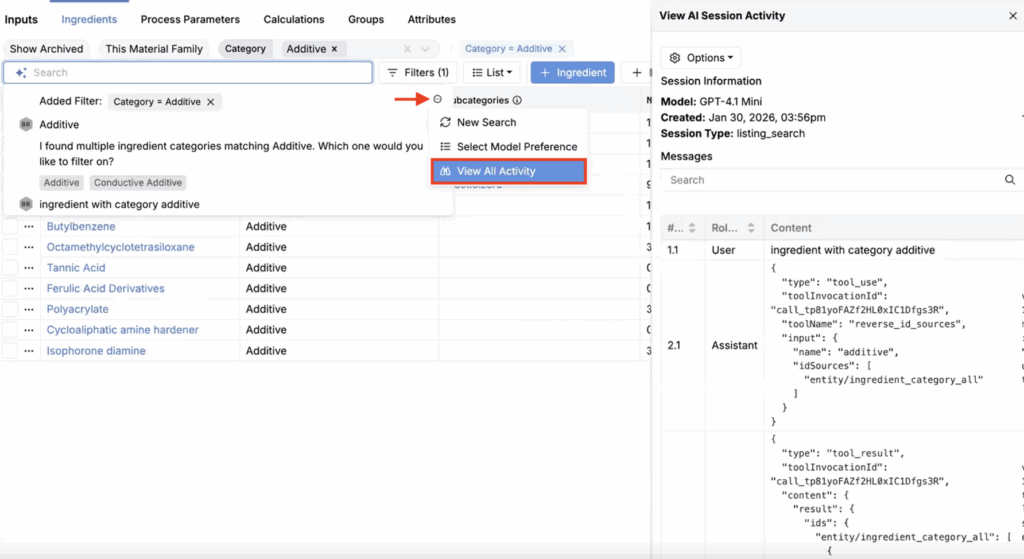
Admins can now configure which AI models are available for LLM and generative AI features across the platform, view detailed AI session activity, and debug AI interactions with full trace visibility.
Previously, AI models were pre-selected with no ability to choose alternatives or see detailed traces of AI interactions. With this update, you have full control over model availability, prioritization, and transparency into how these AI features work. This enables organizations to choose models that best fit their performance, cost, and compliance requirements while providing full visibility for troubleshooting and optimization.
New features include:
- External AI Models page – Allows users to configure and prioritize available AI models
- View All Activity sidepanel – A sidepanel containing detailed traces of AI actions including inputs, tools used, and results
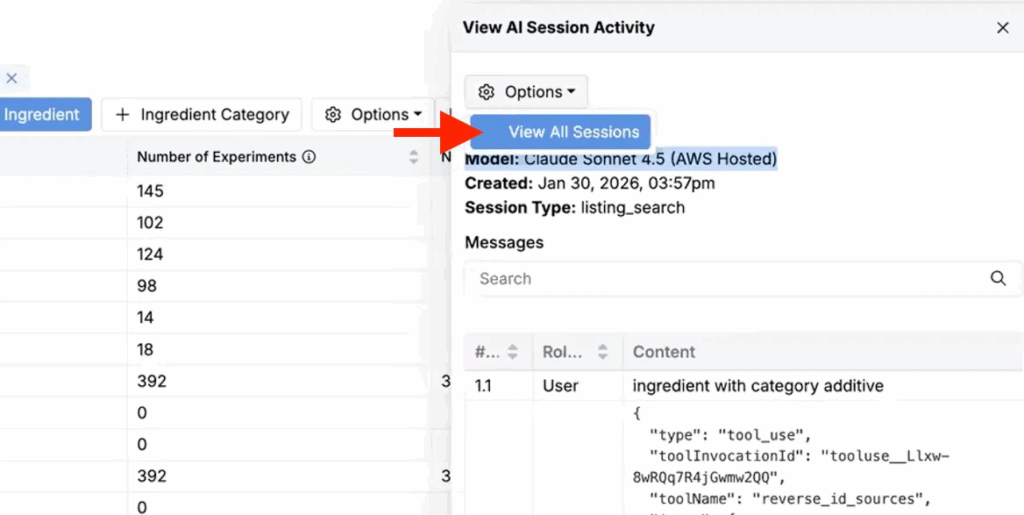
- Sessions listing page – A listing page with a complete listing of all AI sessions
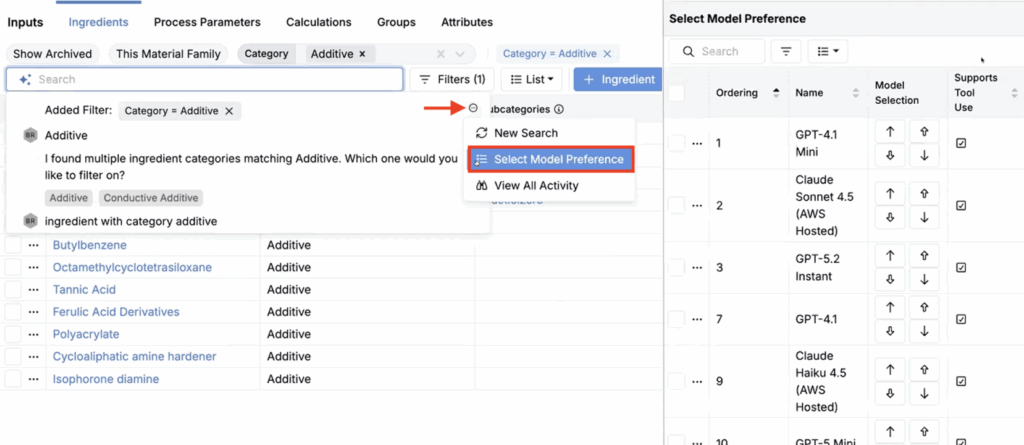
- Model preference selector – A sidepanel to switch between available models on demand
How to configure AI models:
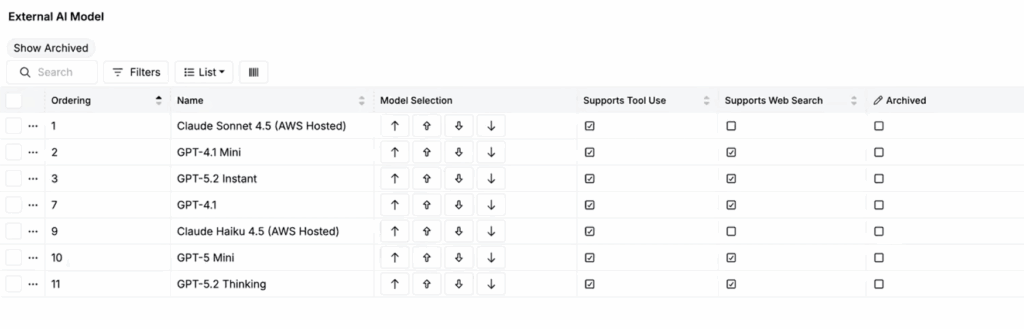
- Navigate to the External AI Models page via Search Actions.
- On the listing page:
- View all available AI models
- Drag to reorder models by priority (highest priority at the top)
- Use checkboxes to enable or disable tool use and web search for each model
- Archive any models you want to prevent from being used
How model selection works:
When you configure your External AI Models list, the system automatically selects the right model for each AI feature based on your priority order:
- The system checks what capabilities are required (e.g., tool use, web search).
- It selects the highest-priority model from your list that supports those capabilities.
- If no available models support the required capabilities, an error is displayed.
How to view AI activity and debug:
- While using any AI feature, click the … icon.
- Select View All Activity to open a sidepanel with detailed traces showing:
- User input
- Tools the AI used
- Results and outputs
- To see all sessions, click Option > View All Sessions from the sidepanel.
How to switch models on demand:
- While using any AI feature, click the … icon.
- Select Select Model Preference.
- Choose from the available models in the sidepanel.
Model Context Protocol (MCP)
Connect your preferred AI assistants like Claude or ChatGPT to Uncountable using the Model Context Protocol (MCP), enabling natural language interaction with your data and workflows.
MCP acts as a secure bridge between external AI tools and Uncountable, giving your AI assistant the ability to query data, create experiments, update formulations, and perform other platform actions through simple conversation. This integration brings AI-driven analysis and automation directly into your existing workflows, allowing scientists to interact with Uncountable data using the AI tools they already know and trust.
Example use cases:
- “Show me all experiments from last month with yield greater than 85%”
- “Create a new formulation based on experiment F-2045 but increase component A by 10%”
- “Generate a summary report of all active projects and their current status”
- “What are the top 5 performing formulations for adhesive strength?”
To learn more or to set up MCP in your Uncountable workspace, contact your dedicated Uncountable representative.
Split Images on Upload
You can now split a single image into multiple cropped images when uploading to an image output on the experiment’s Measurements view.
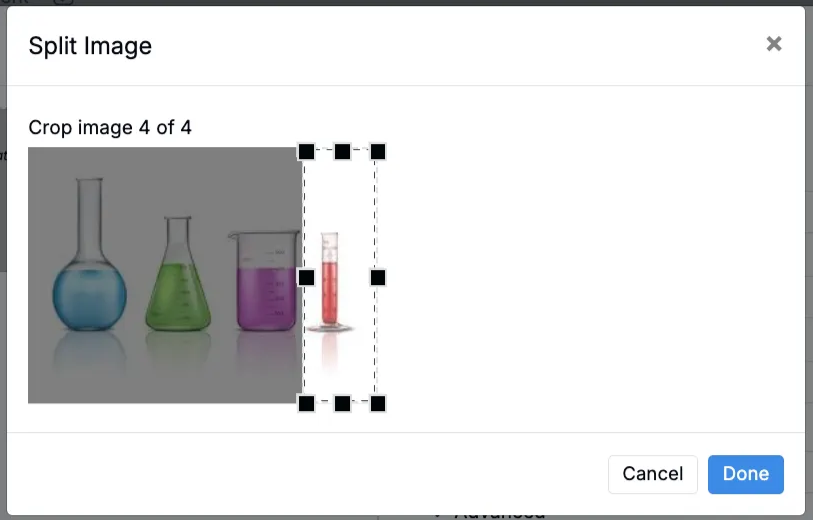
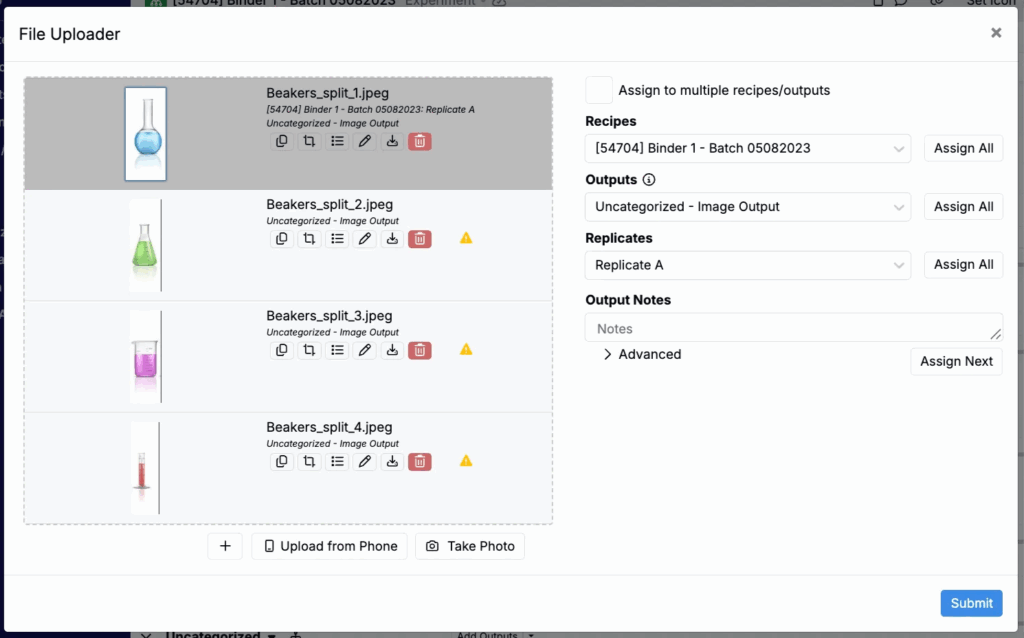
Previously, images containing multiple test panels had to be manually cropped and uploaded separately. With this update, you can split one image into multiple sections and assign each to different experiments or replicates. This is especially useful for exposure testing and quality control workflows where multiple samples are photographed together, significantly reducing upload time and manual processing.
How to use:
- Add an image output and click the + icon.
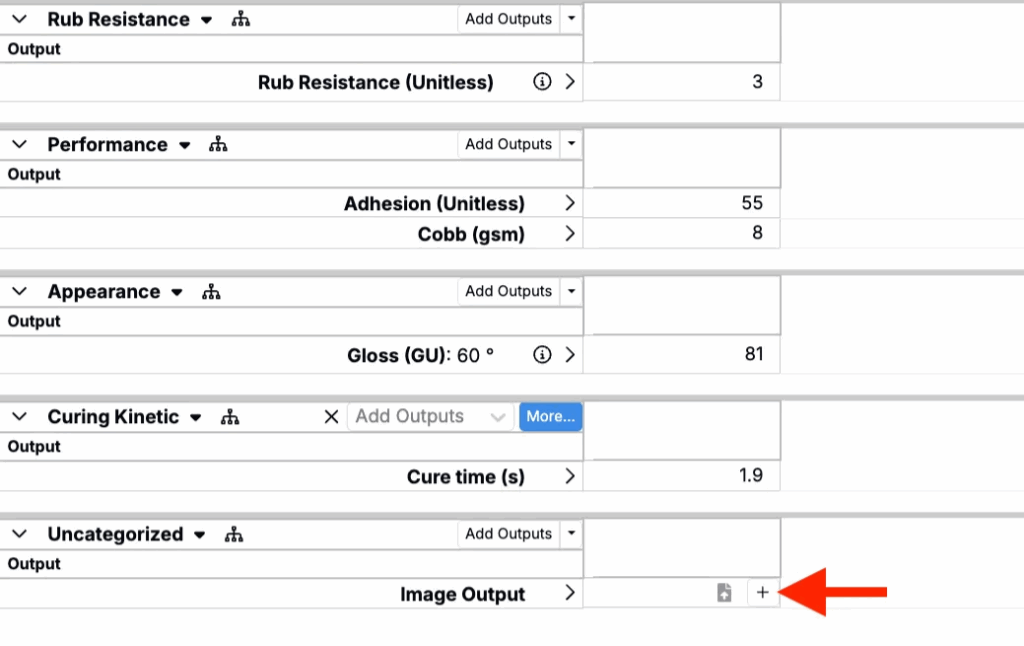
- In the File Uploader modal, drag in your file.
- Under Advanced, click the Split Image button.
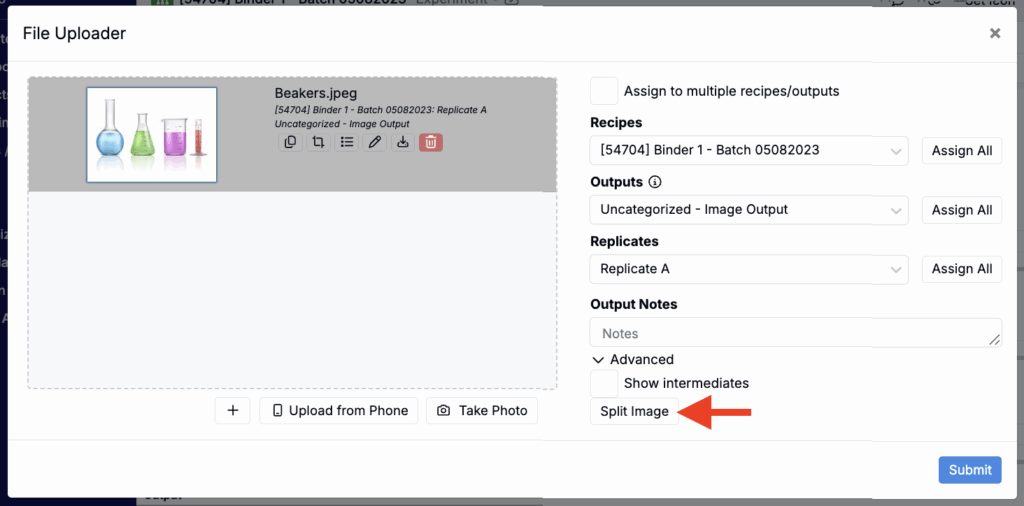
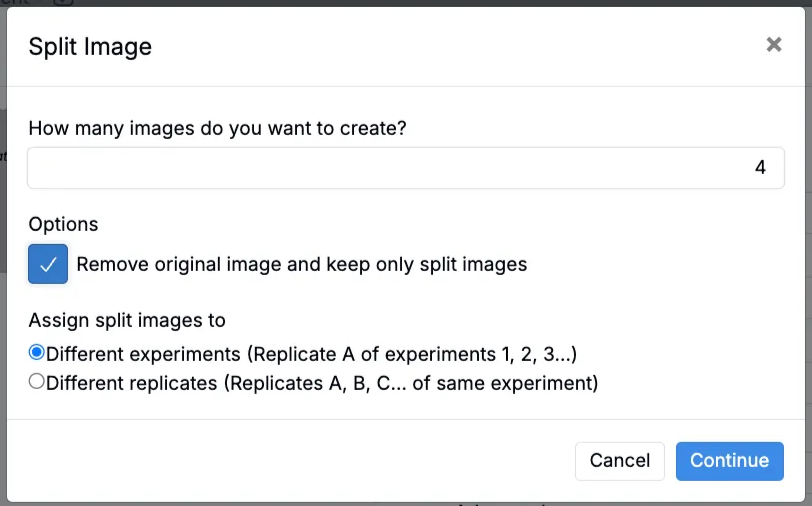
- In the Split Image modal:
- Select how many images you want to create
- Configure additional settings like removing the original image and assigning split images to new experiments or replicates
- Split your image the set number of times.
- Complete final configuration steps and click Submit.
Related Recipes Sidepanel: Color by Relationship
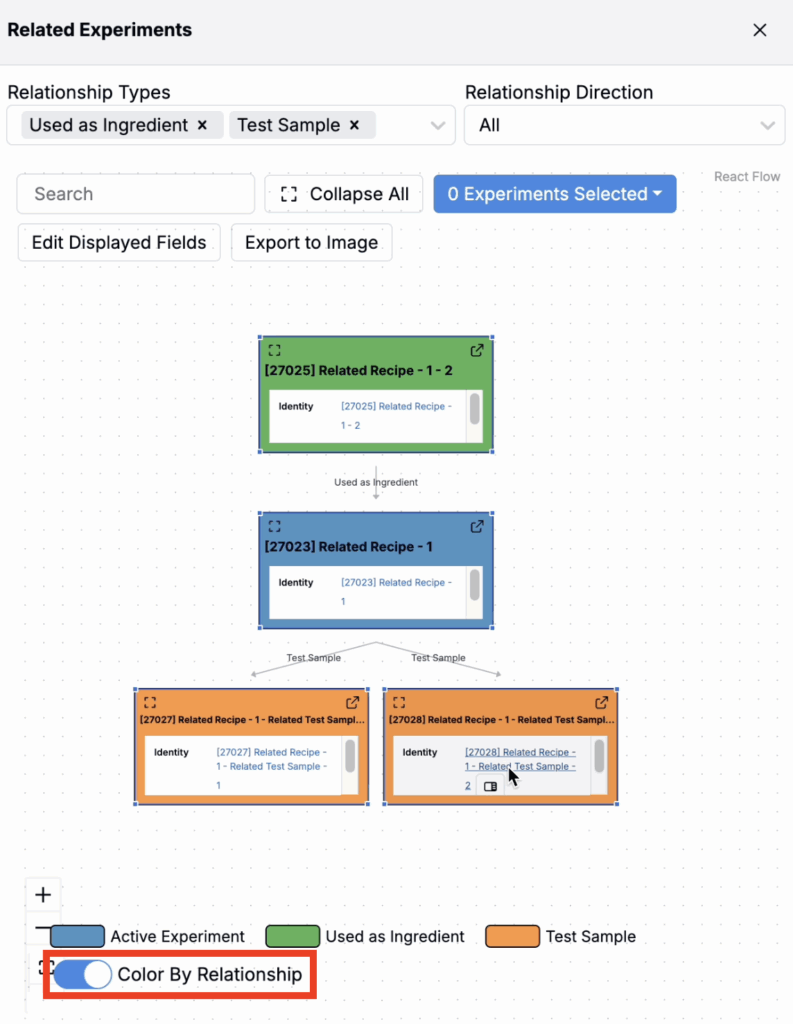
The Related Recipes sidepanel now includes a Color By Relationship toggle that colors nodes based on how each recipe relates to the one in view. This improves visual scanning when exploring related recipes or intermediates.
Previously, all nodes used a single style, making it difficult to distinguish between the main recipe, test samples, and ingredients at a glance. Nodes can now be colored based on whether they are the active experiment, a test sample, or a recipe used as an ingredient.
The setting is off by default and sticky per user, so once enabled it will remain on for your account until you turn it off again.
How to use:
- Open the Related Recipes sidepanel from a recipe.
- Enable the Color By Relationship toggle at the bottom of the side panel.
Uncountable Help Bot: Page-Aware Responses
The Uncountable help bot now takes the current page context into account when answering questions. This makes it easier to ask task-oriented questions directly from where you are working and receive answers tailored to that workflow.
Examples:
- On the Ingredients Listing page, asking “How can I create a new ingredient from here?” returns instructions specific to that listing. On the Recipe view of an experiment, the same question returns create-from-recipe guidance instead.
- On the Recipe vs Measurement view of an experiment, asking “How can I turn on the attribute column?” returns different, view-appropriate instructions.
Recipe Ingredient Fields and Ingredient Roles Columns in the Table Builder
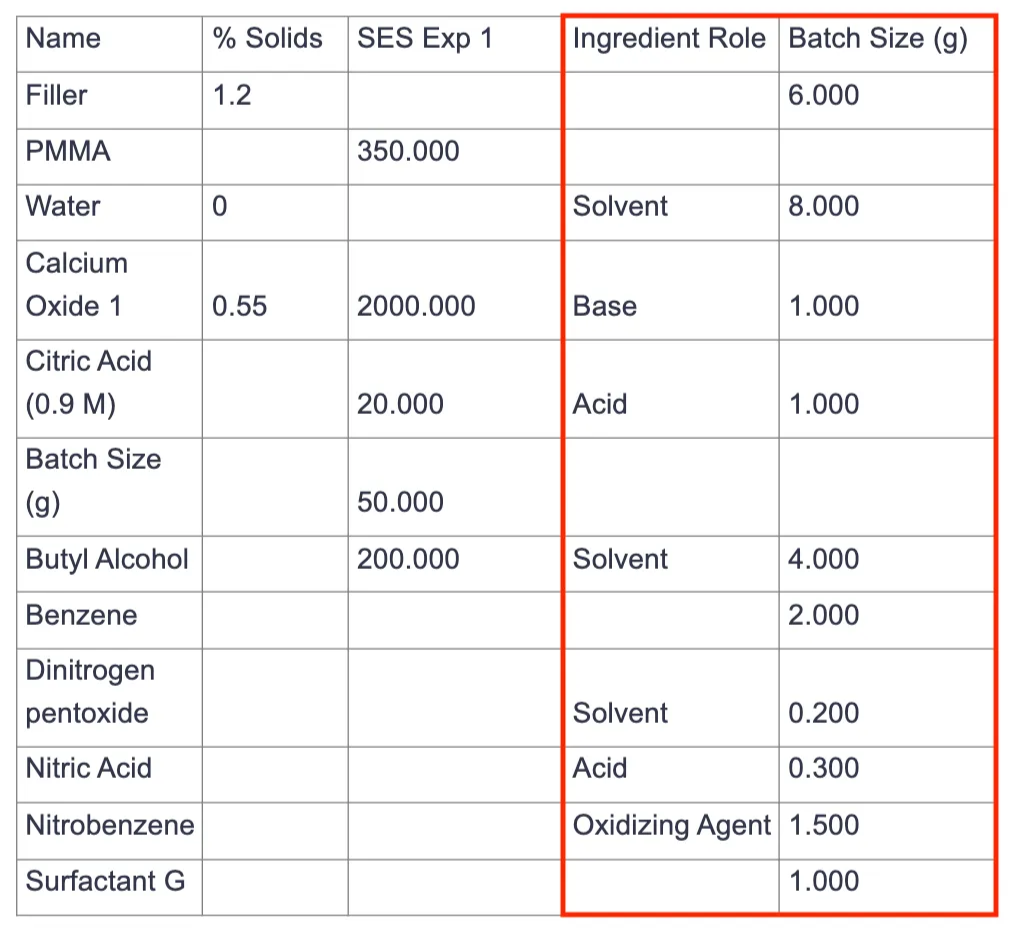
When using the Table Builder to create notebook tables, you can now add recipe ingredient fields and ingredient roles as table columns.
This makes notebook tables more useful for reviewing ingredient-level data, validating role coverage across recipes, and sharing clearer, more interpretable tables with stakeholders who may not be familiar with specific ingredient names.
How to use:
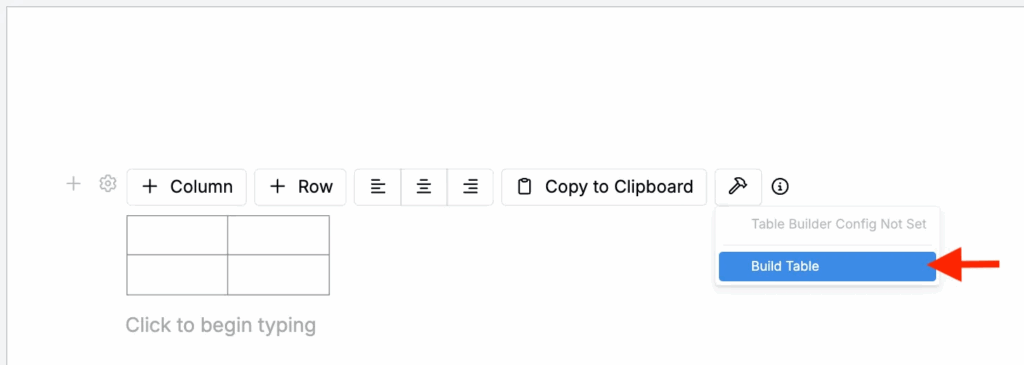
- In a notebook, add a new Table block.
- Click the hammer icon and select Build Table.
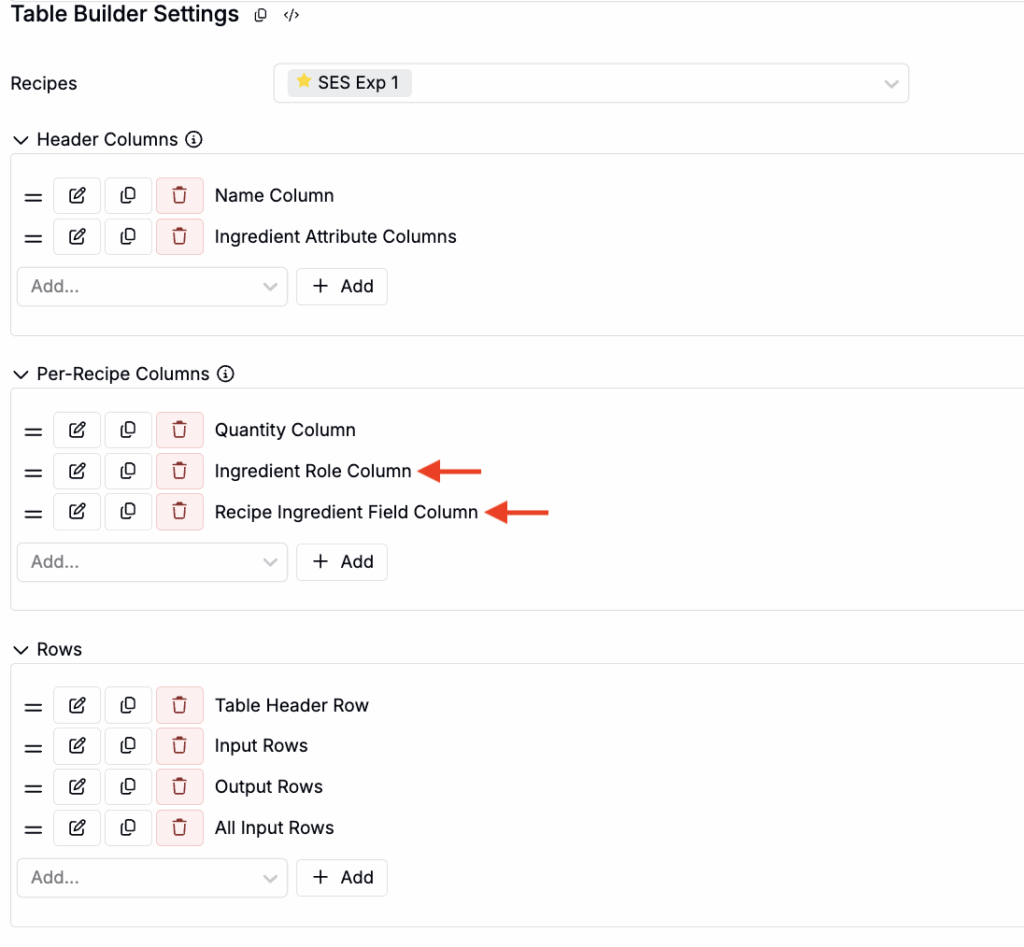
- In the modal:
- Select your recipes.
- Set your recipe headers, columns, and rows as usual.
- Under Per-Recipe Columns, select Ingredient Role Column / Recipe Ingredient Field Column.
- Save the configuration.
Autofill Display: Configurable Default Text vs Stored Value
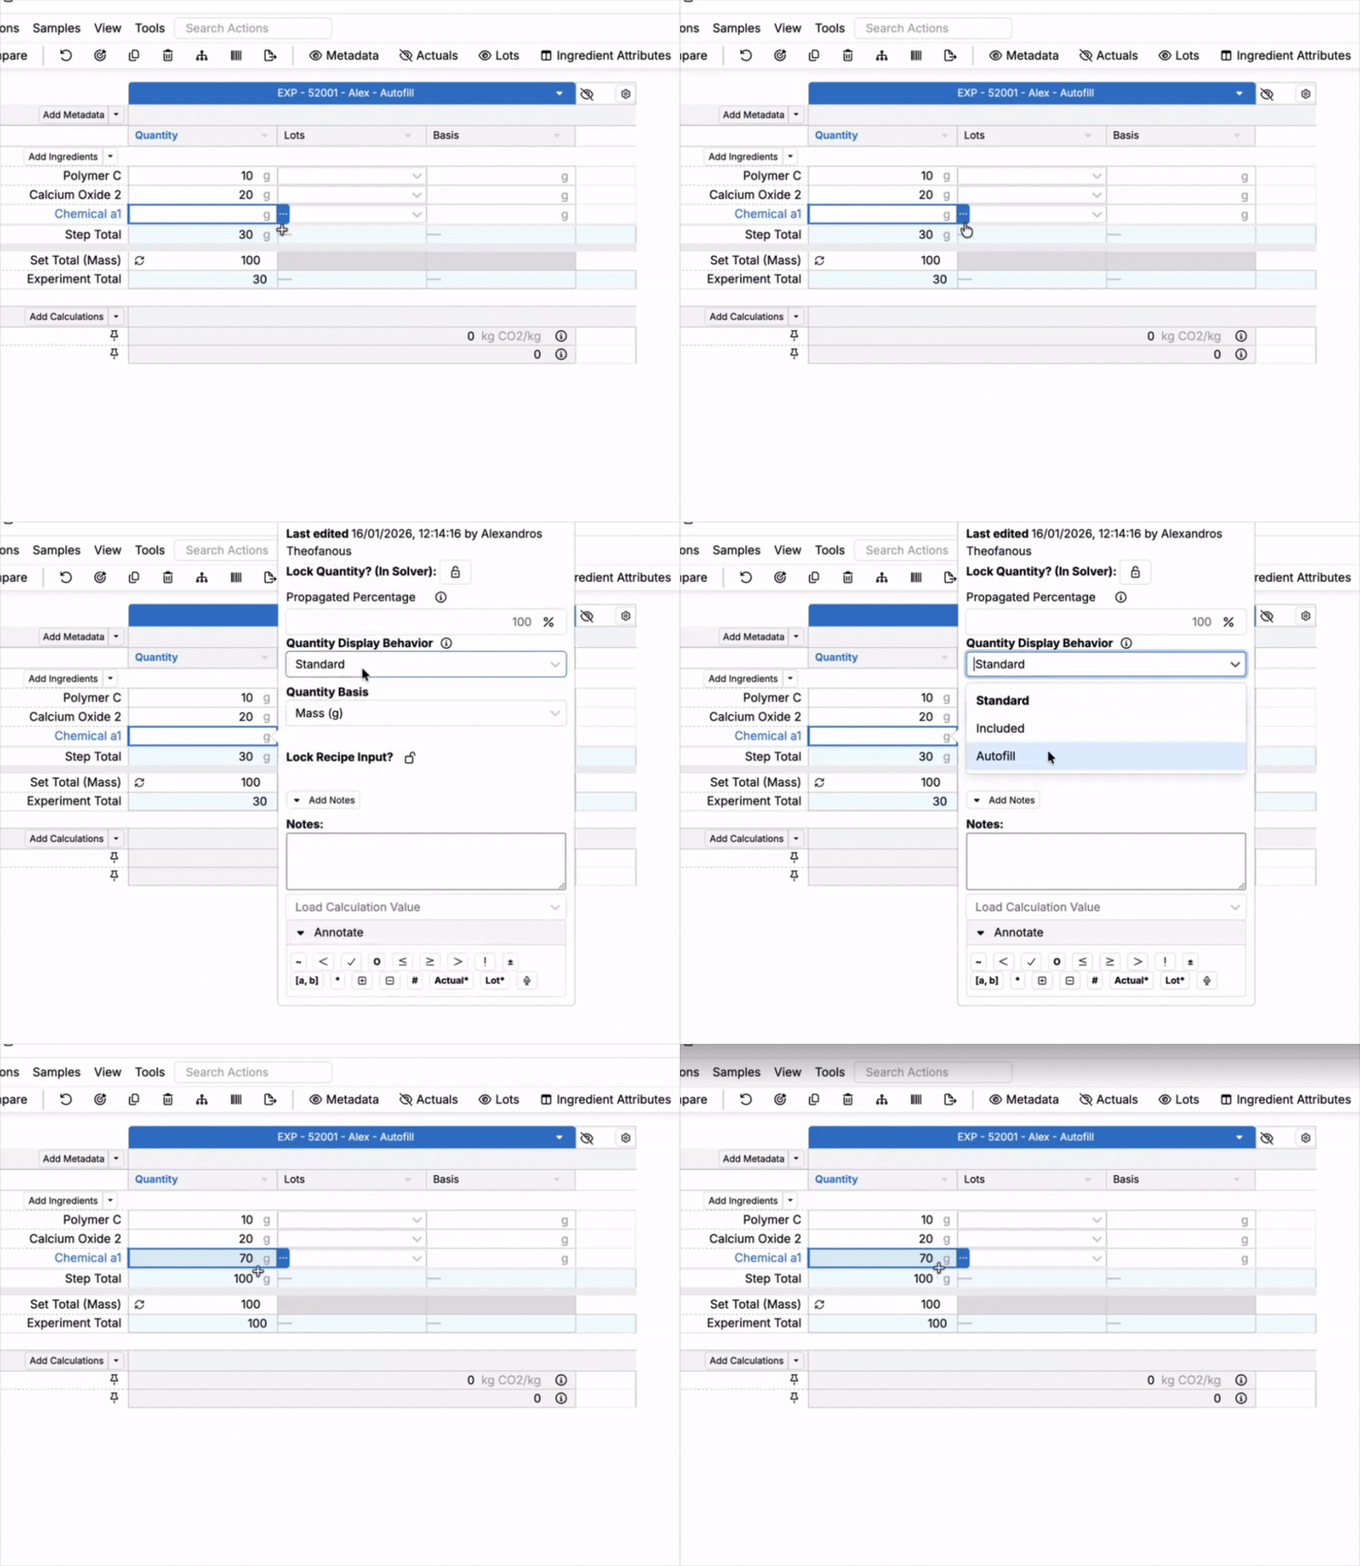
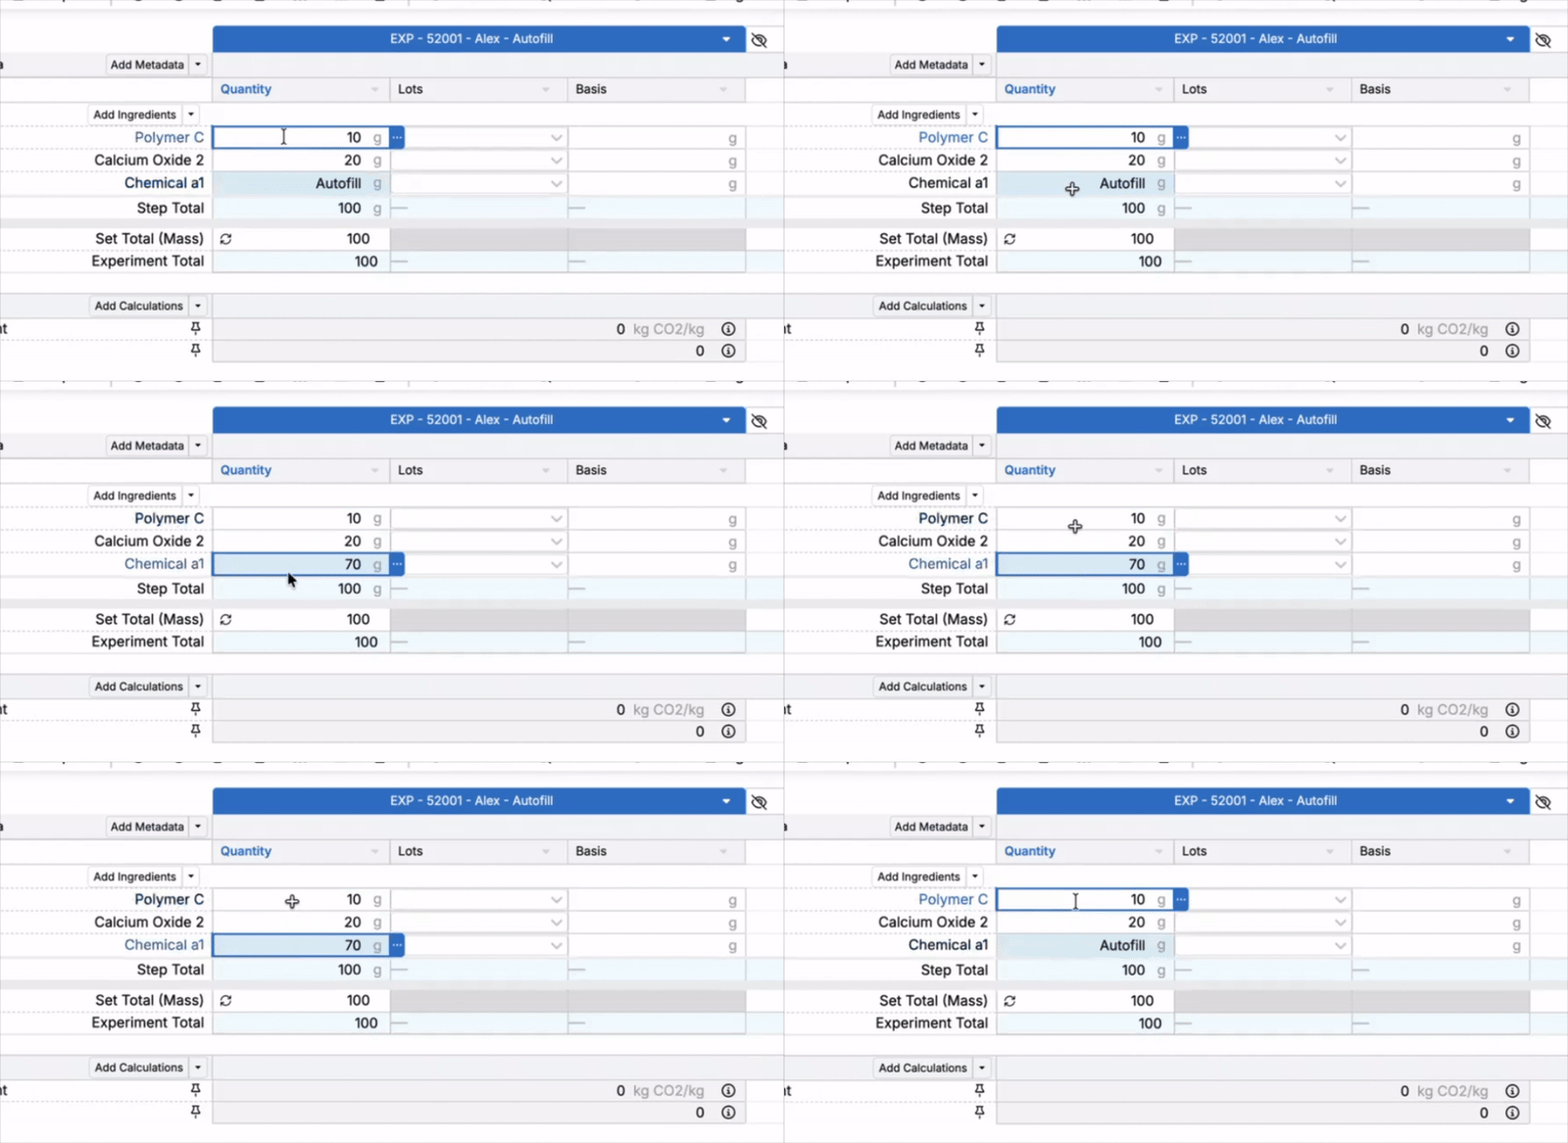
Cells that use the Autofill quantity behavior now support configurable display options when the cell is not selected. You can choose between showing the underlying numeric value or a customizable text label, while still preserving the stored autofill number for calculations.
Previously, Autofill cells always showed the numeric value, which could make it harder to distinguish manually entered values from autofilled ones, or to indicate that a value is derived rather than directly typed by the user.
How to use:
- On the Recipe view of an experiment, right-click a cell that should use Autofill.
- In the popover, set Quantity Fill Behavior to Autofill.
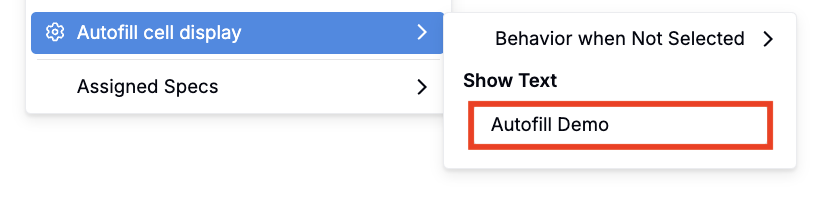
- In the top menu, go to View (File menu) → Autofill cell display.
- Under Behavior when not selected, choose:
- Show Value to always display the autofilled numeric value, or
- Show Text to display a text label when the cell is unfocused.

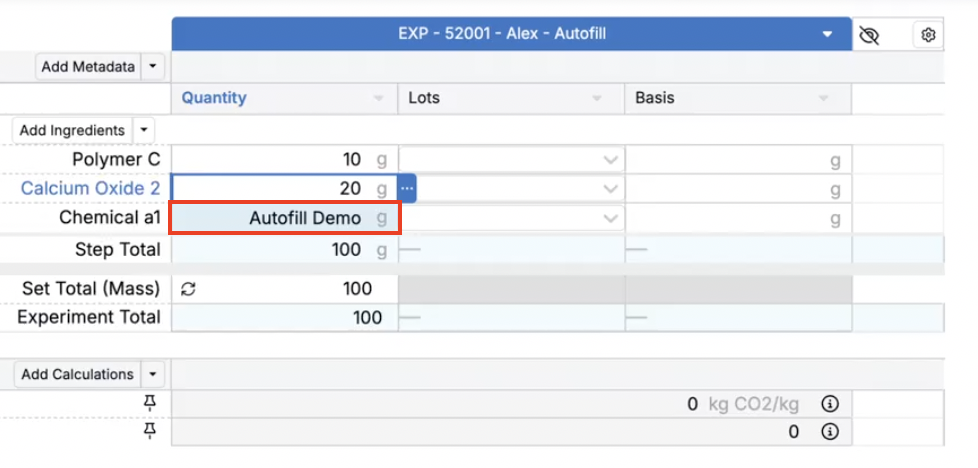
- If using Show Text, the default label is “Autofill” unless the cell is selected.
- You can also edit this label to any custom text using the Show Text field.
Inventory Limits: Use Fields from Mapped Entities in Listing Configs
You can now build dynamic listing config filters that reference fields from a mapped entity, such as an inventory limit. This lets you scope a listing using contextual values stored on the mapped entity (e.g. filtering inventory items by the Lab selected on the inventory limit).
Previously, listing config filters could only reference fields on the base entity being listed. With this update, filters can also pull values from a linked “Mapped Entity” via Use Field, so the listing automatically evaluates using the mapped entity’s field values.
Example use case:
Inventory Limits often need to apply to items in a specific lab/location and those filters are also used downstream (e.g. when an Inventory Limit triggers an approval request). By referencing mapped entity fields, you can configure the filter logic once and have it evaluate correctly per limit.
How to use:
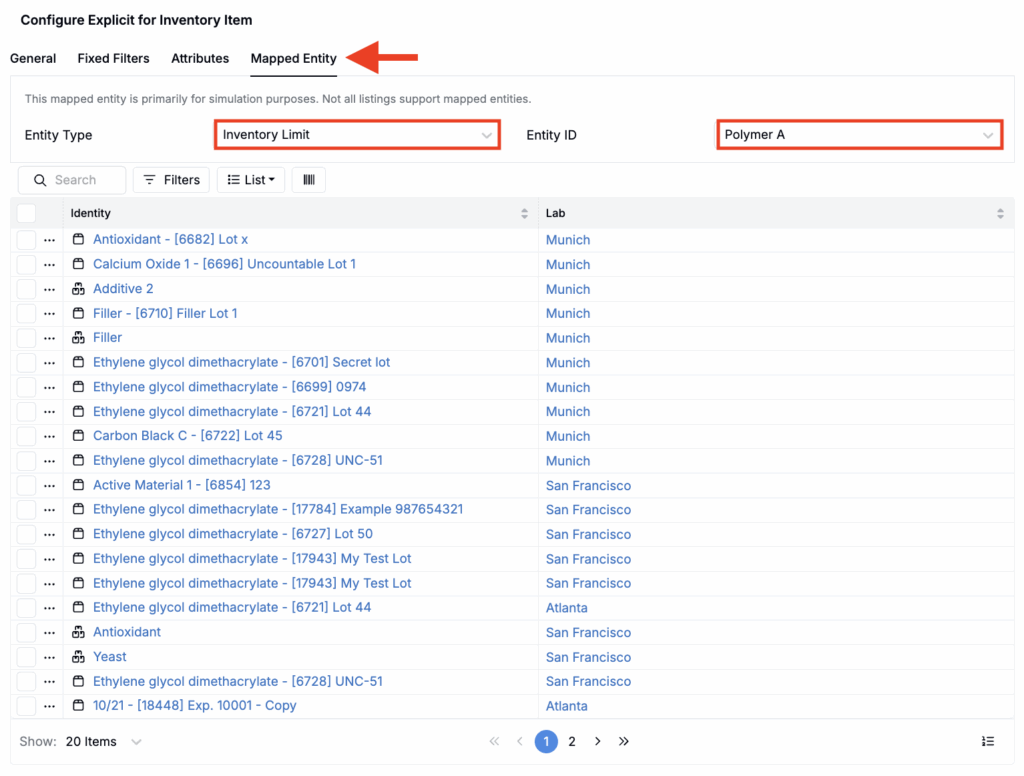
- Open a listing config and go to the new Mapped Entity tab.
- Select the mapped entity type and instance (e.g. an Inventory Limit of Polymer A).
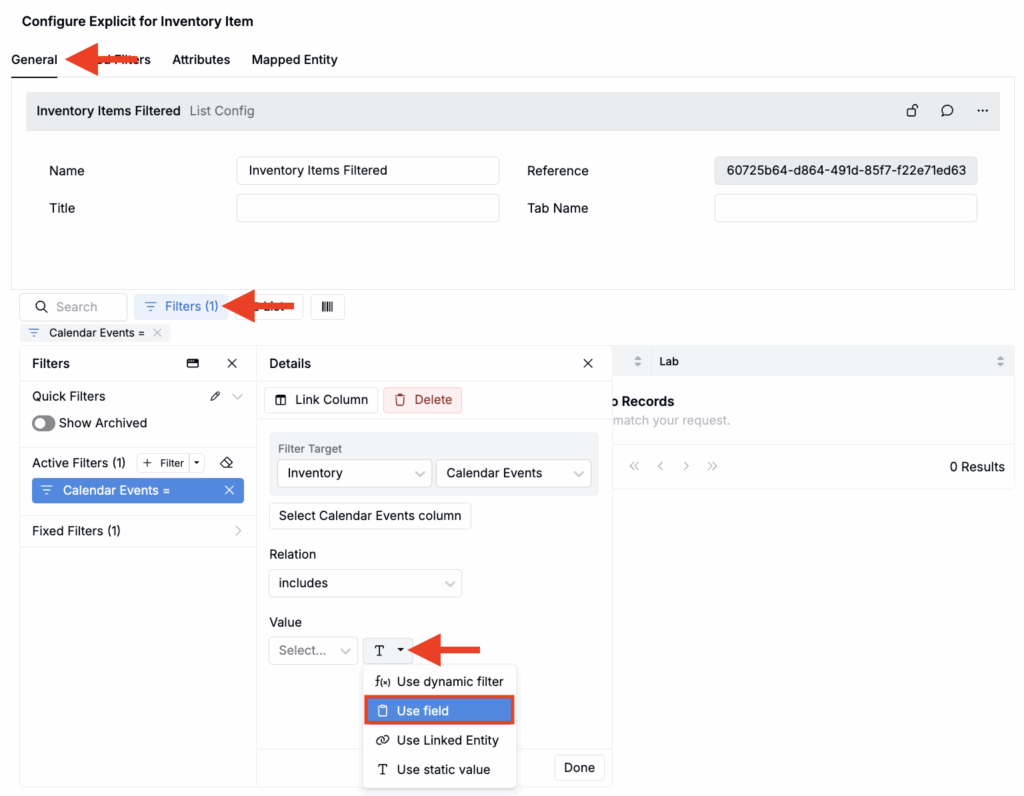
- In the General tab, add a filter.
- Select a filter target and relation.
- Under value, use the selection menu on the right to select Use field.
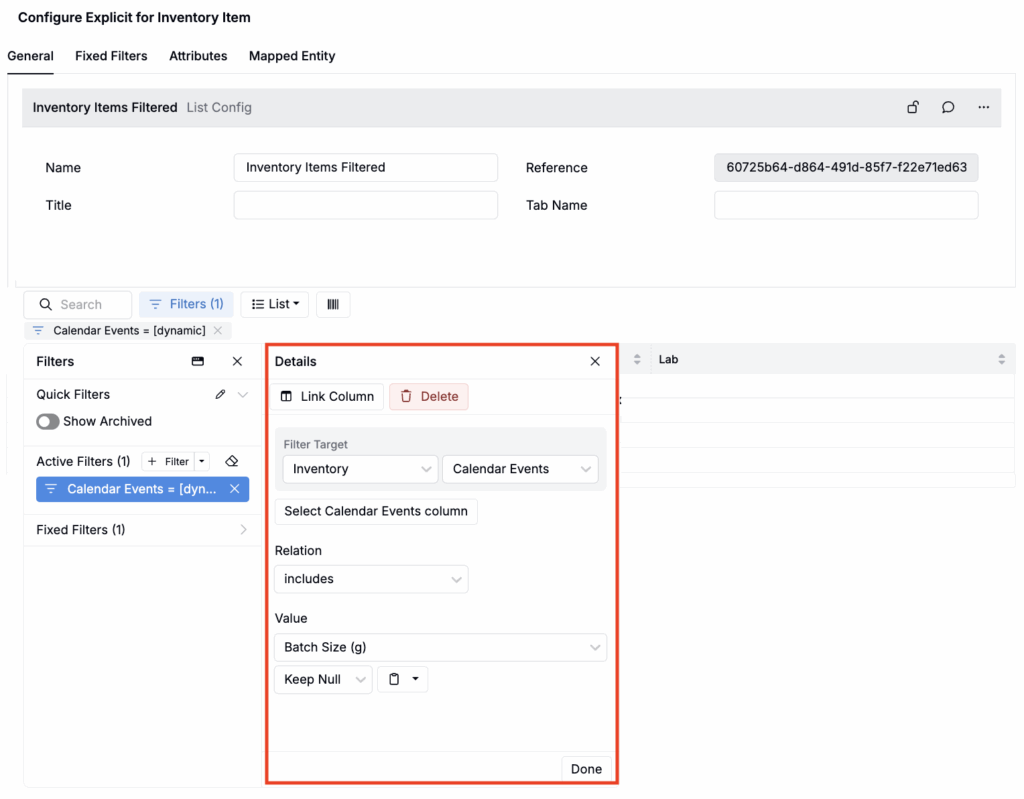
- In the Value field, select from available options (or access the Advanced Search modal for more).
- The listing will now evaluate using the mapped entity’s field values.
Config Transfer Between Schemas (Beta)
A new config transfer feature lets you export definitions from one schema and import them into another, including definition groups, fields, settings, and linked triggers.
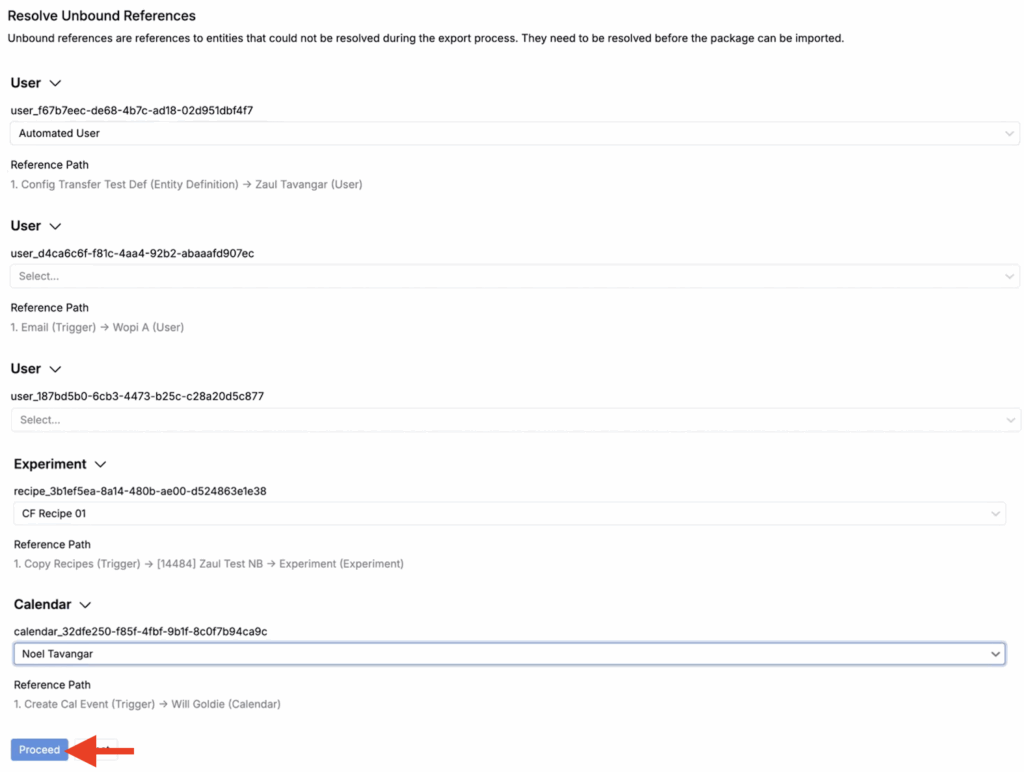
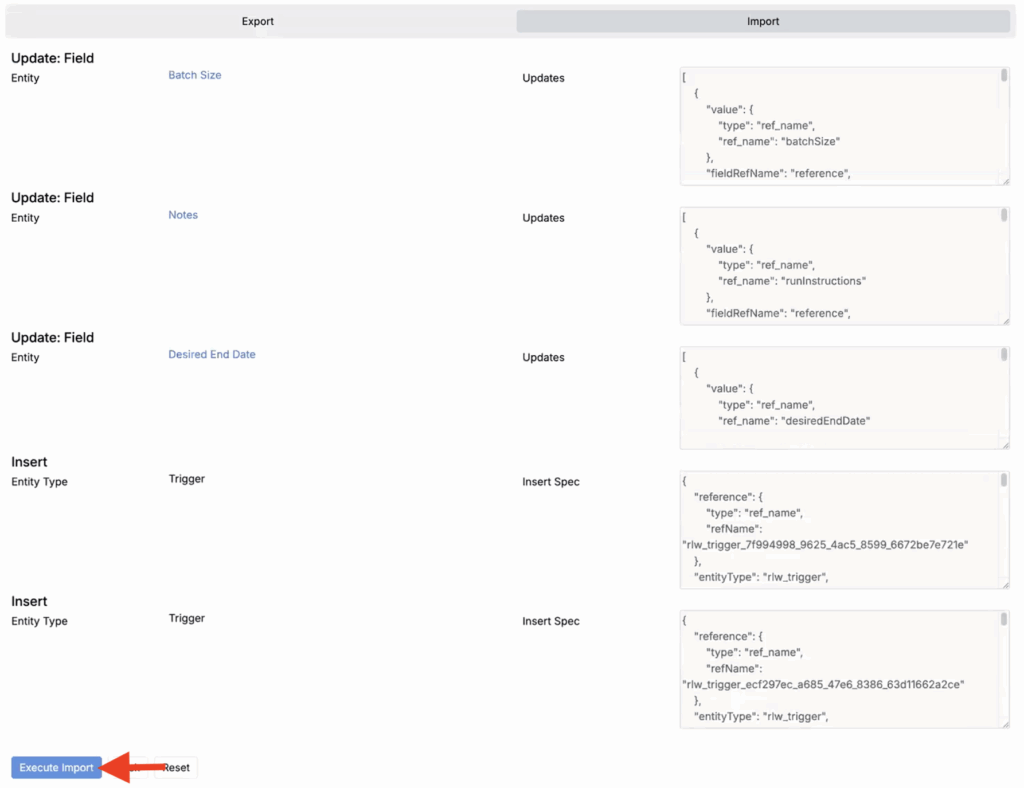
Exports are saved as YAML files that capture the structure of the definition, its settings, and its trigger configurations. During import, you can resolve unbound references (e.g. users, experiments, or other entities that are not yet supported for automatic export) by mapping them to entities in the target schema. A preview screen shows all inserts and updates before they are applied.
How to use:
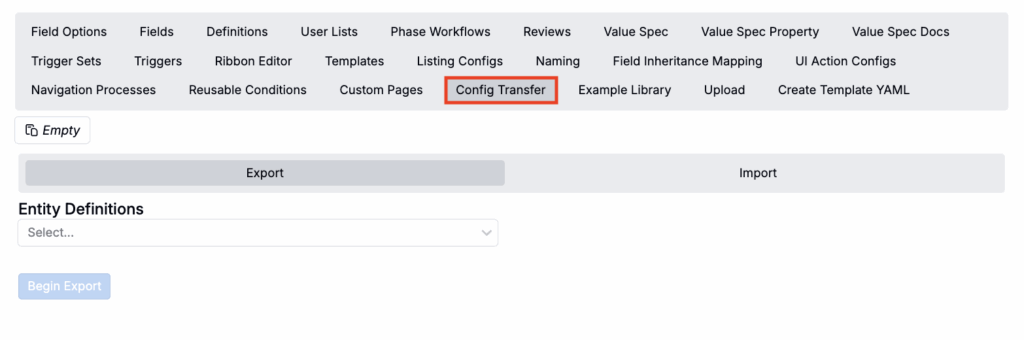
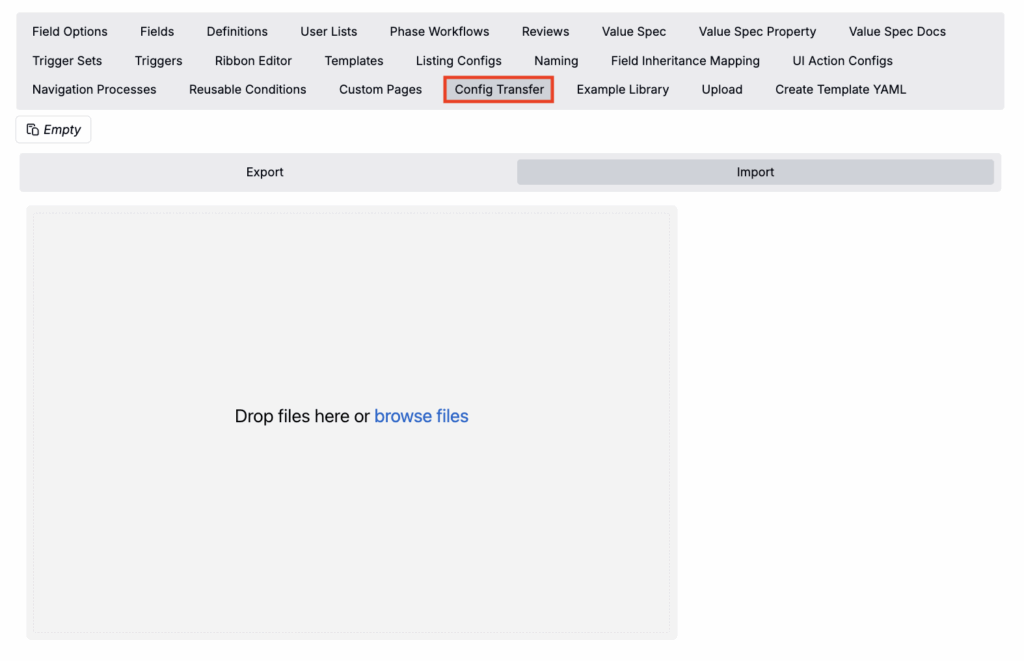
- From the current schema, access the Config Transfer tab of the Form Admin page.
- Select a definition to transfer and click Export.
- A preview will show you anything that will not be transferred.
- This will download a YAML file of the definition.
- In the target schema, open the Config Transfer tab and select Import.
- Upload the YAML file.
- In the Unbound References step, map any unresolved entities (such as users or experiments) to entities in the target schema and click Proceed.
- Review the proposed inserts and updates, then click Execute Import to apply the changes.
This feature is currently in beta. Support for transferring additional entities will be expanded in future releases.
Concurrent Recipe Editing Improvements
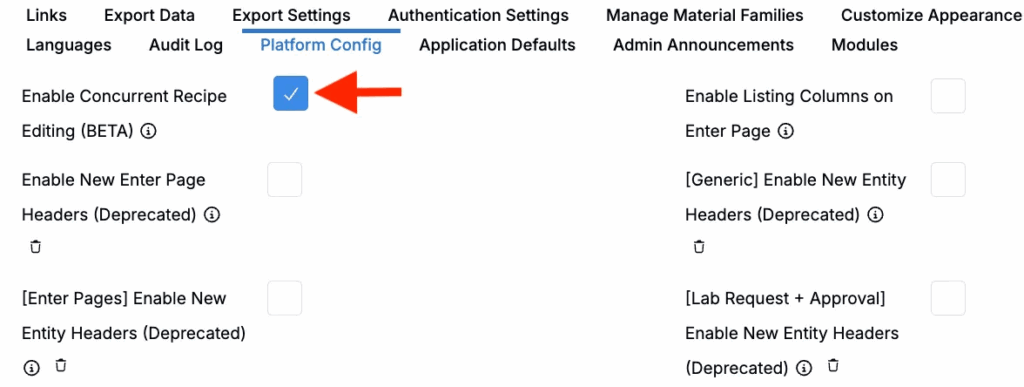
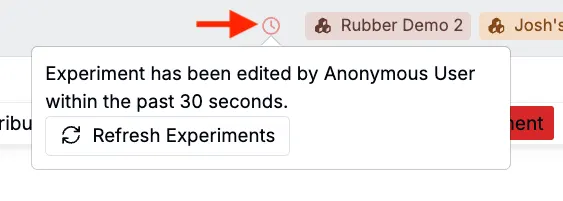
A new Enable Concurrent Recipe Editing flag in Platform Config shortens the recipe edit lock timeout from 5 minutes to 30 seconds and improves visibility for multi-user editing.
When one user edits a recipe, other users see a lock notice and a message showing who last edited the recipe. After 30 seconds, recipes automatically refresh so that users see the latest values before making new edits. Note that inventory items and lots remain editable even while the rest of the recipe is locked.
How to use:
- In Company-Wide Settings > Platform Config, enable Enable Concurrent Recipe Editing.
- Once enabled, on the recipe or measurements view of an experiment:
- If User A edits the recipe, User B will see a lock message in the experiment header and a prompt to Refresh Experiments.
- After refreshing, User B sees the updated recipe and can begin editing.
Import Word Documents into Notebooks with Formatting
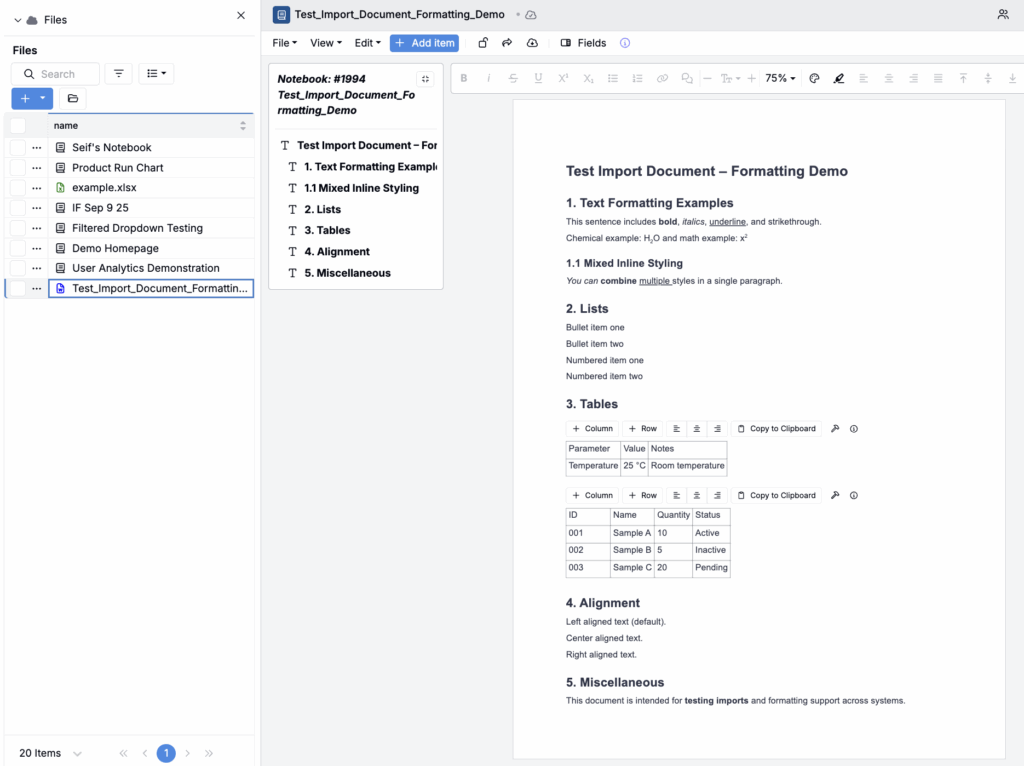
You can now import Word documents (.docx) into Notebooks while preserving rich formatting, including headings, tables, lists, hyperlinks, styling, and most images.
Previously, importing Word content into notebooks supported only plain text. With this update, migrated documents retain structure and formatting, making it easier to move reports, protocols, and historical documentation into Uncountable.
How to use:
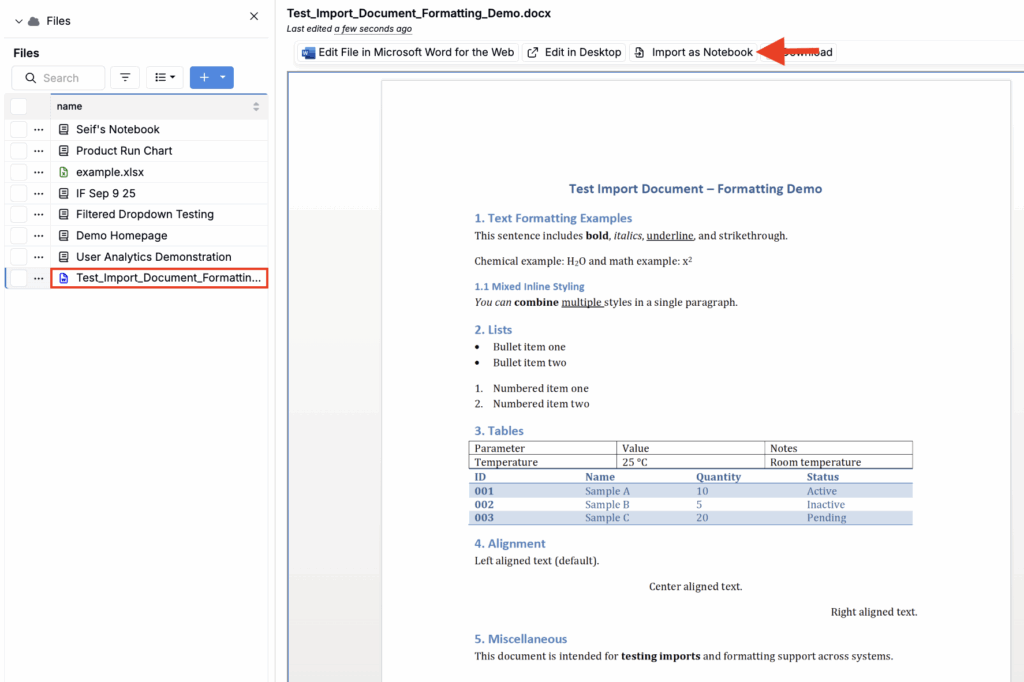
- Upload a Word document into a File Folder.
- Click the uploaded file to open the preview.
- Use the Import to Notebook action to create or update a notebook with the documents contents.
- Review the imported notebook and make any final inline edits as needed.
Rename Experiments in the New Create Experiment Modal
When using the New Create Experiment modal (beta) to create a new experiment from an existing one, you can now rename the experiment.
Previously, cloned experiments could only be distinguished by suffixes, leading to long or ambiguous names. Now, when the new modal is enabled, you can assign a completely new name to each experiment.
Note that you must enable the New Create Experiment modal (Company-Wide Settings > Platform Config > Enable New Create Experiment Modal) to use this feature.
How to use:
- Create a new experiment.
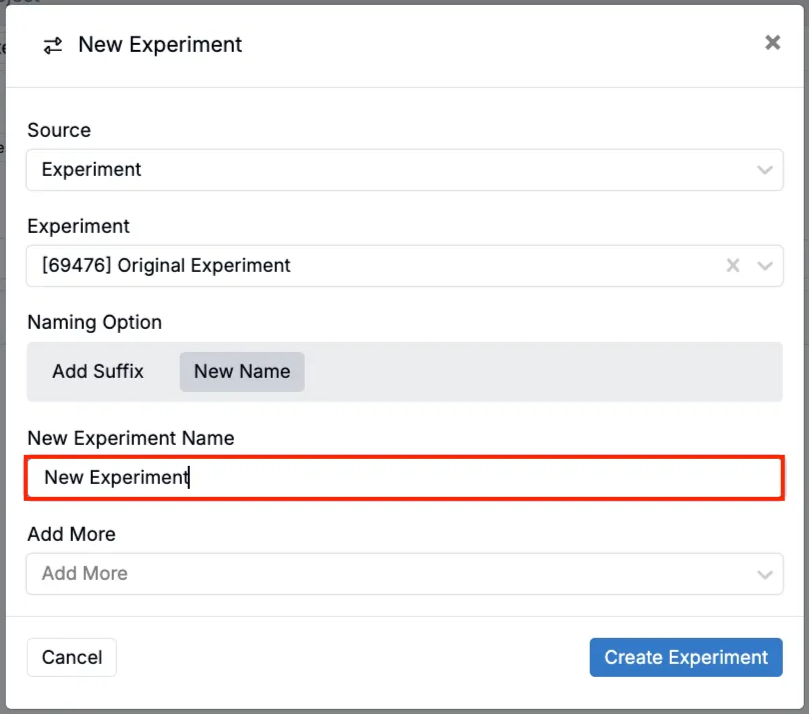
- In the modal, set source to Experiment and select an experiment to copy from.
- Under Naming Option, select New Name.
- Add a new experiment name.
- Click Create Experiment.
Curve Output Rounding Preferences on Measurements
Curve outputs on the Measurements page now recognize rounding preferences for the X and Y axes. Previously, rounding preferences were not supported for this output type.
This is useful when plotting large values or outputs with many decimal places. You can choose default rounding, significant figures, or fixed decimal places to make curves easier to read during analysis and in exports.
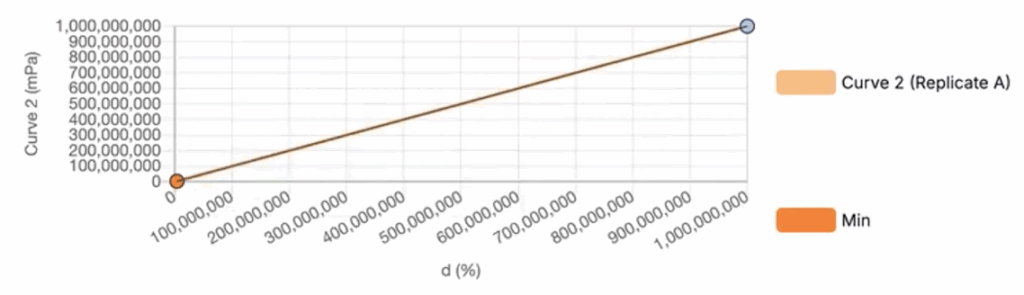
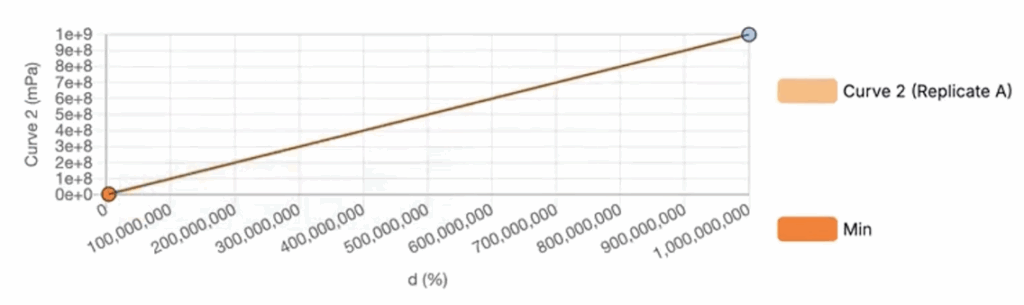
How to use:
- Access the output details page for any curve output.
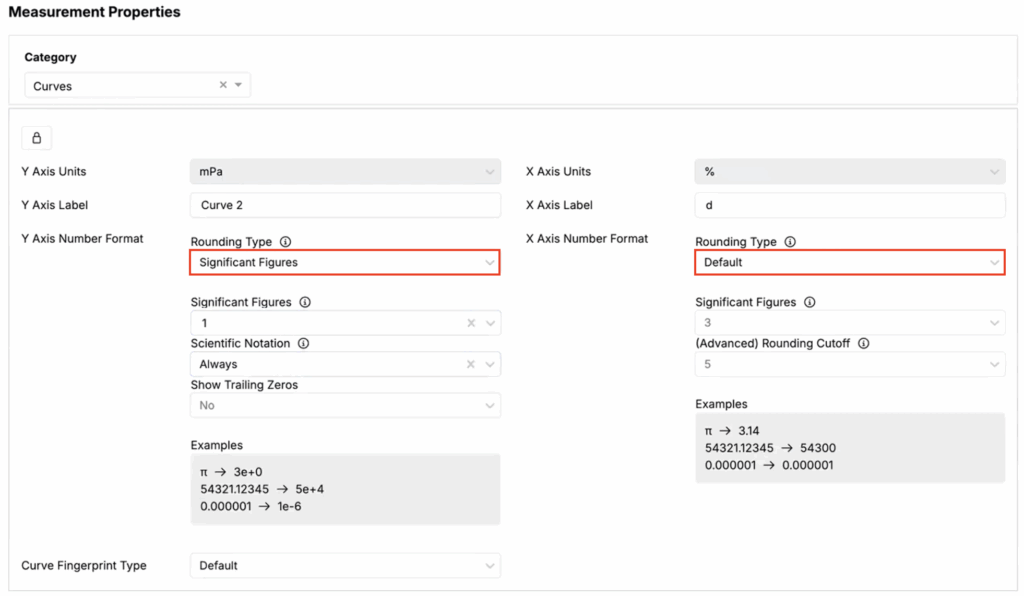
- Under Measurement Properties:
- Set the X and/or Y Axis Rounding Type (Default, Decimal, or Significant Figures)
- Set number of significant figures, scientific notation, and trailing zeros
Once set, the same rounding preferences will apply across all experiment that reference the curve.
Layout Settings Sidepanel
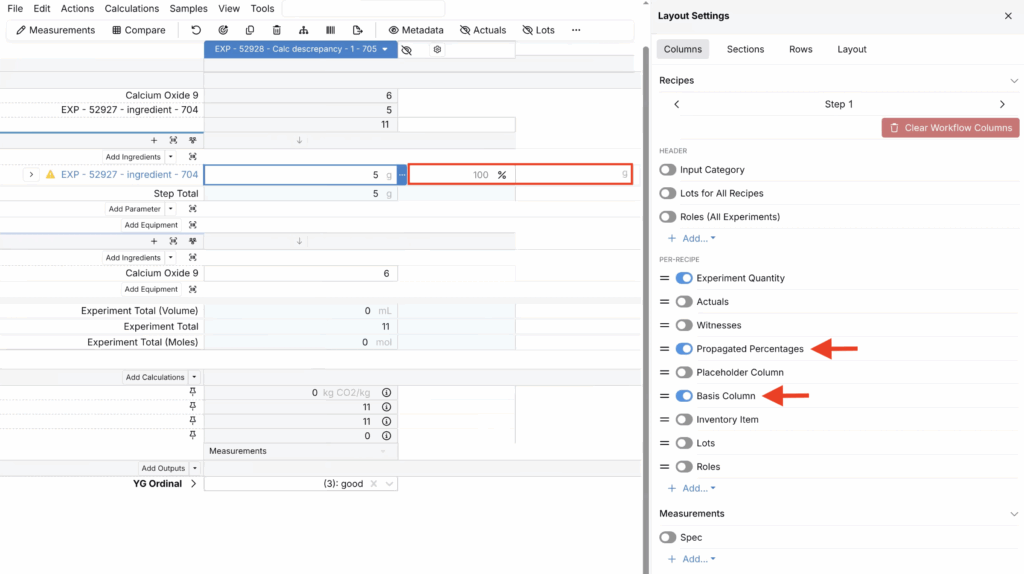
The new Layout Settings sidepanel provides a more intuitive and streamlined way to configure your recipe view across different workflow steps. While previous configuration options (e.g. the Configure Workflow Step sidepanel) are still available, this sidepanel brings layout and column controls together in a single, easier-to-use experience.
With Layout Settings, you can tailor your recipe page per workflow step, ensuring that only the most relevant recipe and measurement columns are shown at each stage of your process. You can also adjust sections, rows, and other layout settings independently for each step.
How to use:
- From the recipe view, open the Layout Settings sidepanel.
- Use the side arrows to move between workflow steps.
- For each step:
- Toggle columns on or off to control which header, per-recipe, and measurement columns are shown
- Configure sections, rows, and other layout settings as needed
Column Formatting in Tables and Measurements
A new Column Formatting option is now available in the Recipe and Measurements view of experiments. This complements the existing Cell and Row Formatting options, making it easier to apply consistent styling across an entire column.
Use column formatting this to emphasize key attributes, outputs, or status fields without having to manually format each cell.
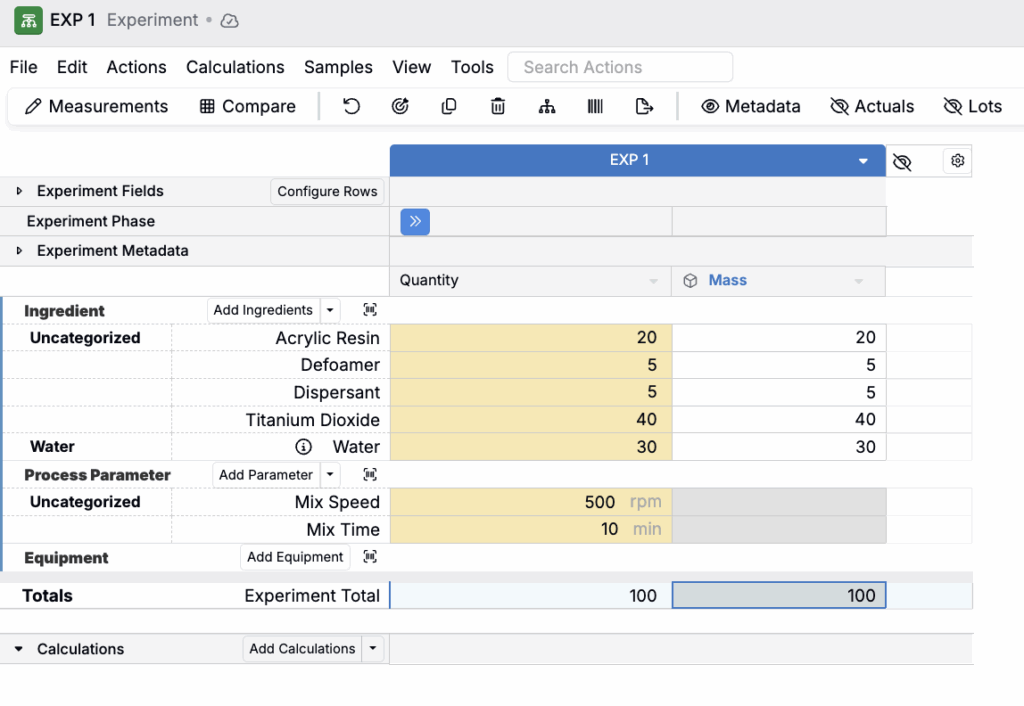
How to use:
- On the Recipe or Measurements view, right-click on any cell within a column.
- Select Column Formatting > Set Color.
- Choose your background color and click Close.
- To remove formatting, select Column Formatting > Clear Color.
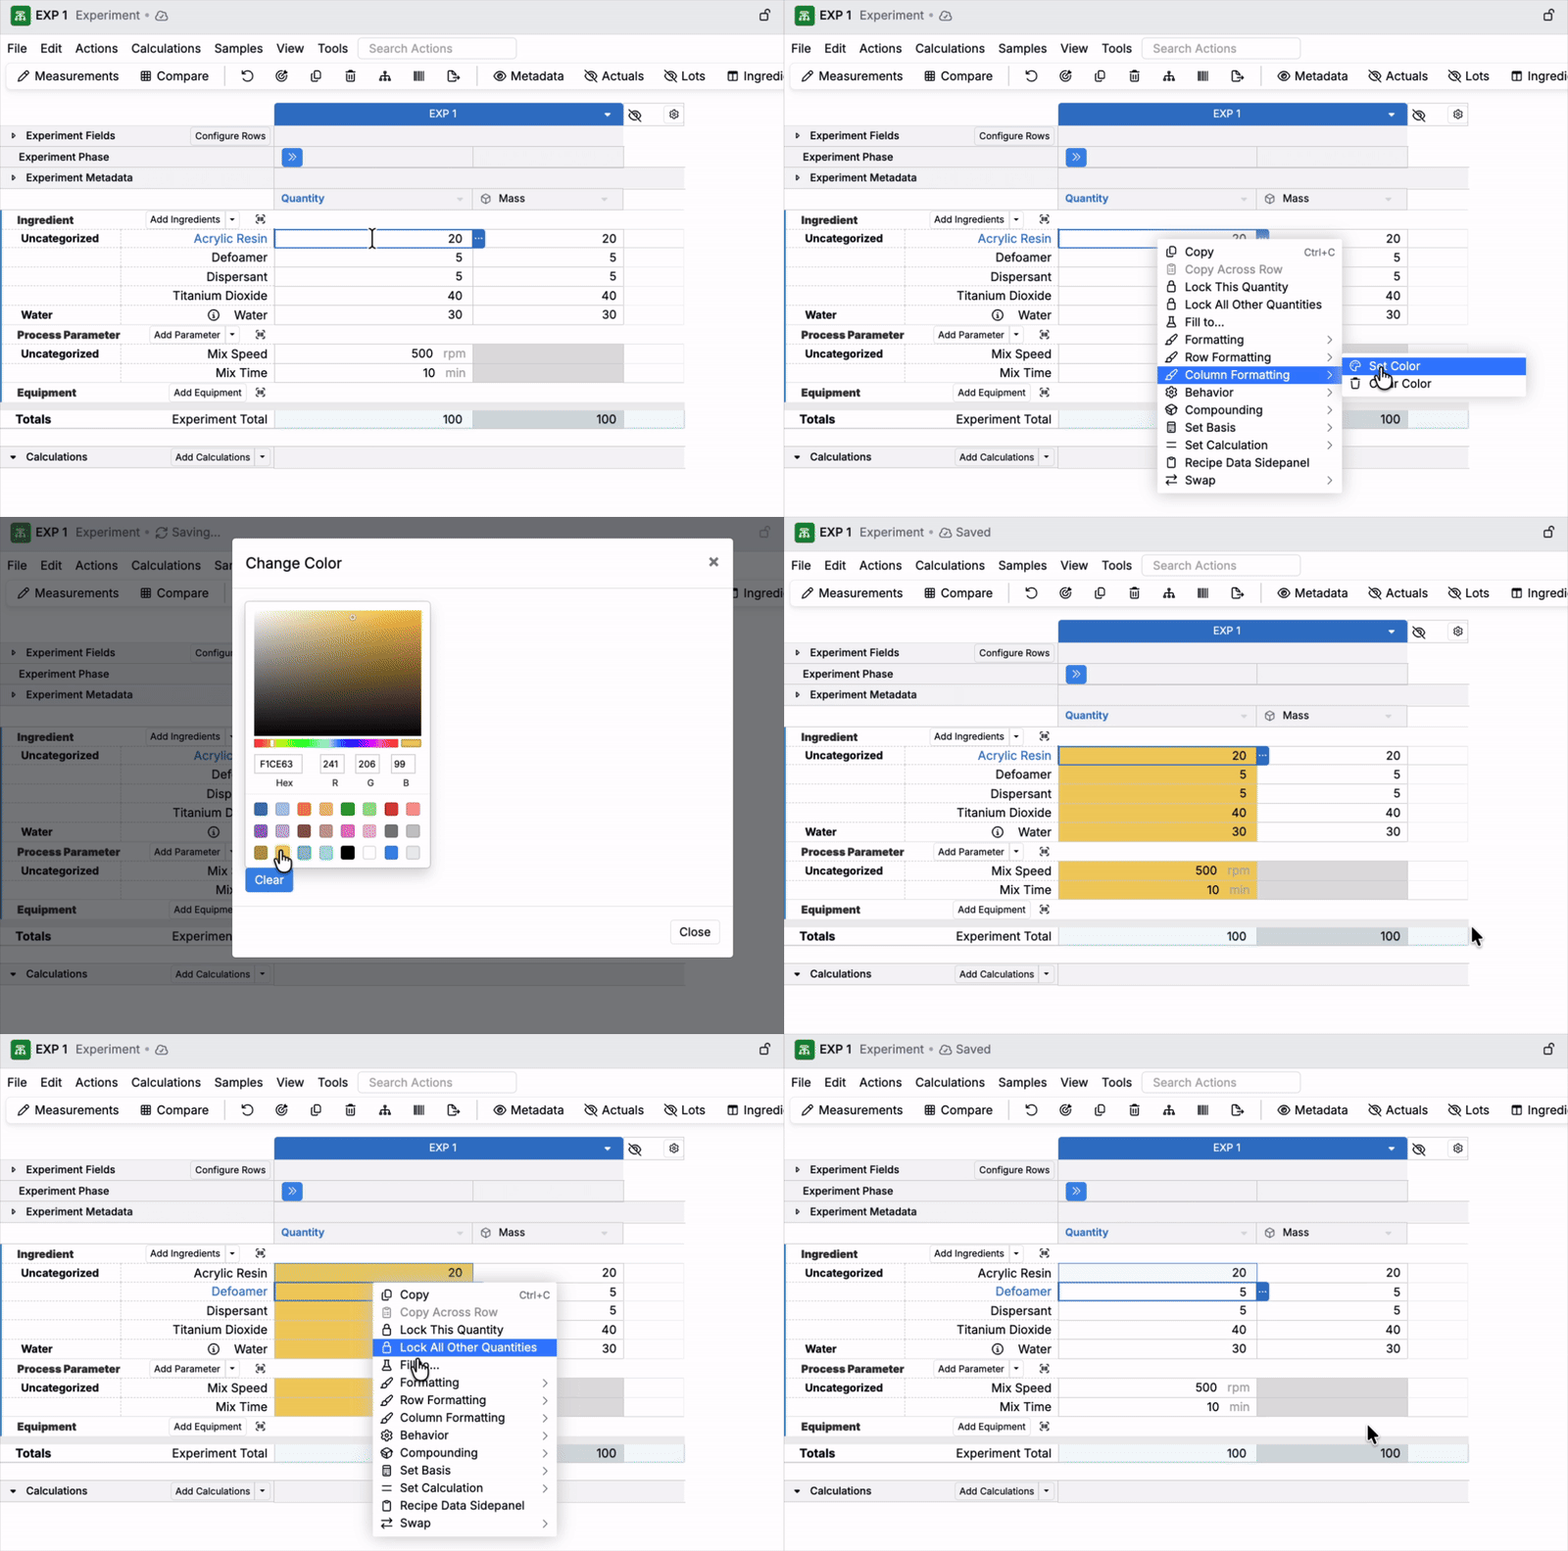
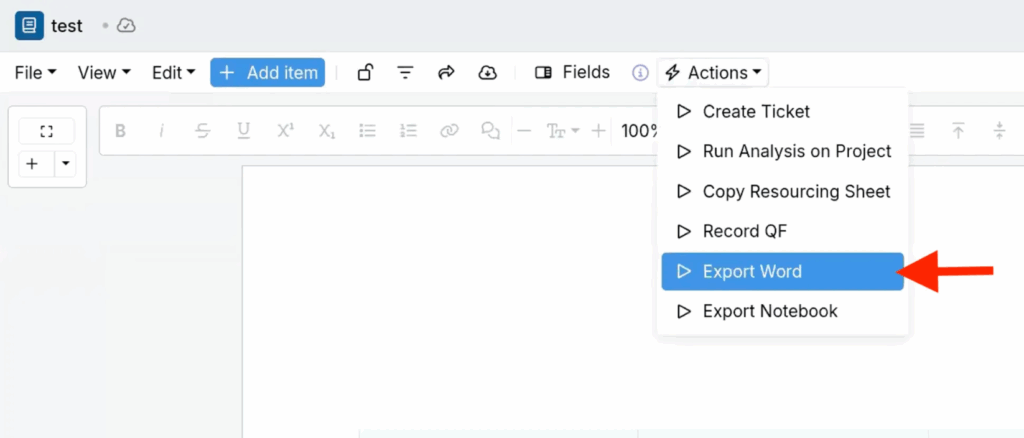
Export Notebooks as .docx Files via Trigger
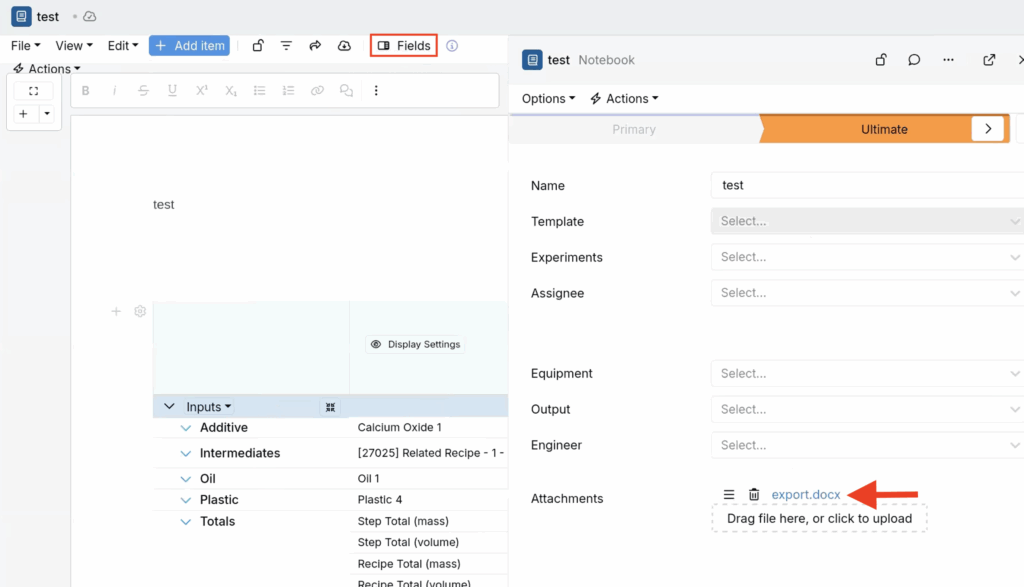
A new trigger action lets you export notebooks as Word documents. The exported notebook is then attached as an attachment field on the notebook for download.
By setting up this trigger on your notebooks, teams can standardized exports of notebooks for reports, quality documentation, or customer deliverables. Exports run asynchronously so they do not block users while files are being generated.
How to use:
- To a notebook’s trigger set, add a trigger with a Export Notebook trigger action.
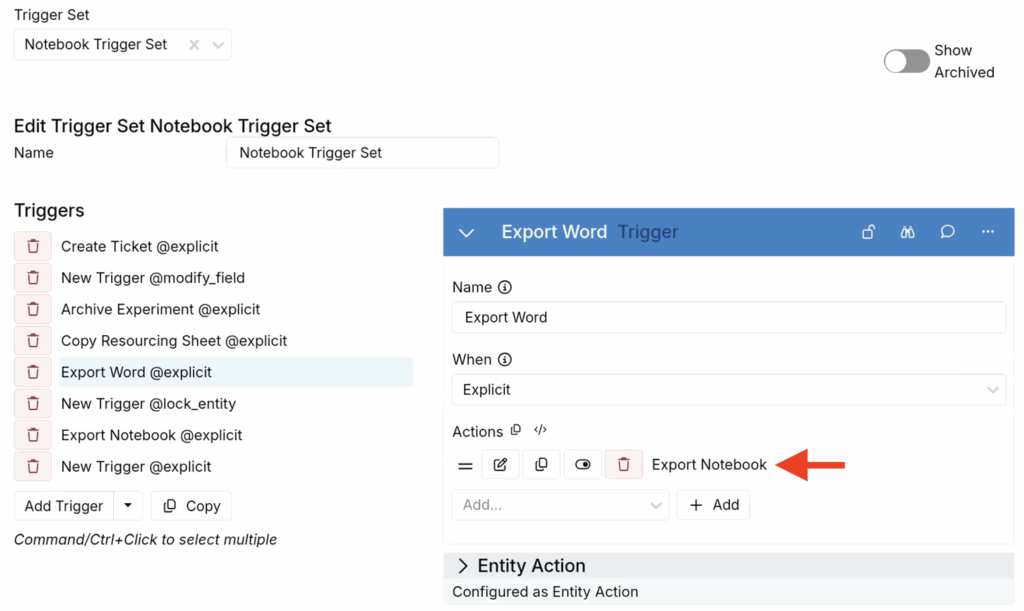
- Configure the trigger action.
- Set Field to Attachments
- Type to NotebookExportFormatDocx
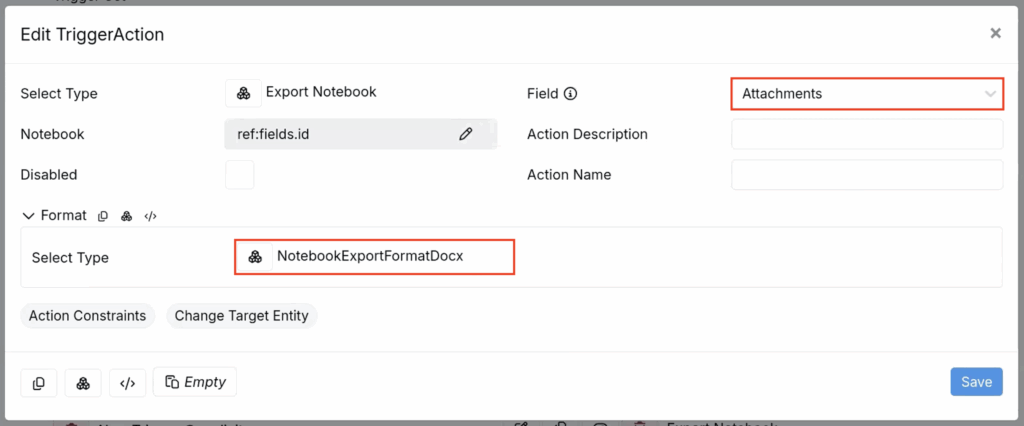
- Run the trigger from the notebook.
- After processing, the exported .docx file appears within Fields as an attachment.
User Activity Charts Update
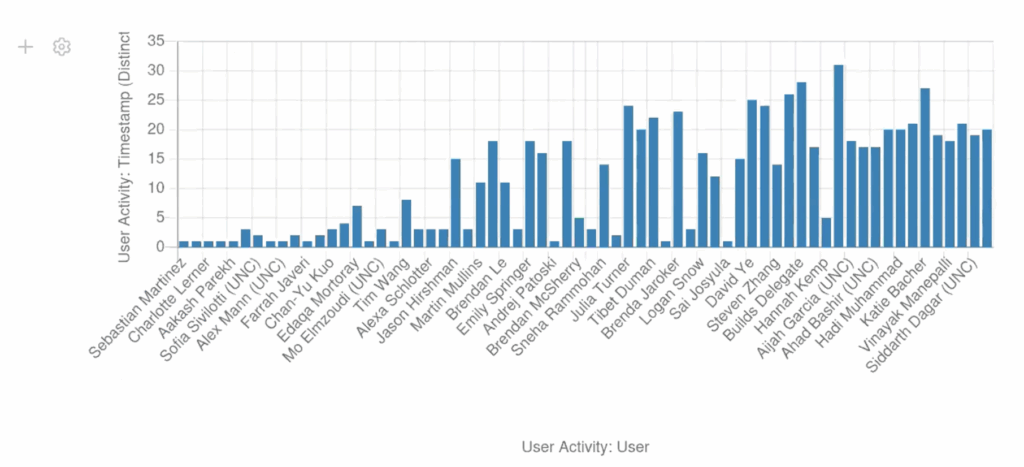
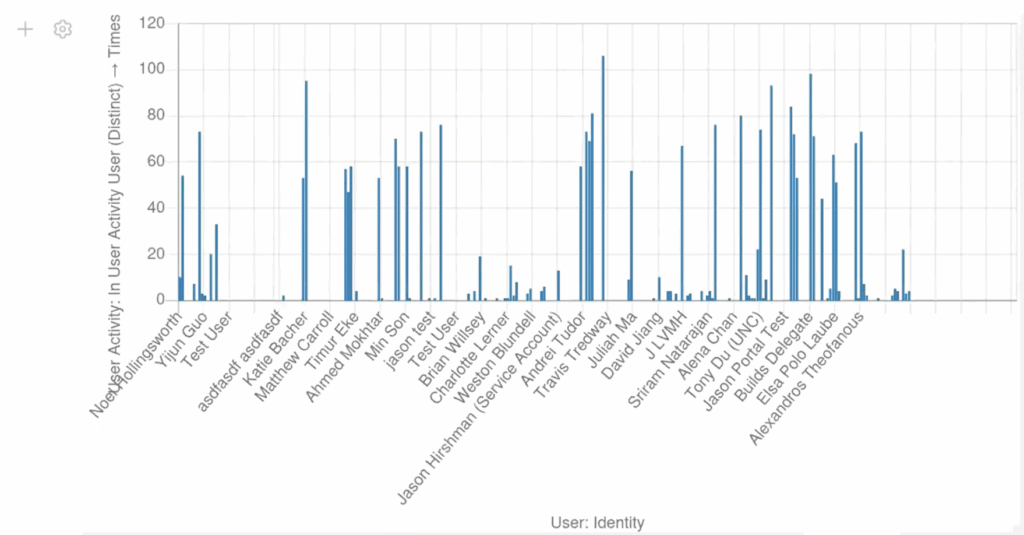
Dashboard charts of user activity can now be configured to include all users, including those with no activity in the selected time range, using transitive aggregates and reverse relations.
Previously, creating a chart with a User Activity base would omit all users with no activity, making it difficult to get a complete picture of your team’s engagement.
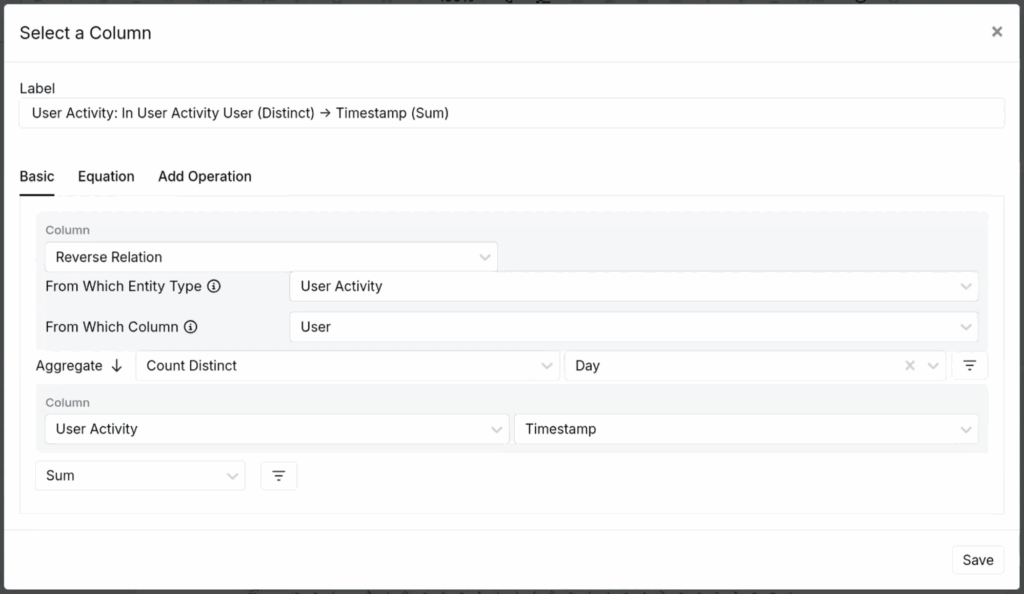
Now, by building aggregations from a base entity like Users and using a reverse relation to an activity table, dashboards can count distinct active days while still listing users who had zero activity (displayed as 0 instead of being omitted).
How to configure:
- To your dashboard notebook, add a chart with a User entity type.
- In the Configure Chart modal, add a column that uses a Reverse Relation from the base entity to your activity table.
- Set From Which Entity Type to User Activity
- Set From Which Entity Column to User
- Set Column to User Activity + Timestamp
- Aggregate over Count Distinct + Day
- Set the bottom field to Sum
- Save your chart.
Recipe Output Fields in Output Calculations
You can now reference recipe output field values directly in output calculations.
Previously, output calculations could only use static values or output metadata as variables. With this update, you can include numeric output fields as variables in your calculation logic.
This is especially useful for workflows where calculated results depend on per-recipe context rather than fixed assumptions. For example, you can normalize or scale measured outputs based on batch size or create more reusable calculations that adapt automatically as recipe values change.
Note: This capability is currently supported for numeric recipe output fields only. Support for date and datetime recipe output fields is planned for a future release.
How to use:
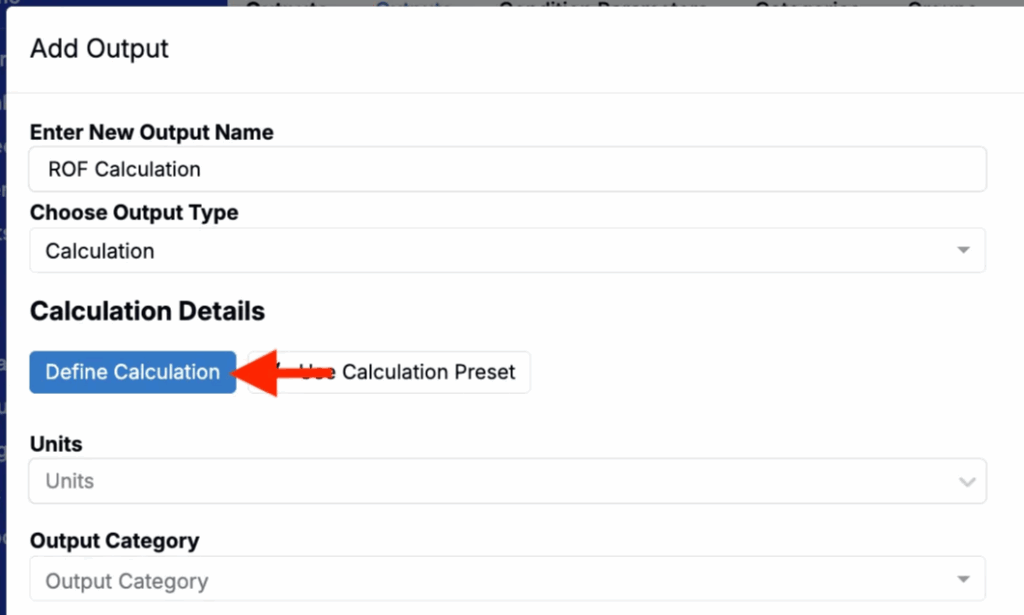
- Create a new output calculation.
- Click Define Calculation.
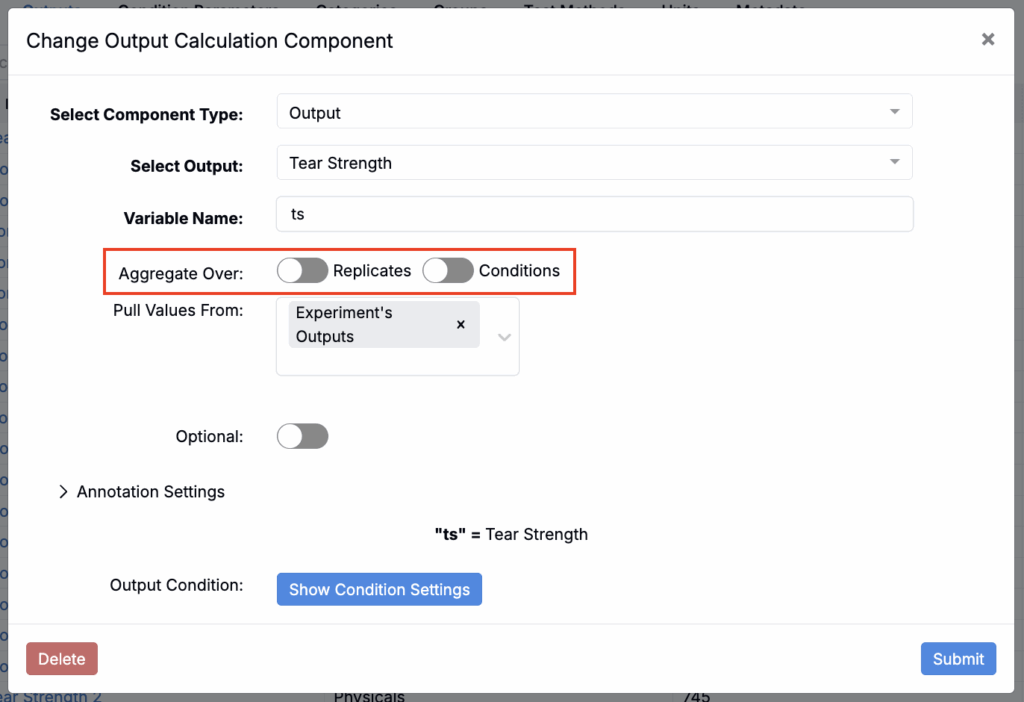
- Add an output as a variable (e.g. Tear Strength).
- Note that aggregations must be disabled to use recipe output fields in the calculation.
- After submitting the output variable, click Edit.
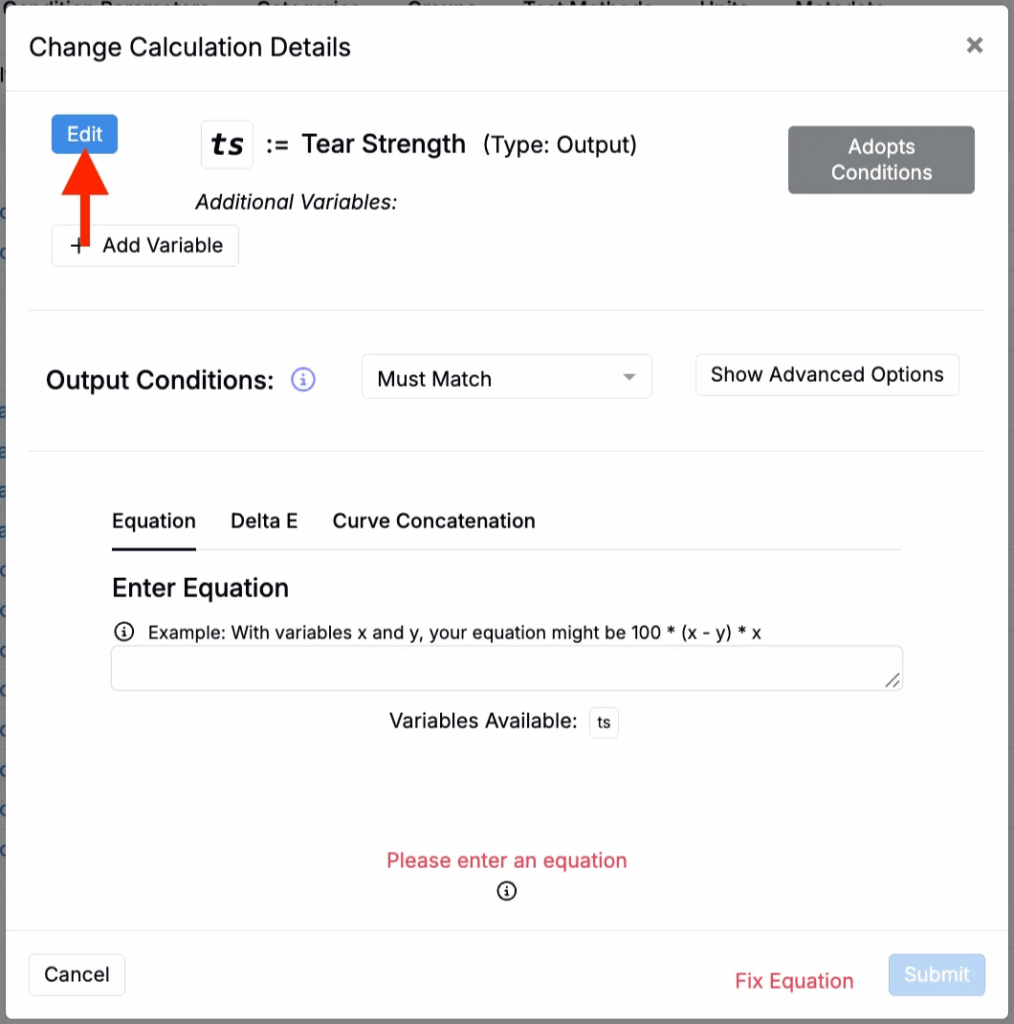
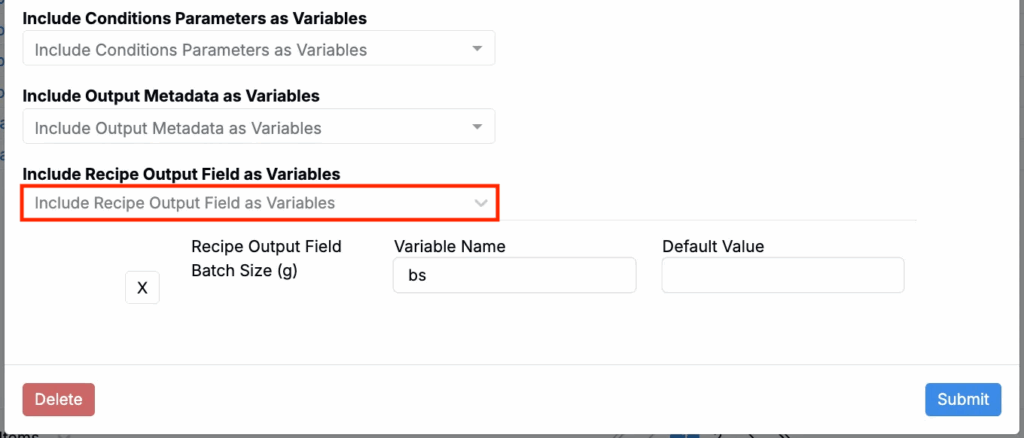
- At the bottom of the modal, use the Include Recipe Output Field as Variables field to select a recipe output field (e.g. Batch Size). Add a variable name and optional default value.
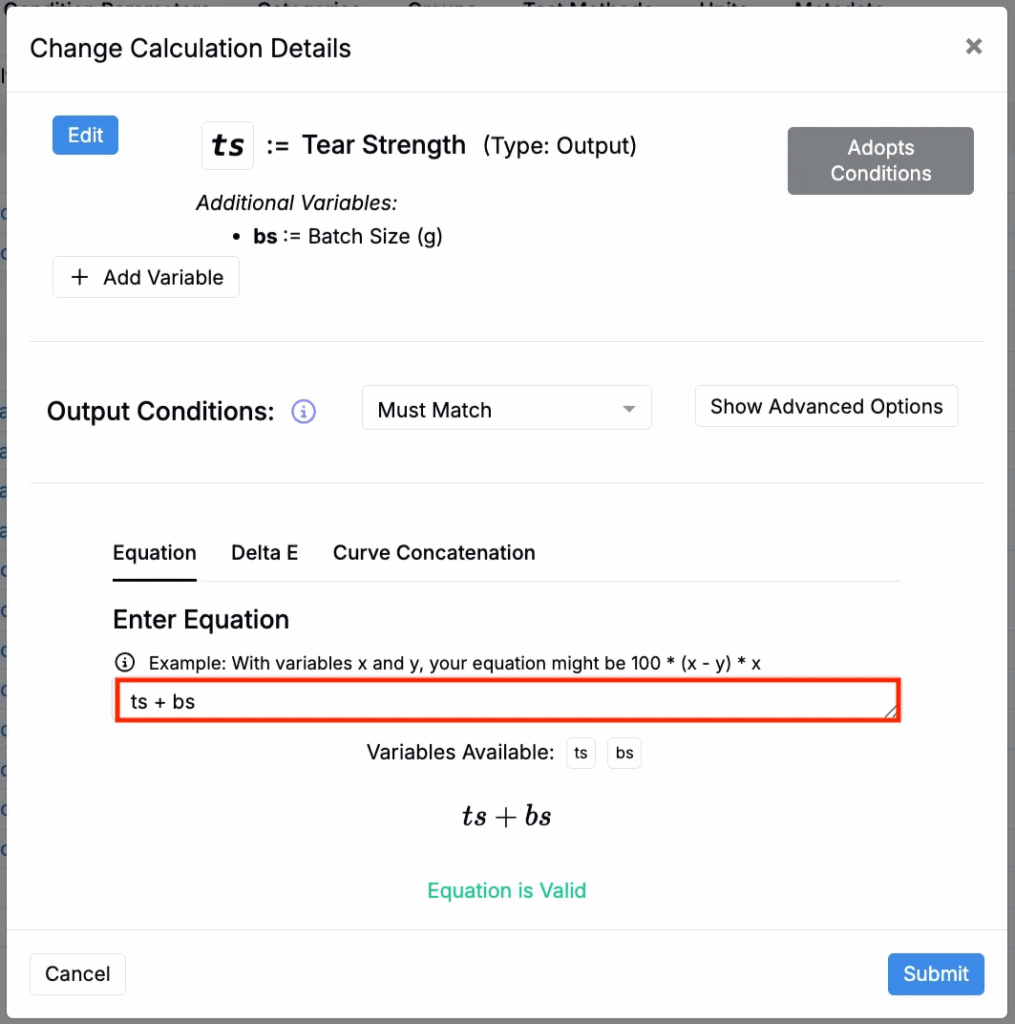
- Last, use the Enter Equation field to define your calculation equation (e.g. ts + bs) and submit.
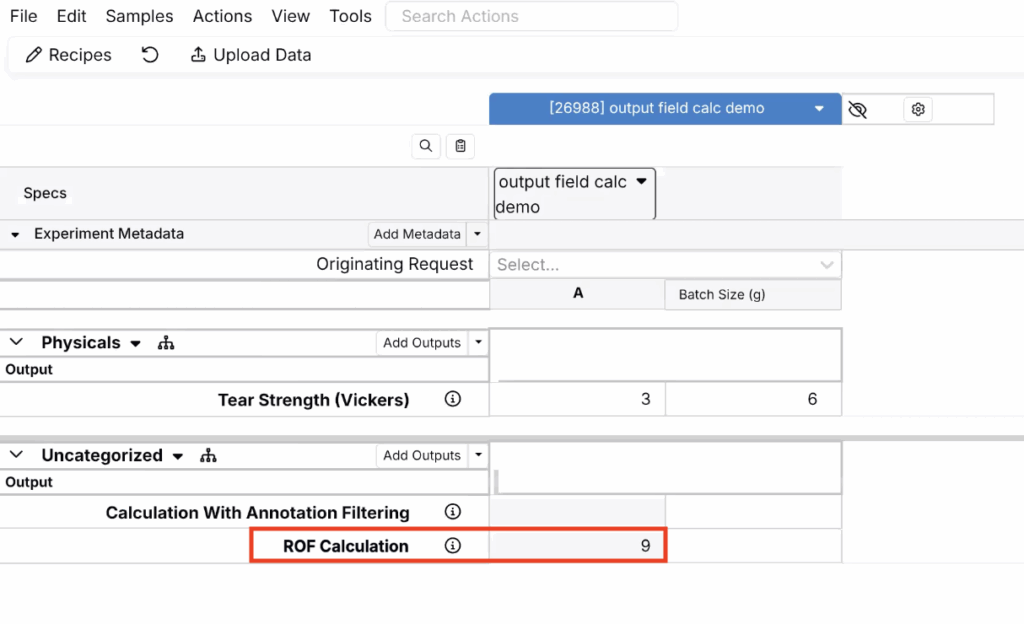
Once submitted, you can use the calculation in your workflow. In the example below, with a Tear Strength of 3 and a Batch Size of 6, the calculated ROF Calculation value is 9.
Help Bot: Structured Search Agent
We’ve added a new Structured Search agent to the Uncountable Help Bot making it easier to discover relevant experiments without manually configuring listings.
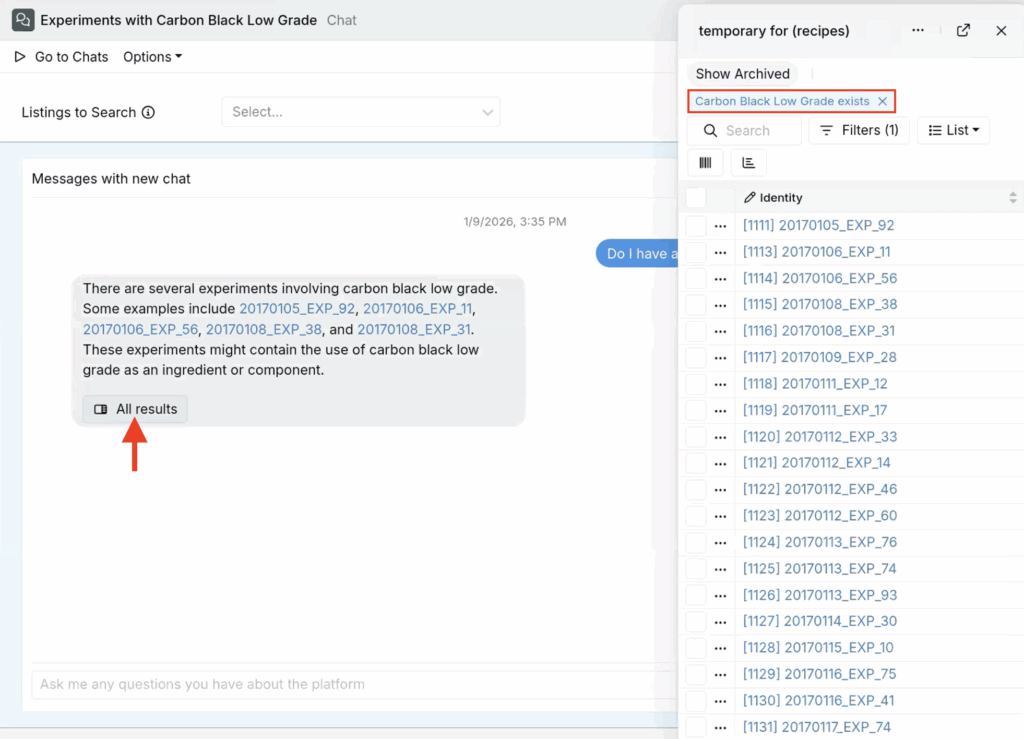
Previously, users needed to build listing configs or filters by hand to answer questions like “show me all experiments that used carbon black.” With the Structured Search agent, you can ask these questions directly in natural language, and the system will generate and run the underlying listing configuration for you.
How to use:
- In the Uncountable navigation bar, click Ask AI to access the help bot.
- Ask a question similar to how you would configure a listing (for example: “Do I have any experiments with carbon black low grade?”).
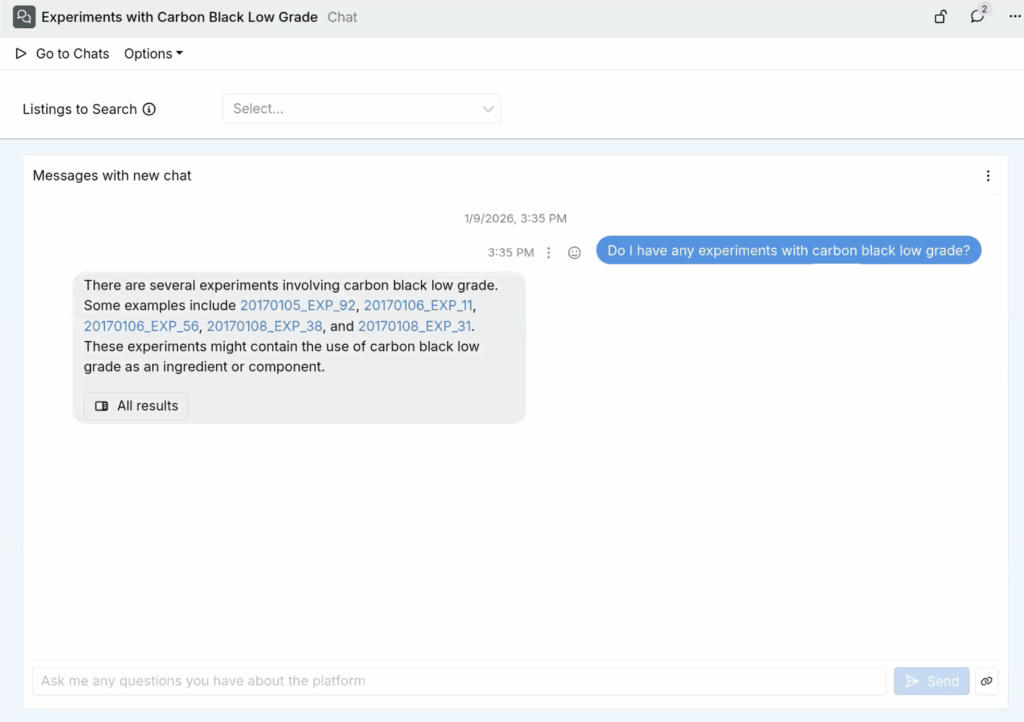
- The Help Bot will return a response, including example experiments.
- Click All Results to open the listing in a sidepanel, with the appropriate filters automatically applied. Here, you can inspect and adjust the listing configuration if needed (e.g. adding additional filters or columns).
Notebook Folder Navigation Shortcut
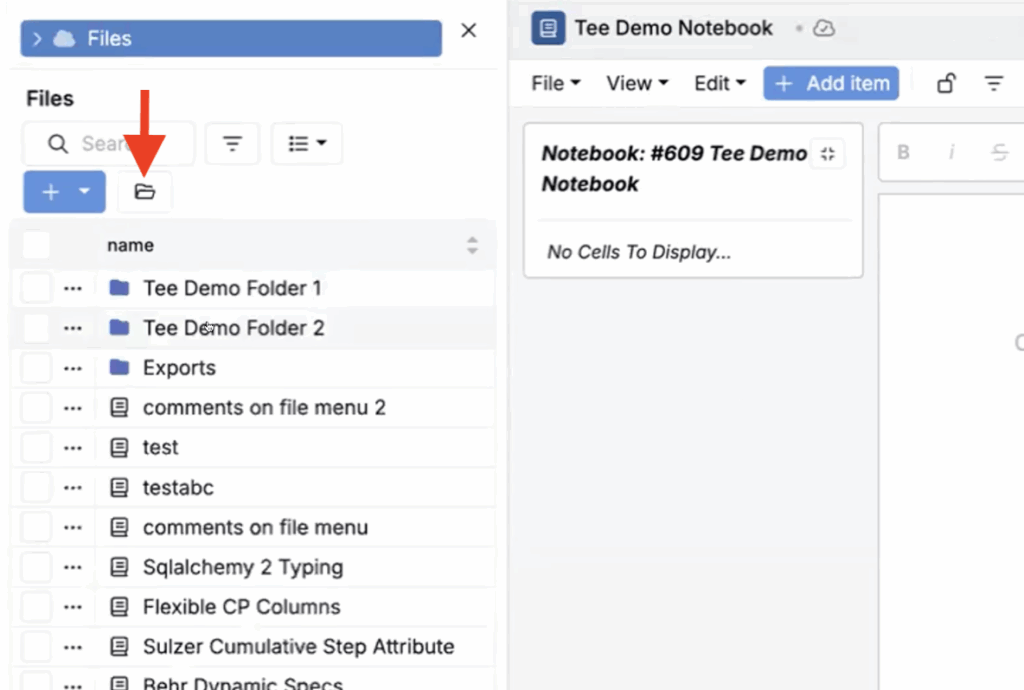
A new Go to Folder shortcut in the Files sidepanel lets you quickly jump to the folder where you currently viewed notebook is located.
This is especially helpful when you’re browsing multiple folders to attach files or reference related documents, and need to return quickly to your notebook’s location without manual navigation.
How to use:
- Open any notebook.
- Open the Files sidepanel.
- Navigate to any folder (other than the one containing your notebook).
- Click the folder button to return to your notebook’s current folder.