Inclusive Ranges for Specs
Range goals in Specs now support flexible bound types, so you can precisely match measurement requirements.
Previously, ranges were always fully inclusive, meaning both the lower and upper bounds counted as passing values. Now you can choose whether each bound is inclusive (the value at that edge passes) or exclusive (it doesn’t).
A common case: use (0, u] when a value must be greater than zero but zero itself should fail — like a concentration that can’t be zero.
Range types:
| Range | Type | Meaning | Example use case |
|---|---|---|---|
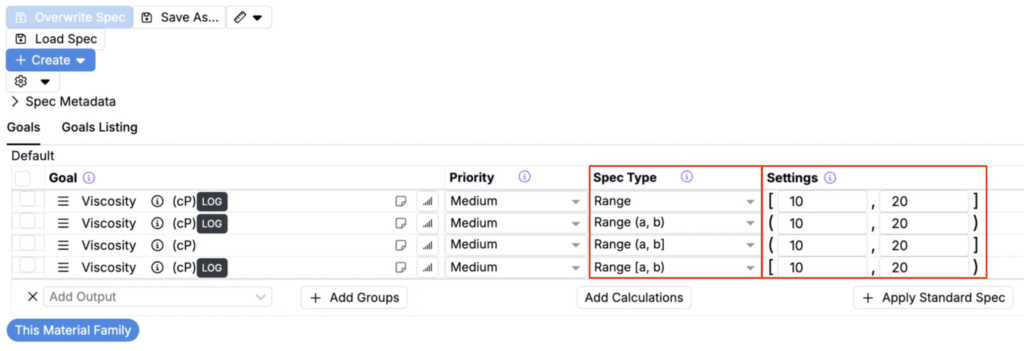
| Range | [l, u] | Both bounds inclusive (existing) | Value must be between 10 and 20, including 10 and 20 |
| Range [a,b) | [l, u) | Lower inclusive, upper exclusive | Value must be ≥ 10 and < 20 |
| Range (a,b] | (l, u] | Lower exclusive, upper inclusive | Value must be > 10 and ≤ 20 |
| Range (a,b) | (l, u) | Both bounds exclusive | Value must be strictly between 10 and 20 |
To set a range type:
- Go to the Specs page and select a spec goal from the Goals table.
- Under Spec Type, choose Range, Range (a,b), Range (a,b], or Range [a,b).
- Enter your bounds in Settings.
Notebooks: Filter Table Builder Cells
Notebooks now support filtering Table Builder–backed cells.
Previously, notebook filters did not affect table builder cell values, which meant teams using notebooks as dashboards or summary views had to manually manage what data was displayed, or build separate notebooks scoped to different experiments. Now, table builder cells respect active filters when live update mode is enabled, making it much easier to use a single notebook across multiple experiments or contexts.
This is especially useful for dashboard-style notebooks and summary reports where you want the same table to automatically reflect whichever experiment or data slice you’re currently focused on.
How to use:
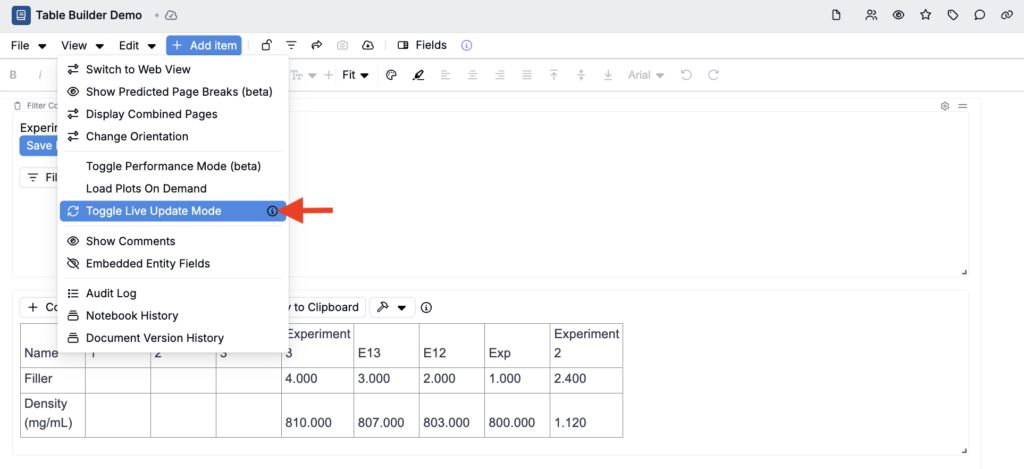
- In any notebook with a table cell, enable Live update mode (View > Toggle Live Update Mode).
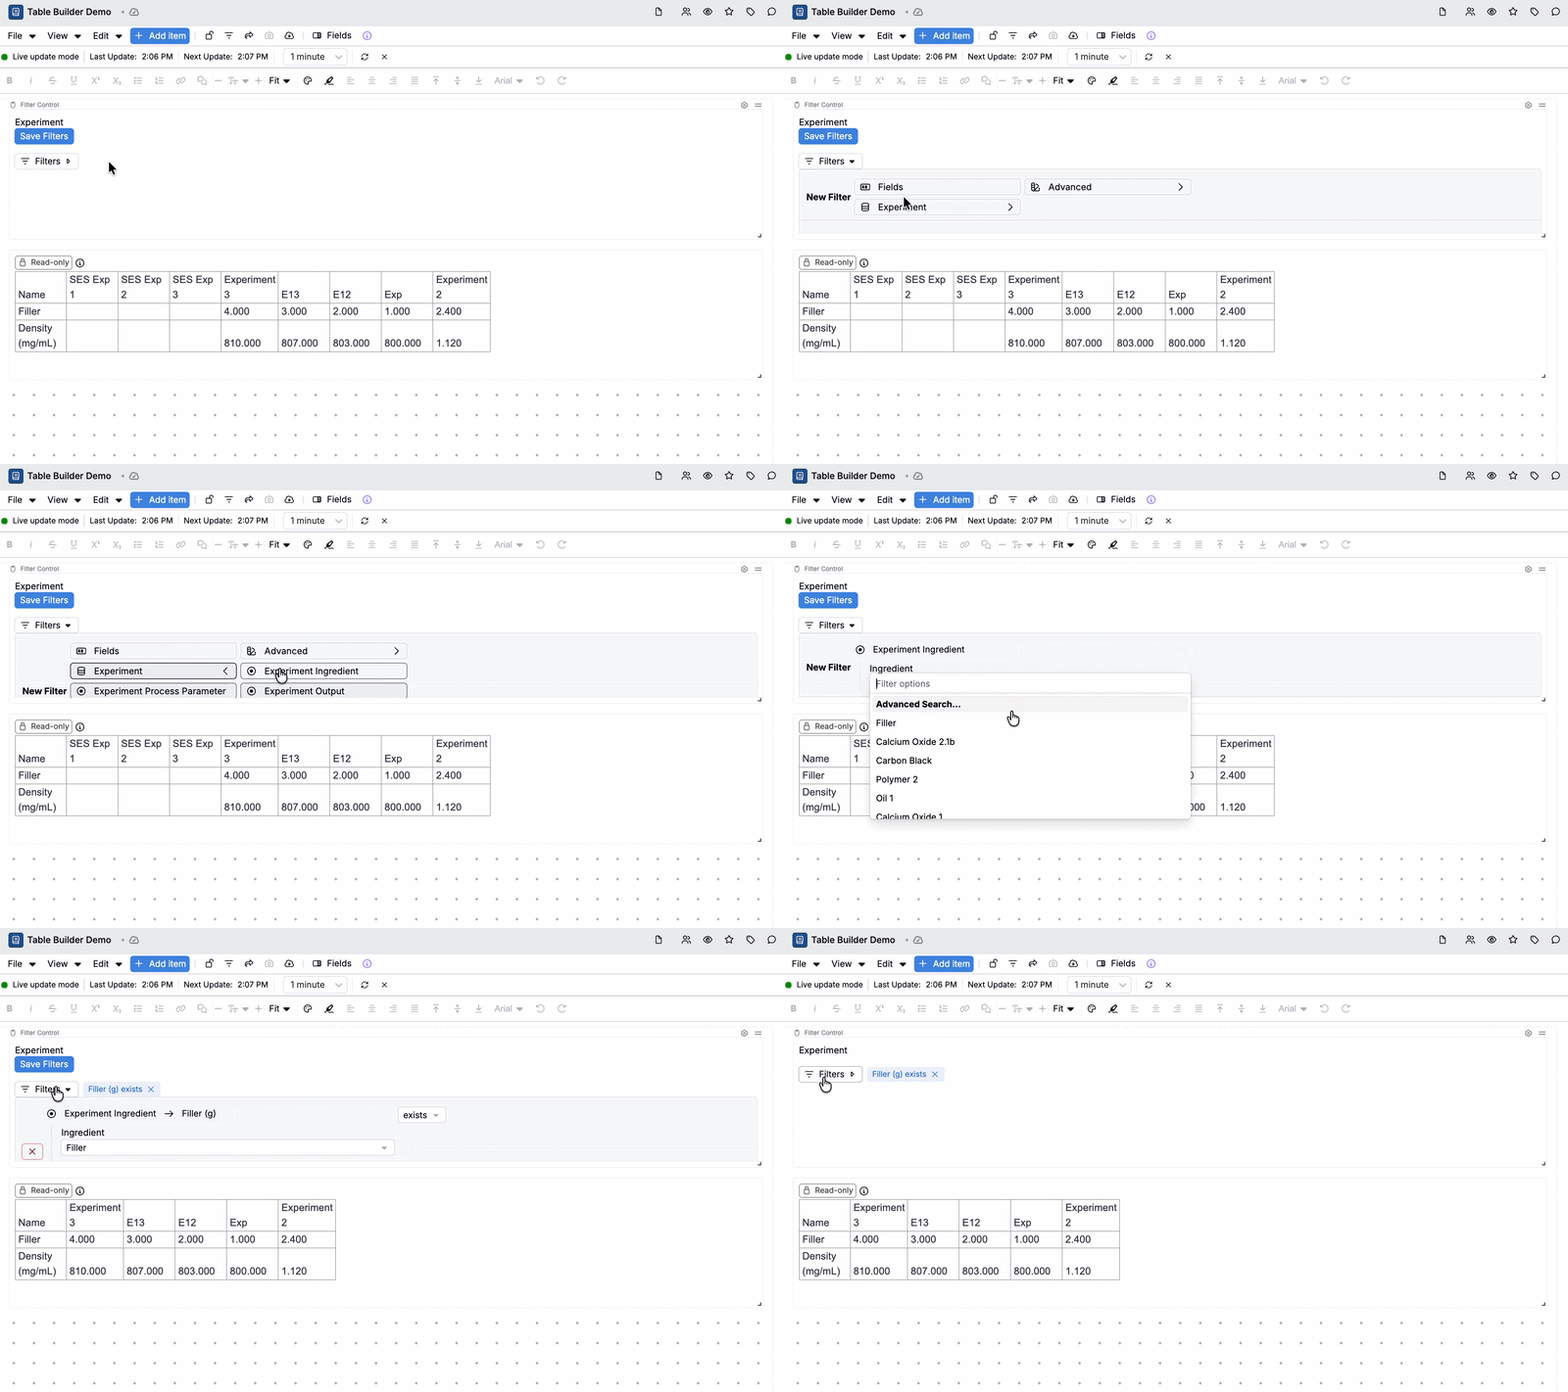
- In a Filter Control cell, apply a filter to narrow the data — for example, filter to a specific experiment, or to experiments that contain a particular ingredient or measured output.
- Any Table Builder–backed cells in the notebook will automatically recompute and refresh to reflect that filter.
Notes:
- Filters only apply when Live update mode is enabled.
- In live update mode, cells are read-only to avoid conflicts between editing and refresh.
- This only applies to table builder–backed cells (plain table cells without a Table Builder config cannot be live-updated).
Curve Solver: Aggregate Curves + Curve Objectives
Curve Solver now supports enhanced curve-based optimization workflows with a new calculation type: Aggregate Curve. Aggregate curves combine curves from a selected source into a single curve (typically a weighted average), reducing manual curve prep work.
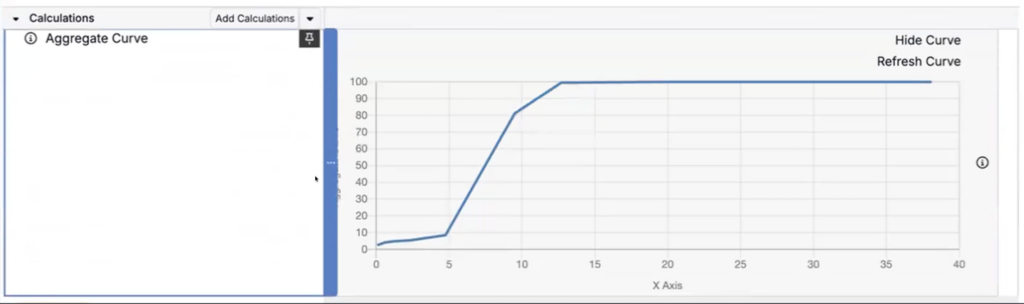
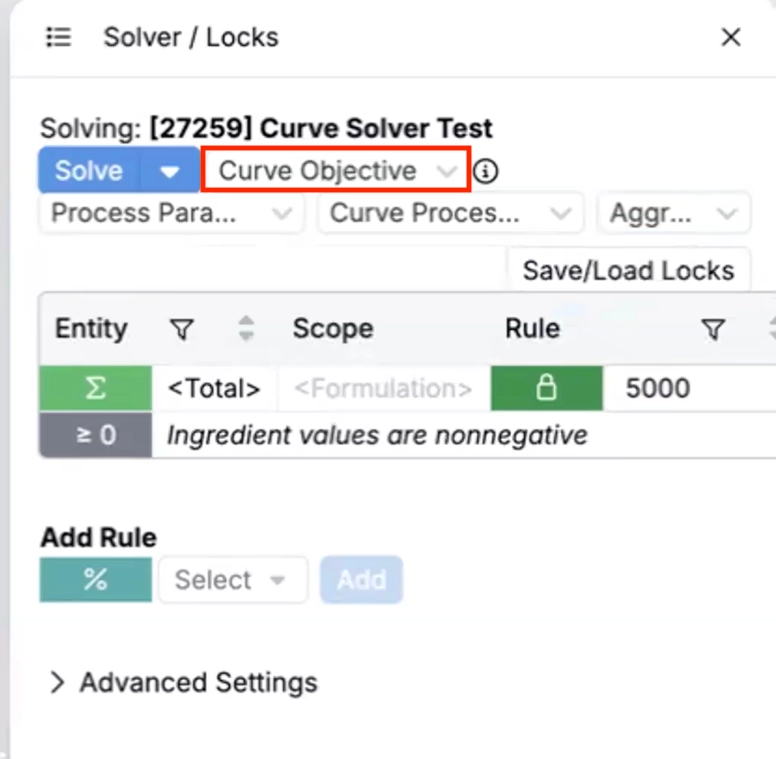
You can then use the aggregated curve as a Curve Objective in Solver.
This reduces manual curve prep work and makes it easier to solve toward a target curve while still respecting constraints customers care about (like locks and other solver constraints).
How to configure:
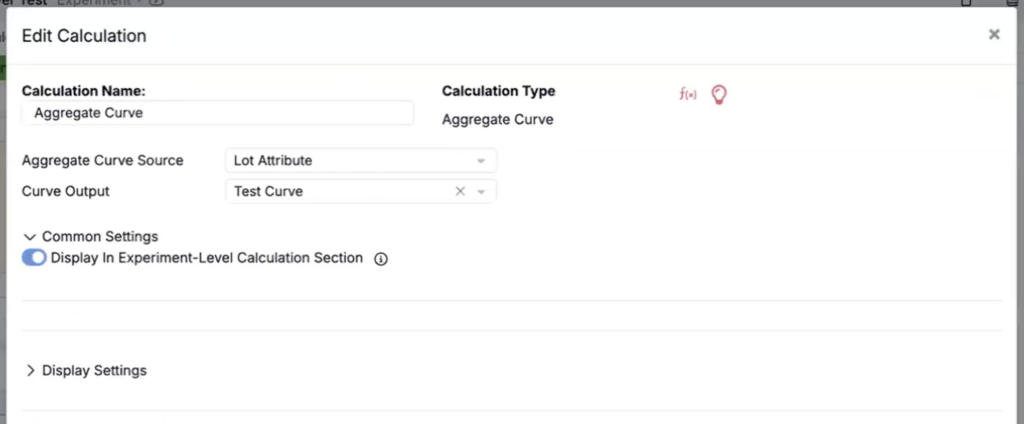
- Create an Aggregate Curve calculation.
- Set Calculation Type to Aggregate Curve.
- Set Aggregate Curve Source to Lot Attribute.
- Select a Curve Output.
- In the Solver sidepanel, set a Curve Objective to target the aggregated curve, then run the solve.
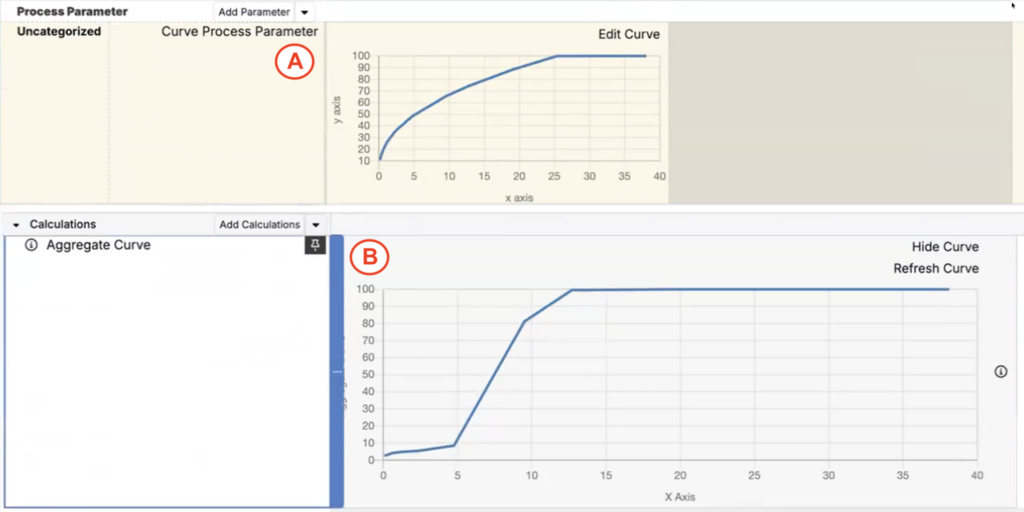
The solve will adjust recipe ingredient values so the resulting curve (A) matches the target curve (B) as closely as possible.
Output Calculations: Show Relevant Outputs
A new output calculations feature, Show Relevant Outputs, has recently been introduced to make output calculations in experiments easier to validate.
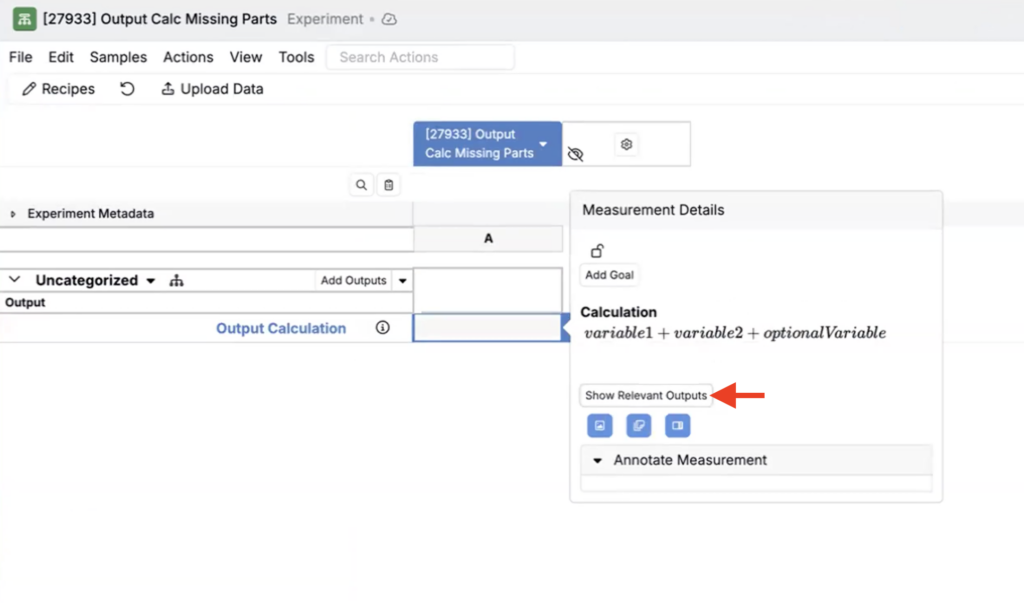
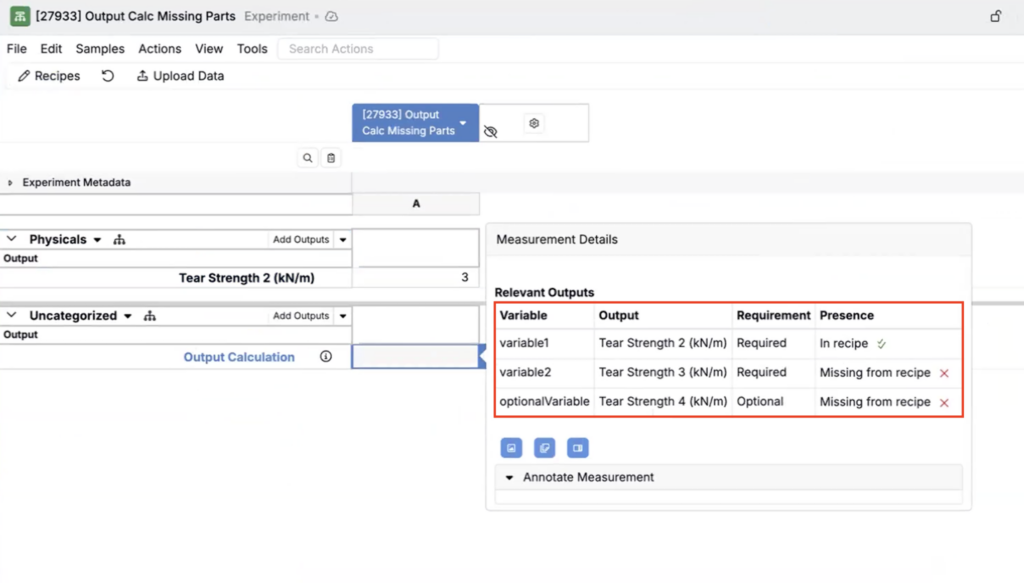
Previously, clicking an output calculation only showed the calculation equation’s variables. Now, in the output calculation modal, you can click Show Relevant Outputs to see the underlying outputs used as variables — including the variable name, output, requirement, and whether it’s present in the recipe.
This makes it easier to spot missing outputs you still need to add to your experiment, helping teams formulate faster.
How to use:
- Click an Output Calculation to open the calculation’s popover.
- Click Show Relevant Outputs.
- Review what’s missing, add any required outputs to your experiment, then re-run as needed.
Add Aggregated Listings to Entity Details Pages
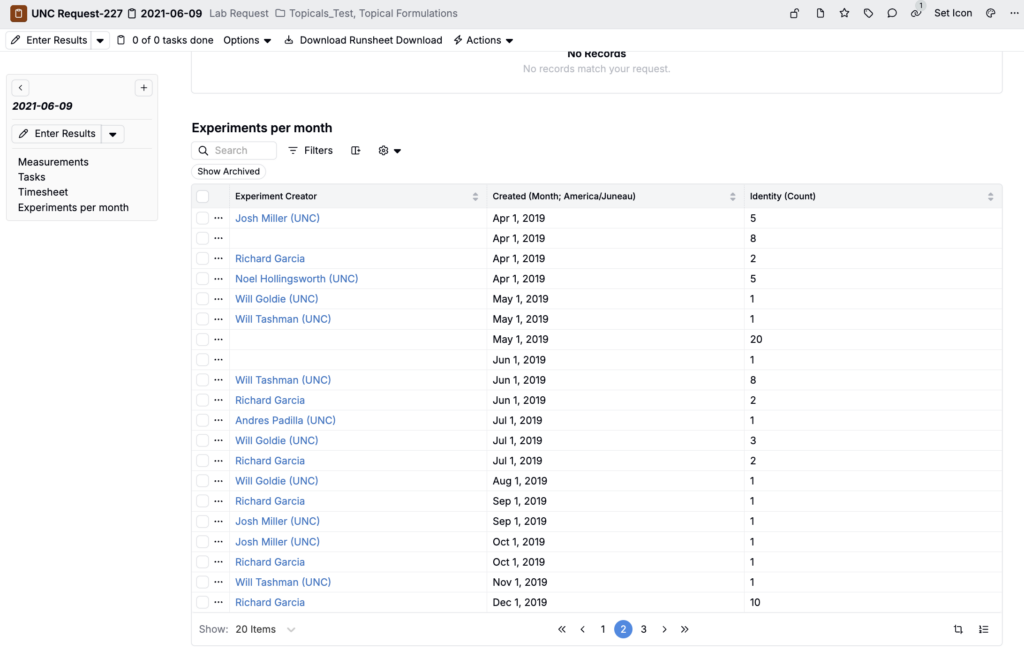
You can now add custom aggregated listings directly onto any details page, so teams can embed grouped data (totals, rollups, aggregations) right where they do their work instead of requiring people to click out to a separate listing.
How to configure:
- Within the Listing Configs tab of the Form Admin page, create a new listing config.
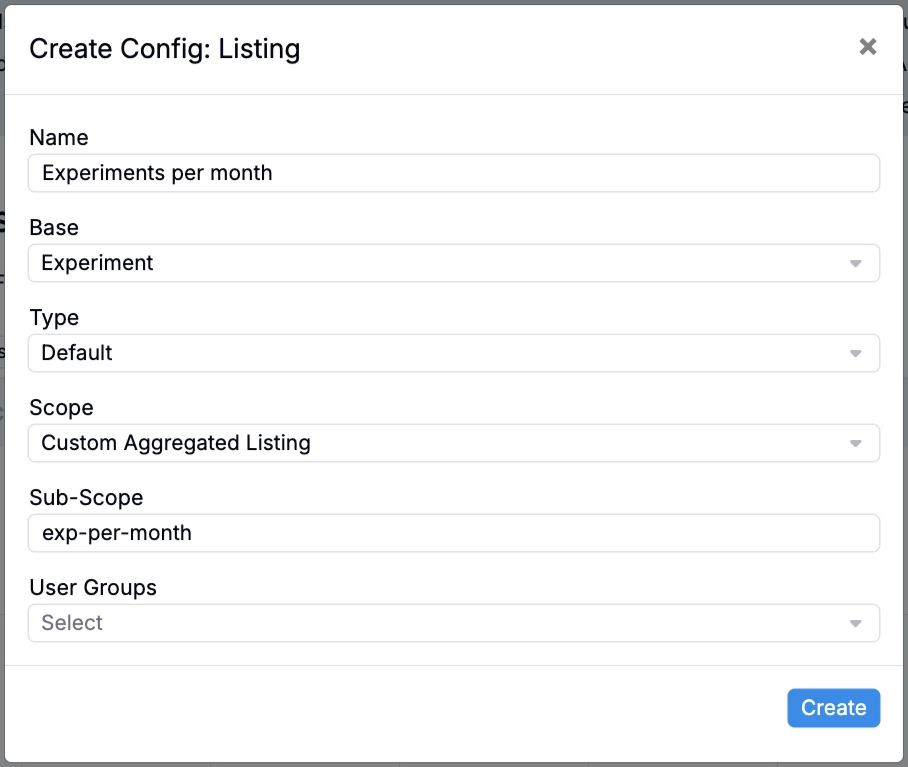
- In the Create Config modal:
- Add a name
- Select a base (e.g. Experiment)
- Set Type to Default
- Set Scope to Custom Aggregated Listing
- Add a custom sub-scope (e.g. “exp-per-month”)
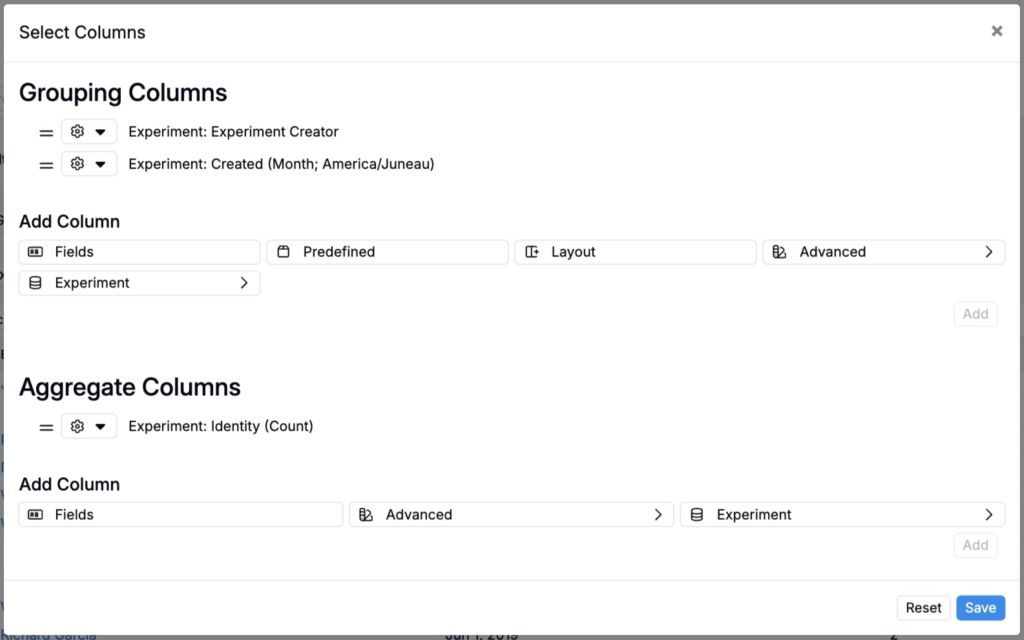
- Once created, click ⚙️ > Select Columns and add your aggregate and grouping columns. You can also add filters, if needed. To learn more, refer to Aggregated Listings.
- Within the Definitions tab of the Form Admin page, open the definition you want to add your aggregated listing to (e.g. a lab request definition).
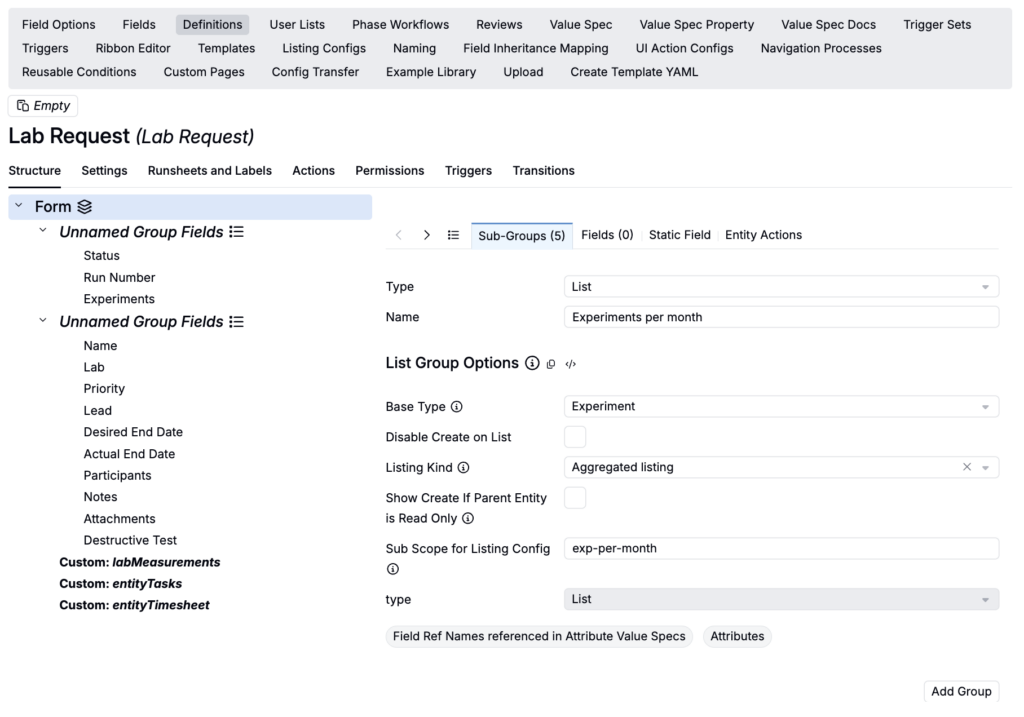
- Select Form > Sub-Groups and add a new sub-group:
- Set Type to List
- Add a name (e.g. Experiments per month)
- Use the Base Type field to select the same base entity type for your custom listing config (e.g. Experiment)
- Set Listing Kind to Aggregated Listing
- Use the Sub Scope for Listing Config field to input the sub-scope created for your custom listing config (e.g. “exp-per-month”)
- Once added, any new or existing entities created using that definition will contain your aggregated listing group.
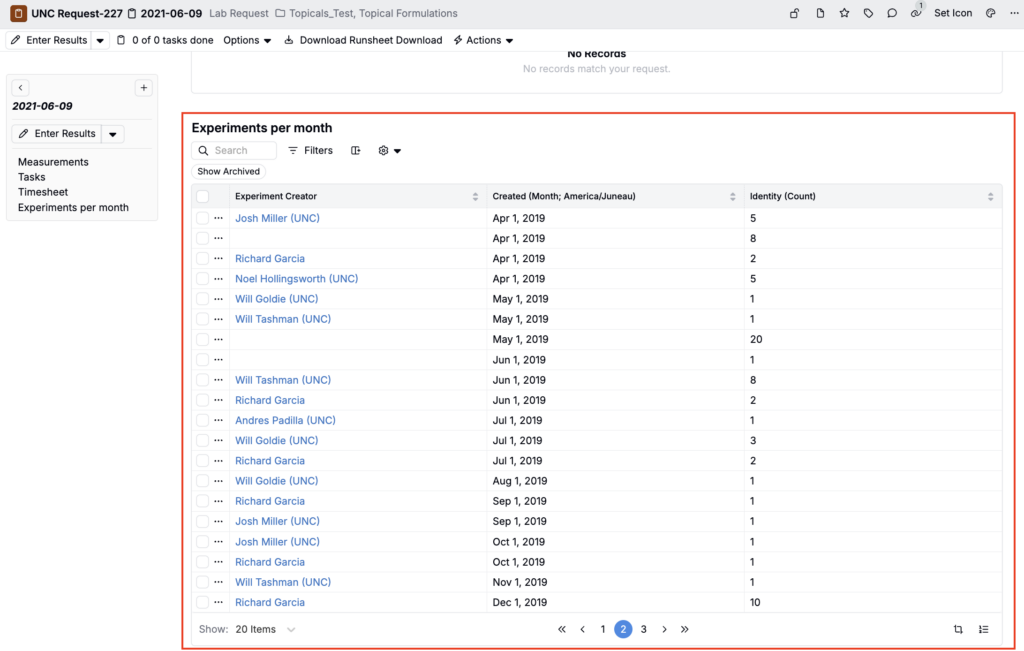
Table Cell Formatting by Output
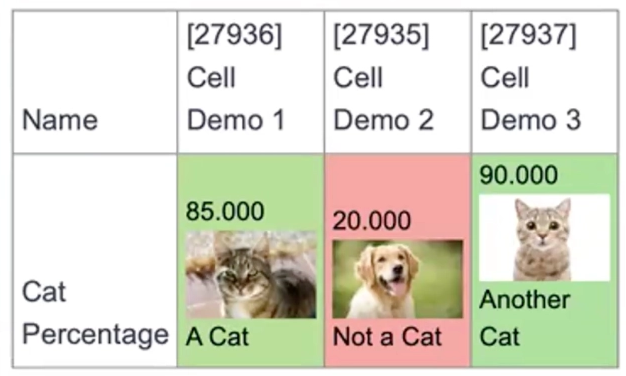
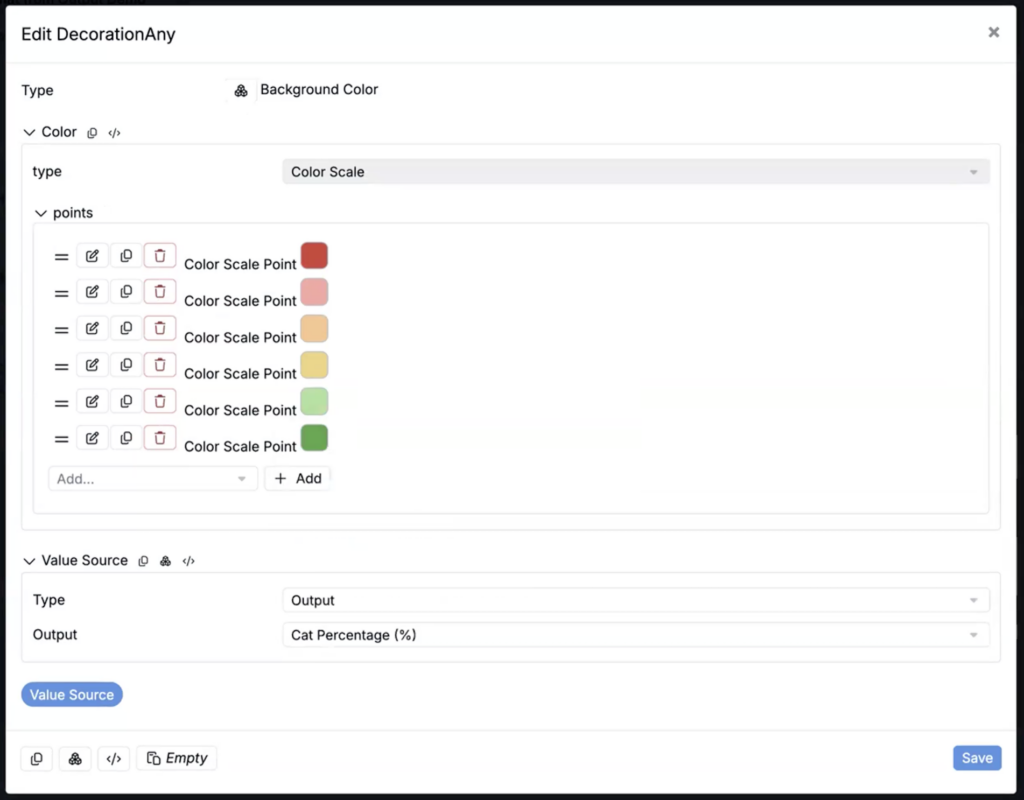
Using Table Builder, you can now base table cell formatting on select output values. Using the new Output value source for cell decorations, users can select the output to format by and define color scale points. Cells are colored based on the points you set, with a gradient applied between them.
This is useful especially useful for Combined rows, where each cell’s background color is driven by a specific output but the table’s visible outputs are frequently re-ordered or replaced. By selecting the output controlling cell color directly, the formatting continues to work even if that output appears in a different position or isn’t shown.
How to configure:
- On your notebook table, open the Table Builder Config.
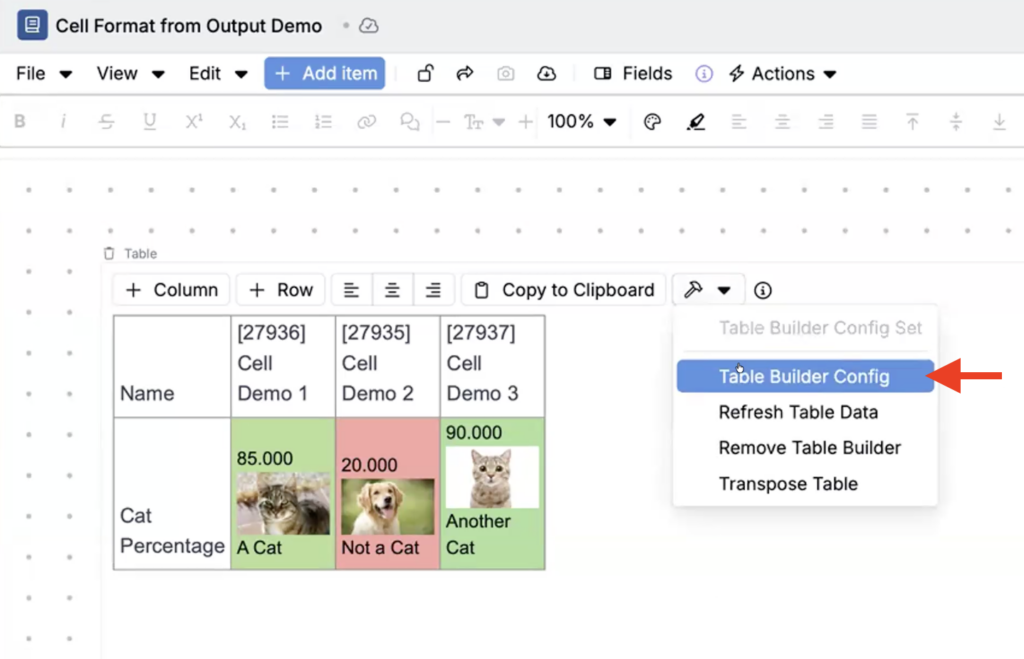
- Edit the column or row you want to add formatting for.
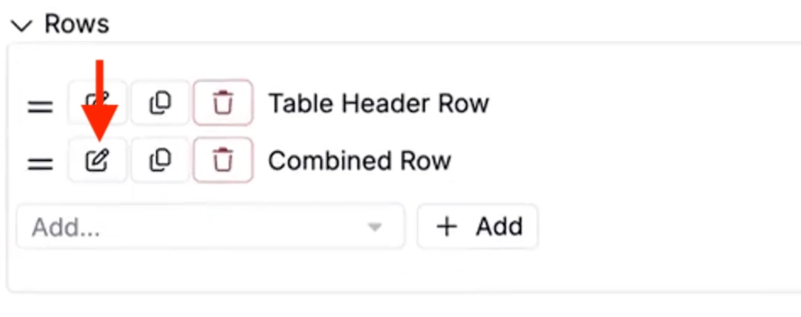
- Under Formatting, add Cell Formatting.
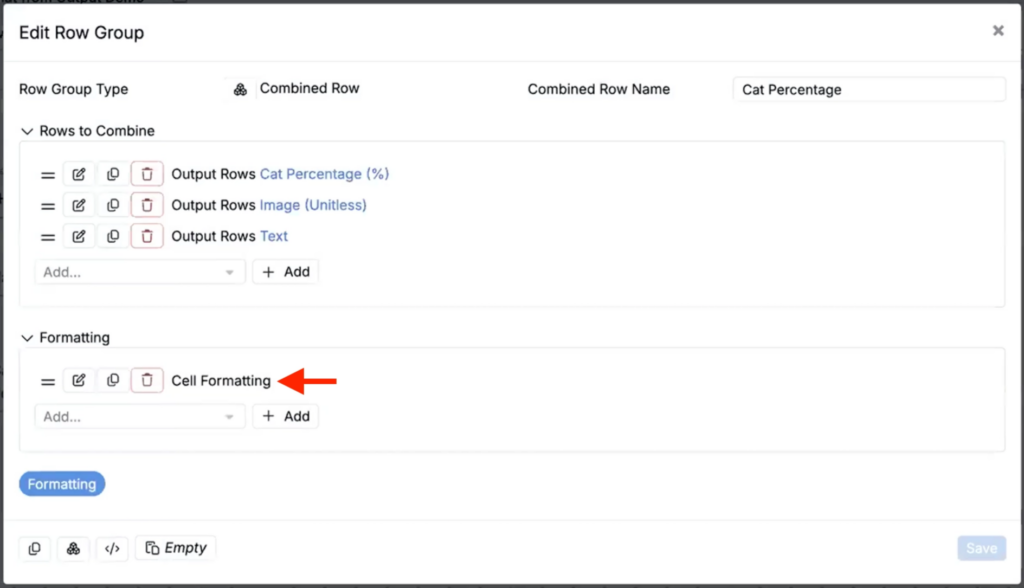
- In the Edit Formatting modal, add a Background Color decoration.
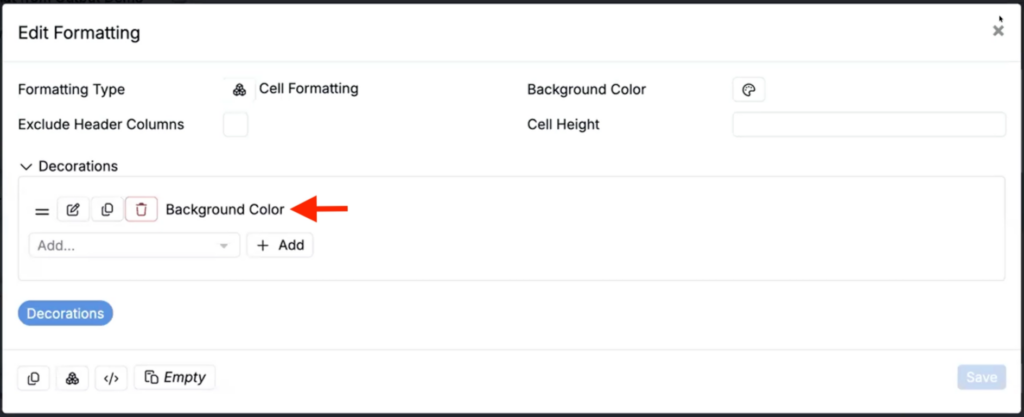
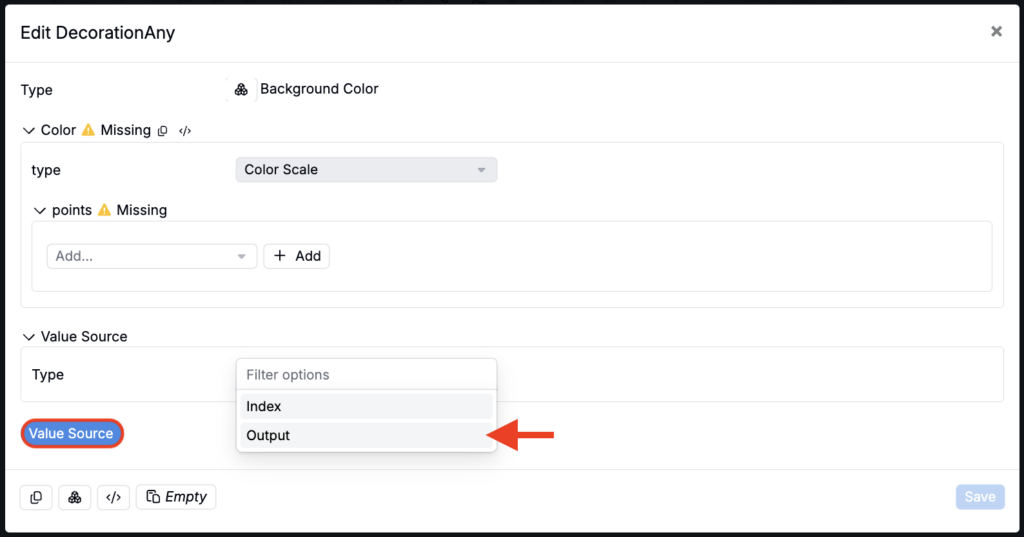
- In the Edit Decoration modal, add an Output type value source and select the output you want to format/color by.
- Under Points, add Color Scale Points by selecting a color and setting the value for that point. Values between points will display as a gradient between the selected colors.
- Click Save to apply your changes.
Experiment Fields: Copy Across Row
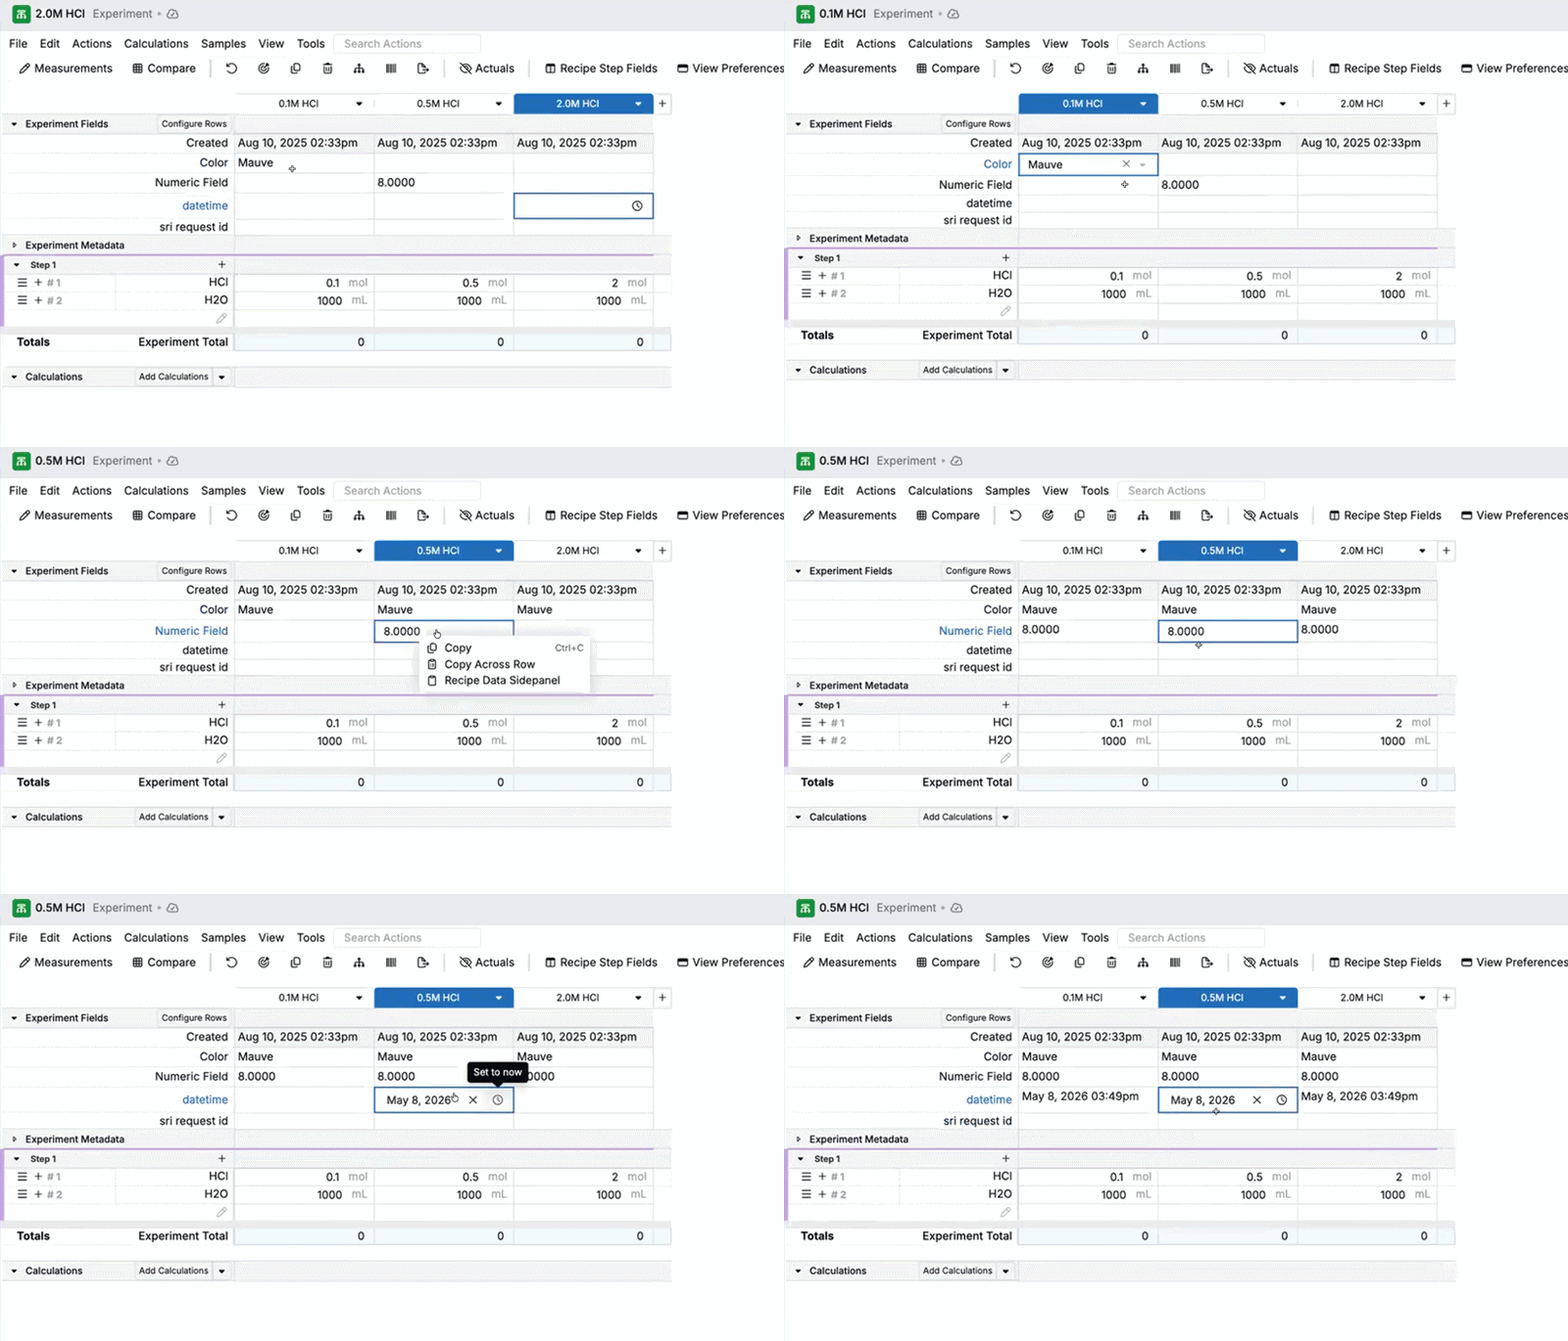
You can now use the Copy across row shortcut in the Experiment Fields section to copy an experiment field value across all experiments currently in view. Previously, Copy across row only worked in the main data grid on the Recipe and Measurements views.
This is especially useful for teams running experiments in batches, where the same context (e.g., notes or request info) needs to be applied across multiple experiments. It also helps reduce manual edits and keeps experiment fields consistent.
How to use:
- In the Experiment Fields section, right-click the cell you want to copy.
- Select Copy across row.
Access Multiple Schemas (Workspaces) from a Single URL
You can now access multiple schemas (workspaces) from a single Uncountable URL—so teams can move between environments like production, sandbox, dev, test, or customer schemas without juggling separate URLs or accounts.
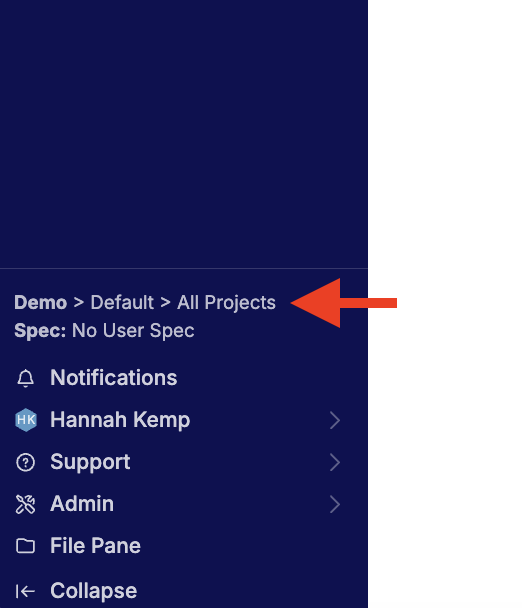
Users who have been granted access to more than one schema will see them all under the same login, and can switch workspaces directly in-app via the bottom-left breadcrumbs menu (the same place you switch Material Families and Projects).
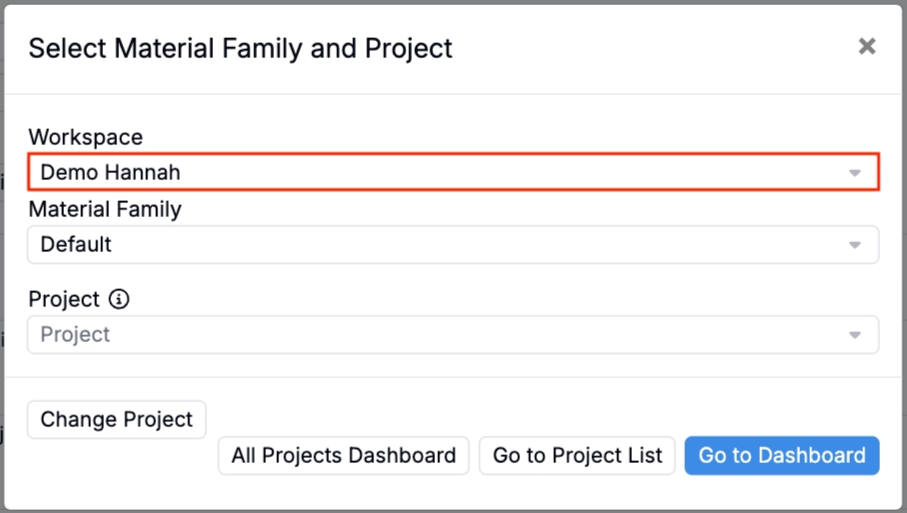
This is available now, and admins can continue managing schema access the same way they do today. To learn more, refer to Access Multiple Schemas (Workspaces) from a Single URL.
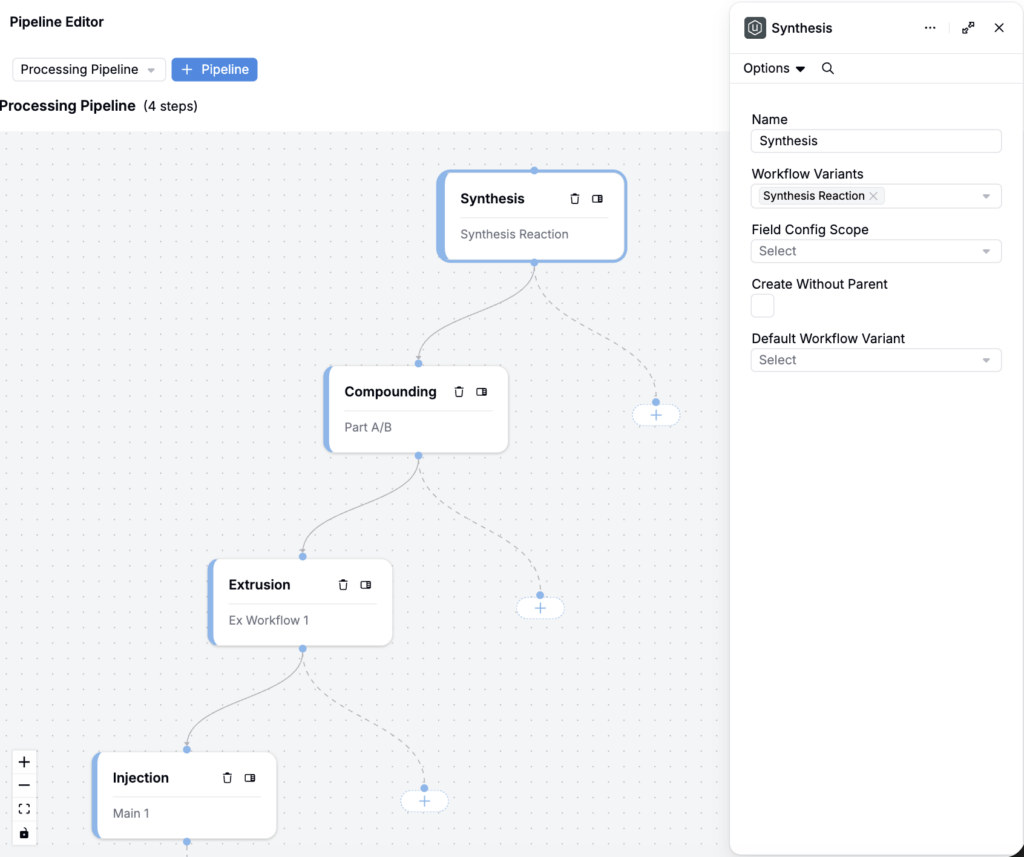
Pipelines: Create Experiments Across Workflow Steps
We’ve introduced Pipelines, a new workflow structure that helps teams create and manage experiments across multi-step workflows (e.g. synthesis → compounding → extrusion → injection) with a more visual interface.
Pipelines provide an alternative to using product relationships to model parent/child experiment chains. It makes the workflow steps explicit, so it’s easier to follow the process and continue creating downstream experiments as you go.
Using pipelines, teams can:
- Create an experiment “pipeline” by adding steps (nodes) and selecting allowed workflow variants during experiment creation.
- Associate steps with experiments and continue creating downstream experiments while preserving upstream context.
- Automatically include parent experiments as ingredients in child experiments.
To learn more, refer to Pipelines.