
Aggregated listings let you summarize platform data across any entity type, similar to a pivot table. Use them to answer questions like:
- How many experiments were created per month this year?
- How many issue reports are in each status over time?
- How many ingredients do we have per category?
- What is the total inventory quantity per raw material across lots?
When to Use
Use aggregated listings whenever you need counts or numeric summaries across many rows, rather than looking at one row per item.
Most commonly, aggregated listings are used to create charts in notebooks and dashboards for time trends and distributions. However, you can also create a one-off aggregated listing from the Calculate menu without saving it to a notebook.
Core Concepts
When creating an aggregated listing, you first select a base entity that determines what you’re aggregating across, such as Experiments, Ingredients, Lab Requests, Outputs, Inventory Items, and more.
Aggregated listings are then defined by two kinds of columns:
- Grouping columns — define the categories or buckets you want to group by. A good rule of thumb is if you’d describe the result as “per X,” X belongs in grouping columns.
- Examples: Created Month, Created By User, Status, Category.
- Aggregate columns — define what to summarize. The default is a count of items, but you can also choose sum, mean, min, max, and other supported operations for numeric fields.
How to Create an Aggregated Listing
Listings/Charts in Notebooks
- Access the builder.
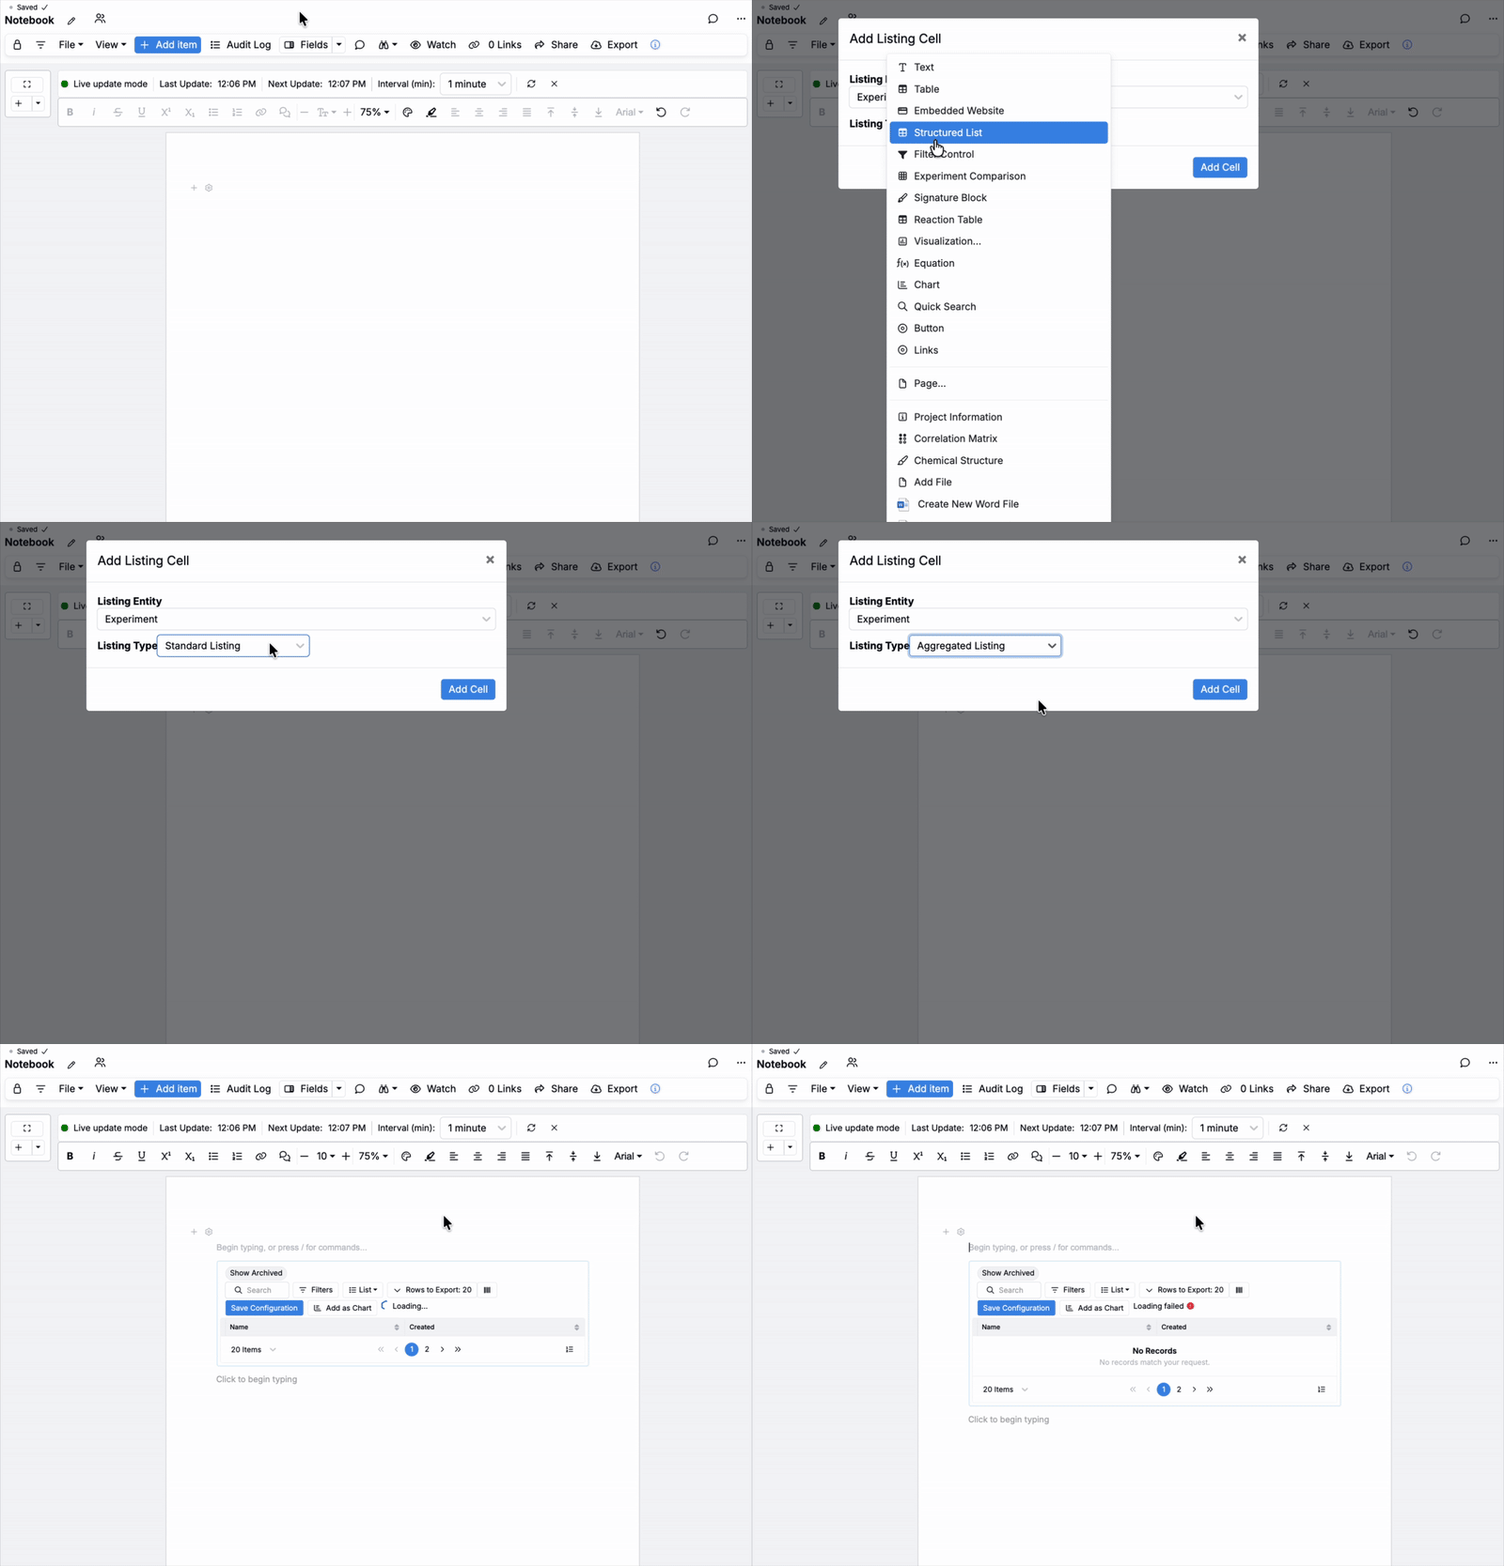
- In a notebook, choose Add item > Structured List > Aggregated Listing.
- In the modal, set Listing Entity to your base entity you want to aggregate across (e.g. Experiments, Ingredients, Requests) and set Listing Type to Aggregated Listing.
- Set columns to be displayed.
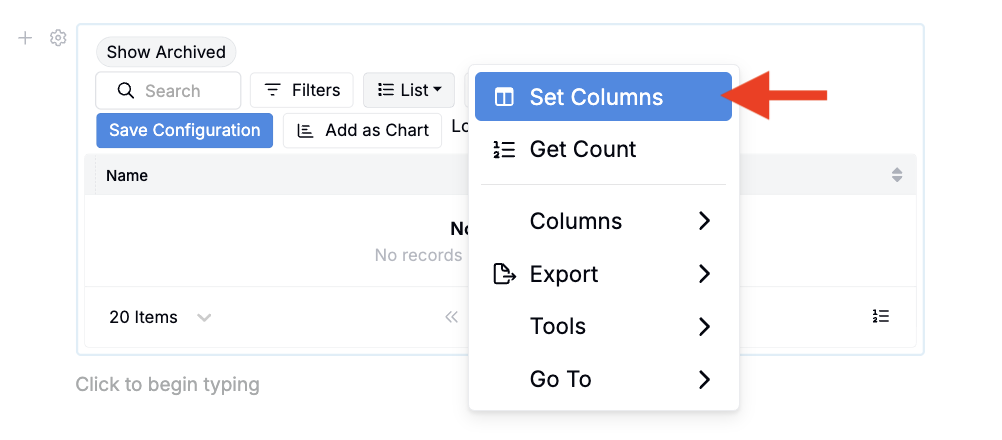
- From the new listing cell, click List > Set Columns.
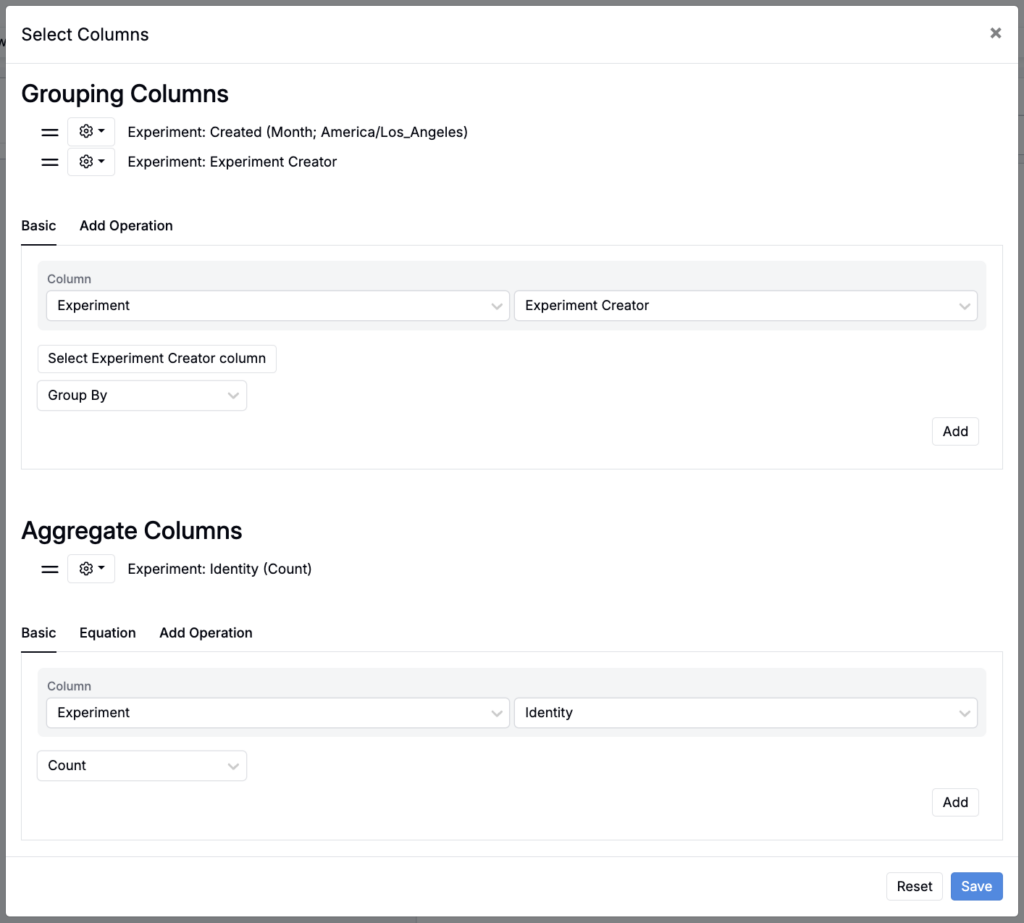
- In the modal, make the following selections:
- Grouping Columns: Add one or more fields to group by (e.g. Created Date, Created By, Status, Category, Definition).
- Aggregate Columns: Choose what to compute. The default “Identity” gives a simple row count. For numeric fields, you can also select sum, mean, min, max, etc.
- Reorder or rename columns, then Save.
- Refine as needed.
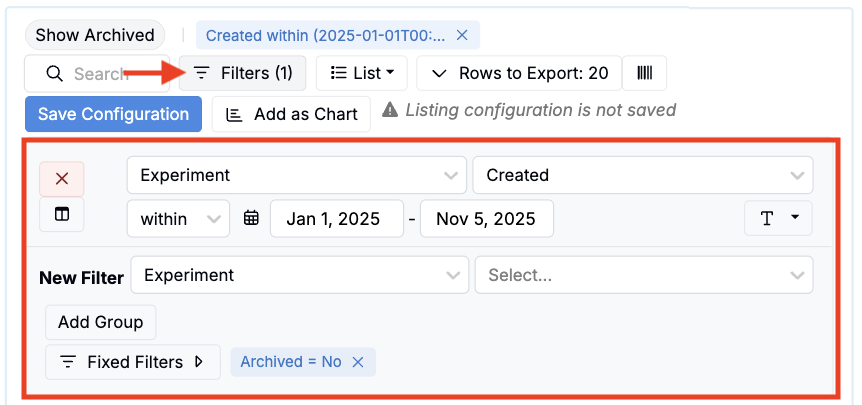
- Click Filter to add scope the data. For example, filter to a specific date range or to select users.
- Create a chart (optional).
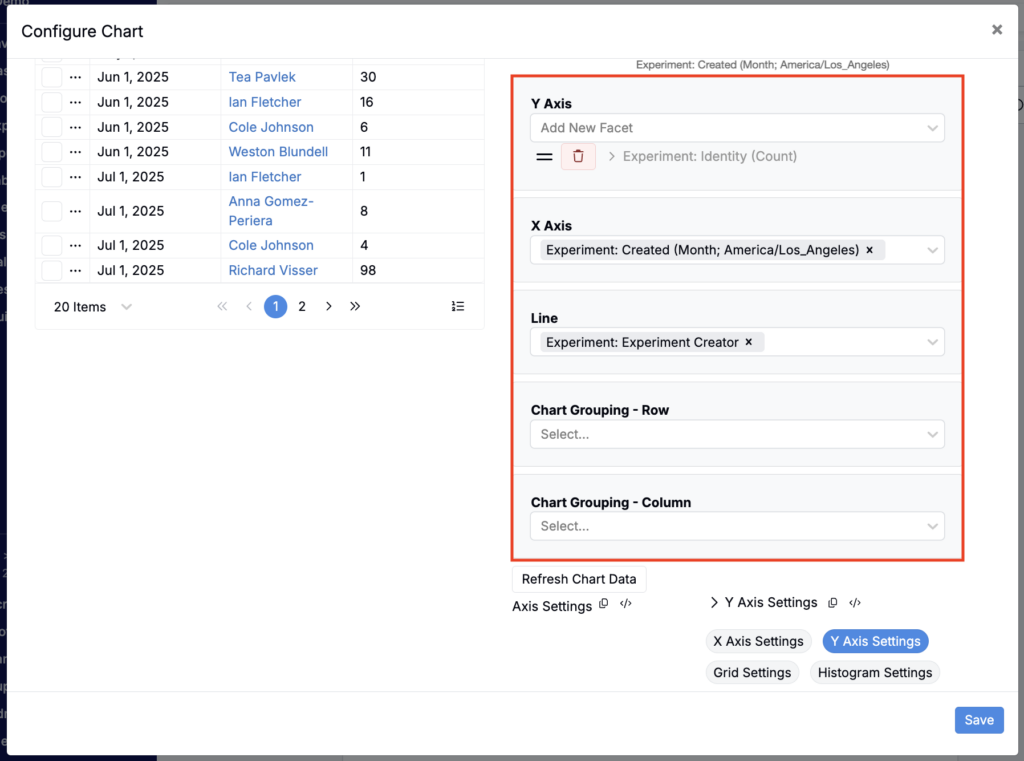
- Click Add as Chart to convert the aggregated listing to a chart to show the same results as bars or lines.

- In the modal, assign fields to axes (or click Automatically Assign), configure settings, and save.
- Save configuration.
- Once your listing or chart is complete, click Save Configuration.

One-off Aggregated Listings
- Access the builder.
- In the navigation bar, click Calculate > Aggregated Listings.
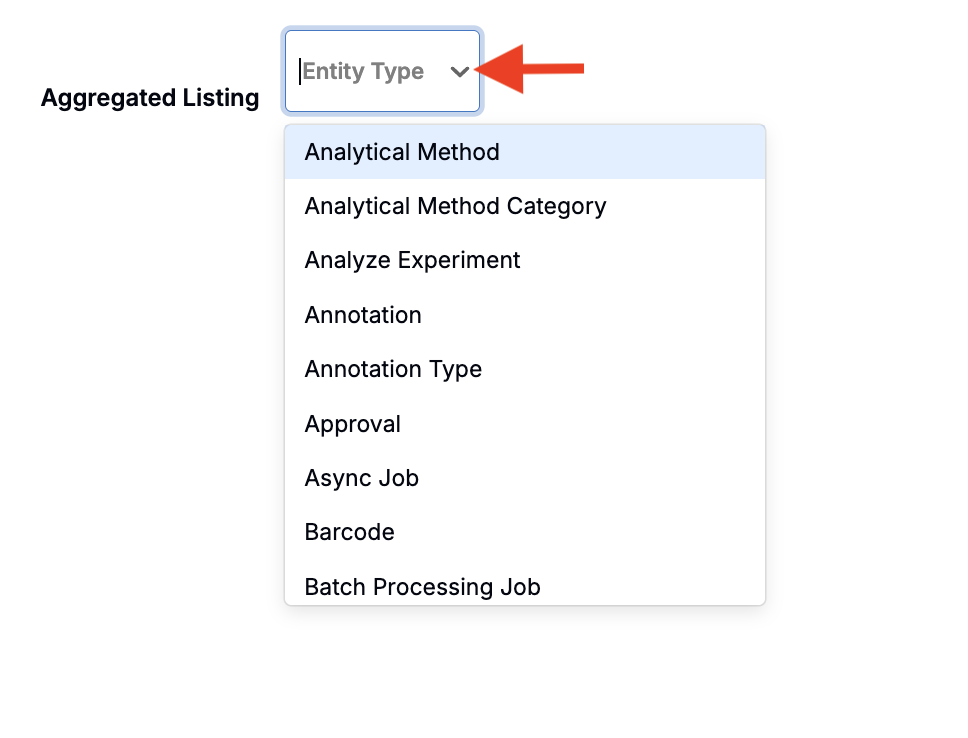
- Set Entity to your base entity you want to aggregate across (e.g. Experiments, Ingredients, Requests).
- Set columns.
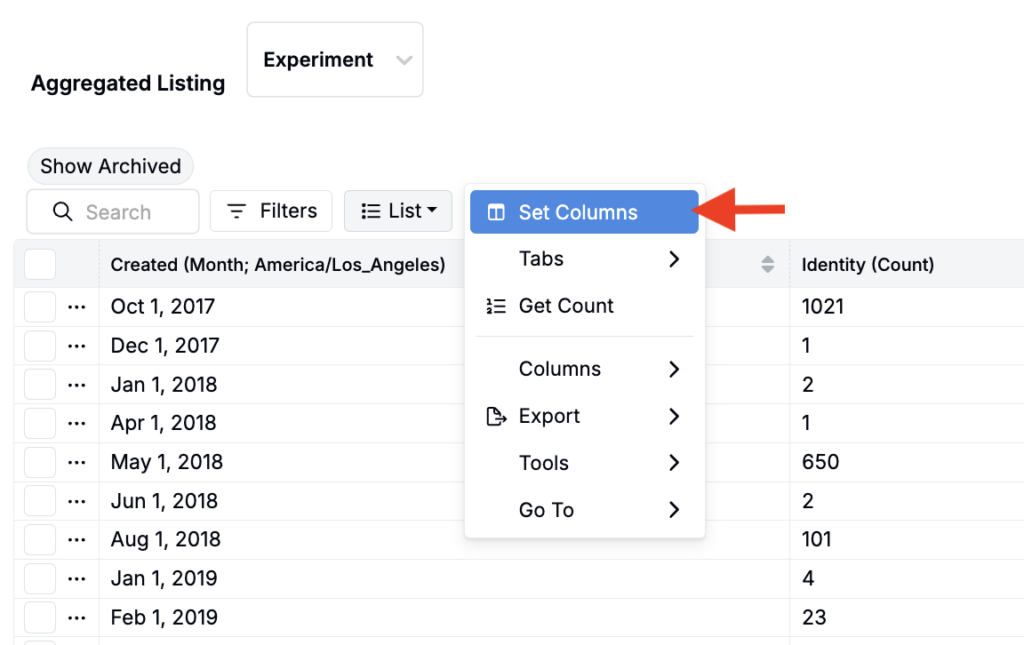
- On the listing, click List > Set Columns.
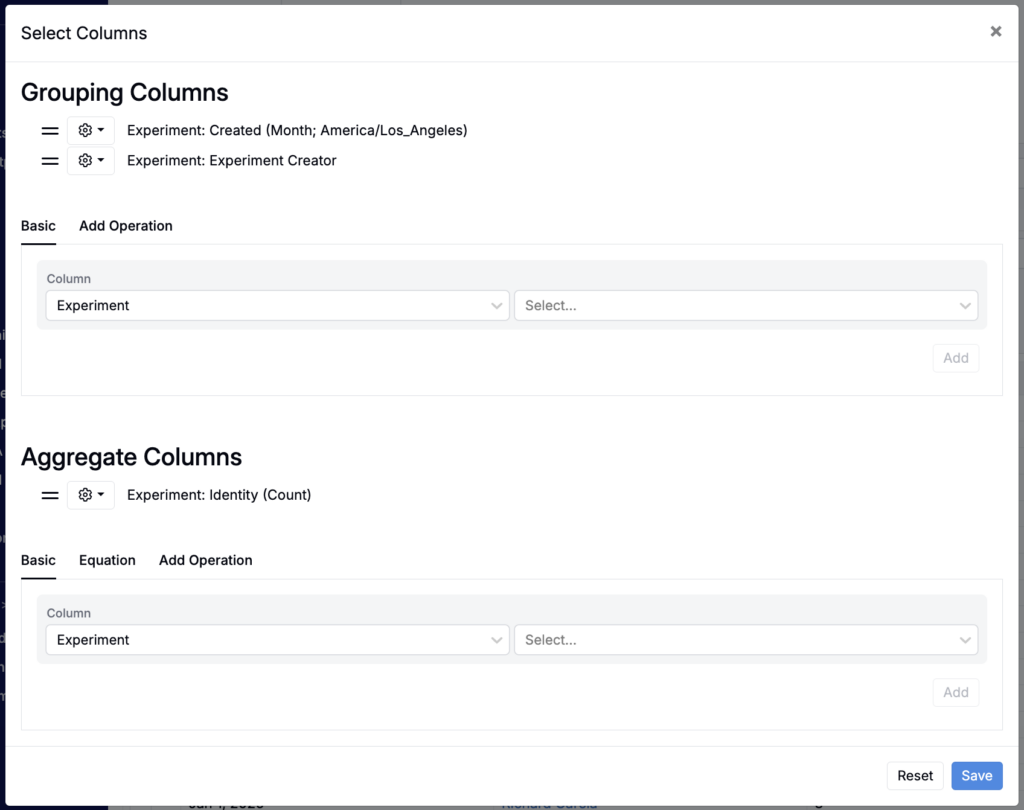
- In the modal, configure the following:
- Grouping Columns: Add one or more fields to group by (e.g. Created Date, Created By, Status, Category, Definition).
- Aggregate Columns: Choose what to compute. The default “Identity” gives a simple row count. For numeric fields, you can also select sum, mean, min, max, etc.
- Reorder and rename columns if needed, then Save.
- Refine as needed.
- Click Filter to add scope the data. For example, filter to a specific date range or to select users.
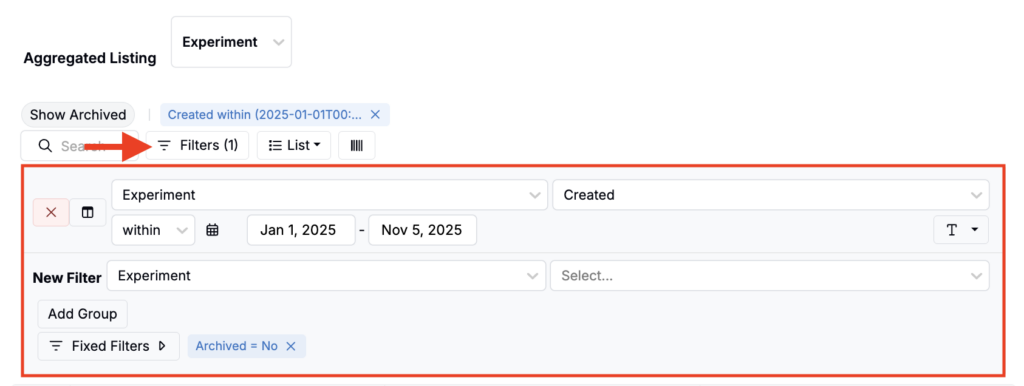
- Import into a notebook (optional).
- To import your aggregated listing into a notebook, click List > Export > Save to Notebook.
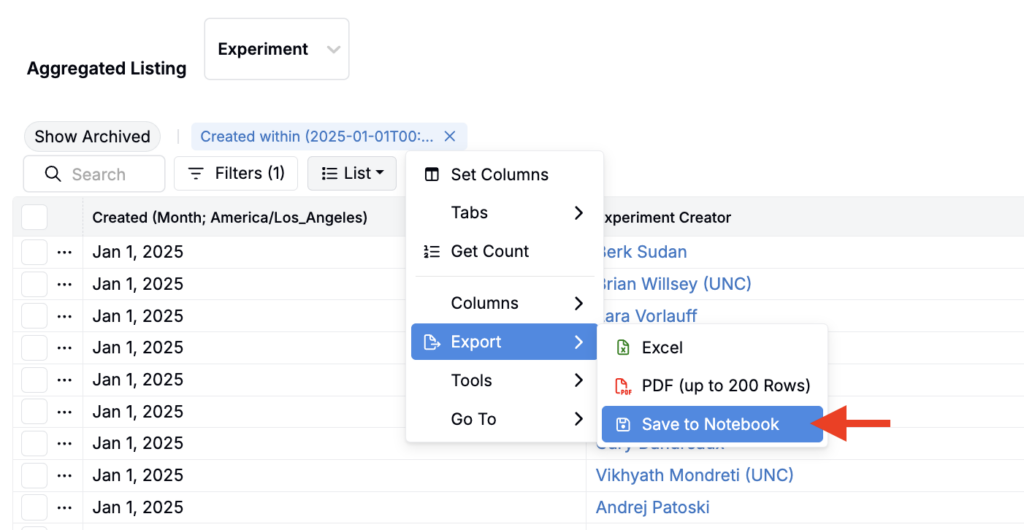
Aggregated Listings on Entity Details Pages
You can also add custom aggregated listings directly onto any details page, so teams can embed grouped data (totals, rollups, aggregations) right where they do their work instead of requiring people to click out to a separate listing.
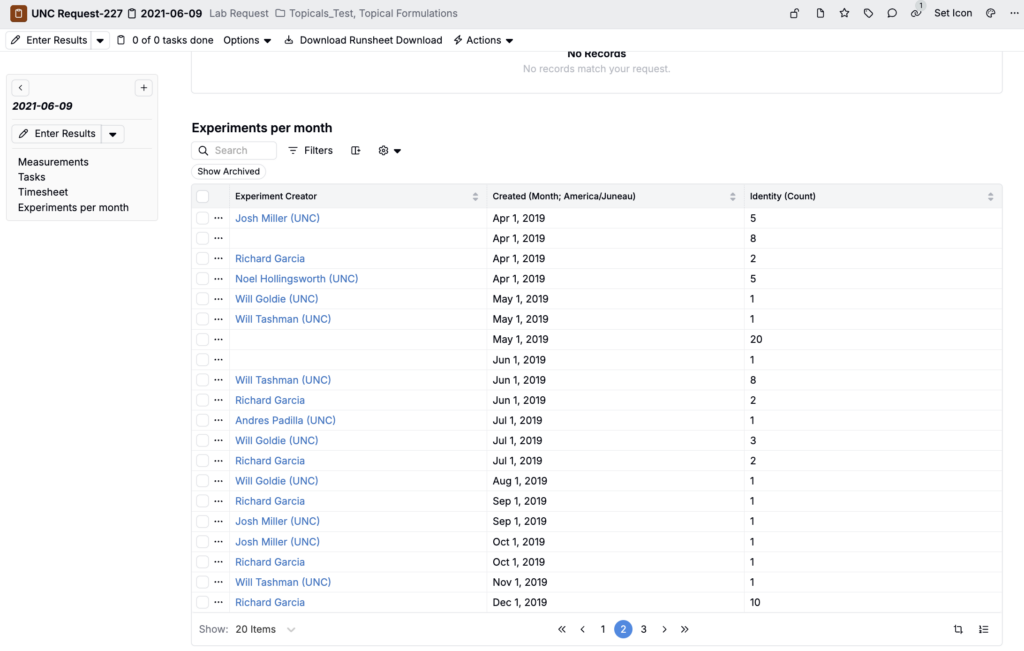
How to configure:
- Within the Listing Configs tab of the Form Admin page, create a new listing config.
- In the Create Config modal:
- Add a name
- Select a base (e.g. Experiment)
- Set Type to Default
- Set Scope to Custom Aggregated Listing
- Add a custom sub-scope (e.g. “exp-per-month”)
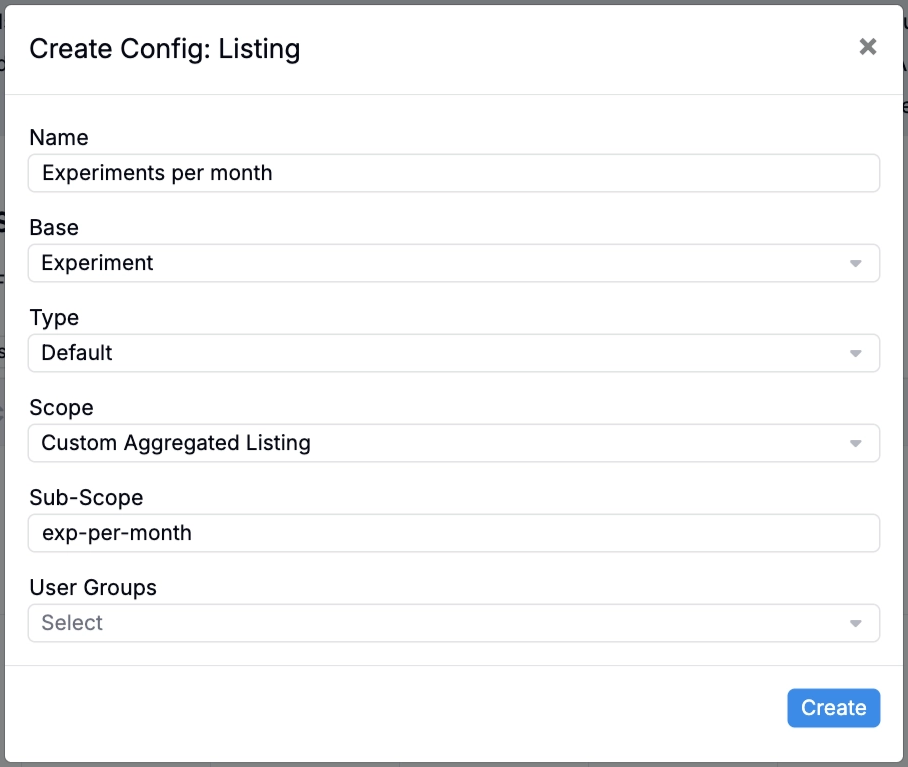
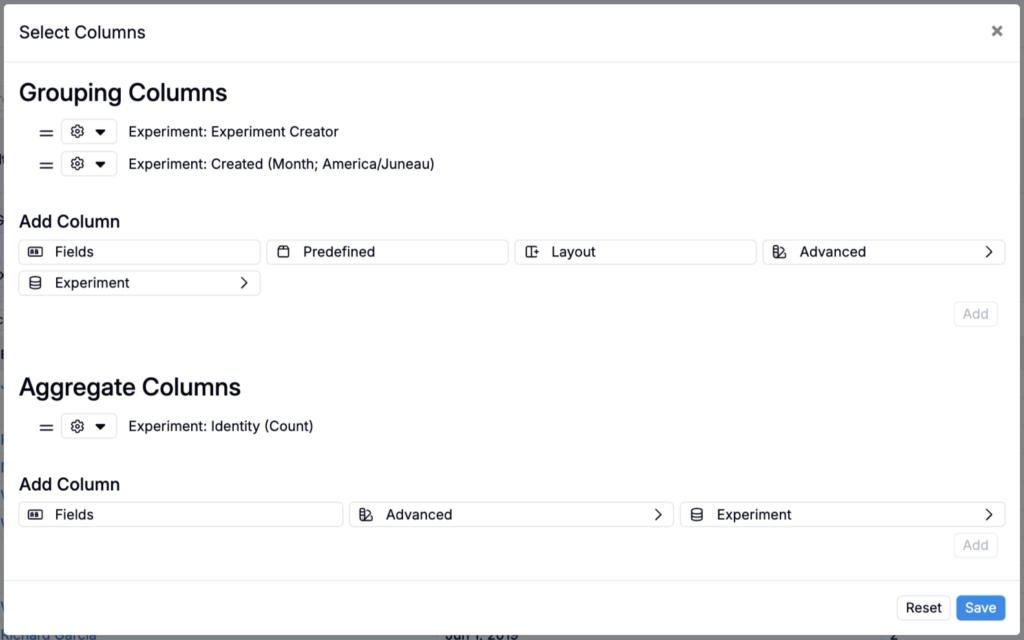
- Once created, click ⚙️ > Select Columns and add your aggregate and grouping columns. You can also add filters, if needed. To learn more, refer to Aggregated Listings.
- Within the Definitions tab of the Form Admin page, open the definition you want to add your aggregated listing to (e.g. a lab request definition).
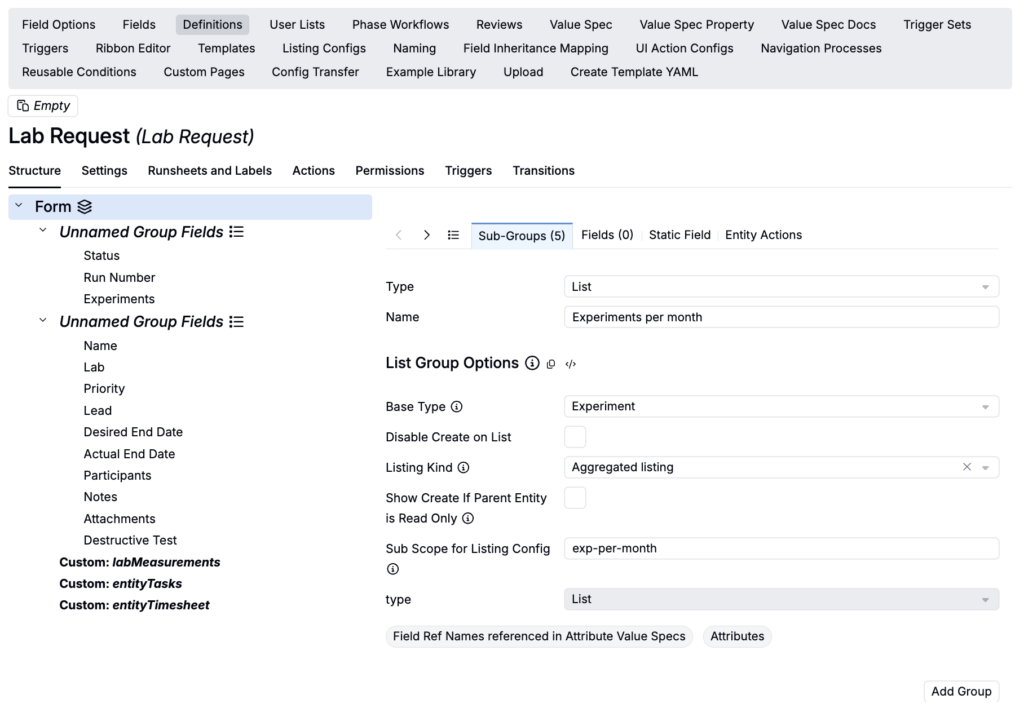
- Select Form > Sub-Groups and add a new sub-group:
- Set Type to List
- Add a name (e.g. Experiments per month)
- Use the Base Type field to select the same base entity type for your custom listing config (e.g. Experiment)
- Set Listing Kind to Aggregated Listing
- Use the Sub Scope for Listing Config field to input the sub-scope created for your custom listing config (e.g. “exp-per-month”)
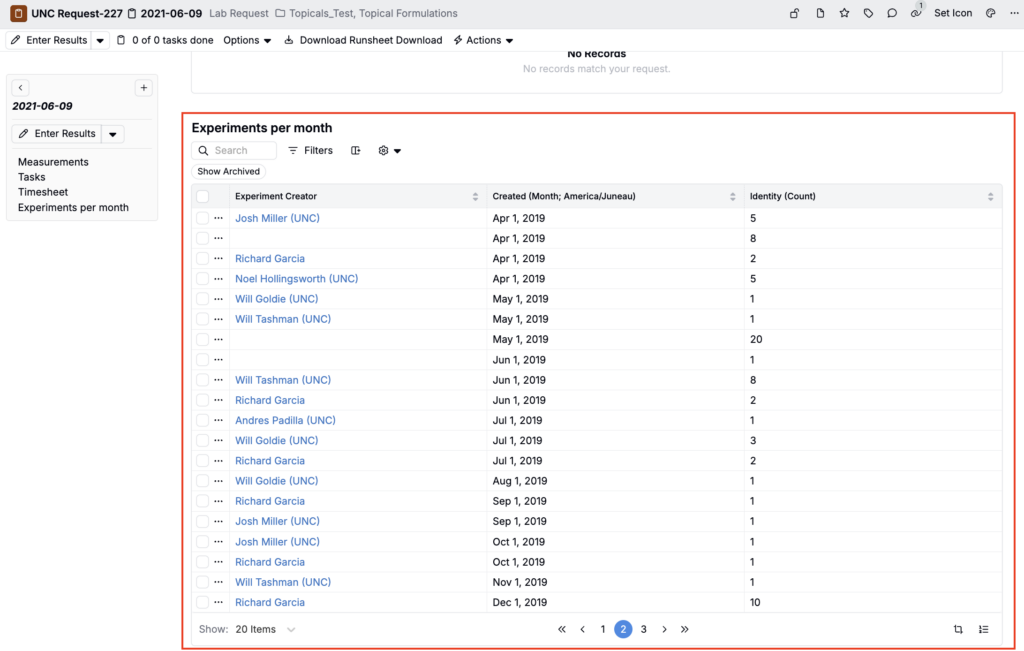
- Once added, any new or existing entities created using that definition will contain your aggregated listing group.
Additional Aggregate Options
Counting distinct time periods
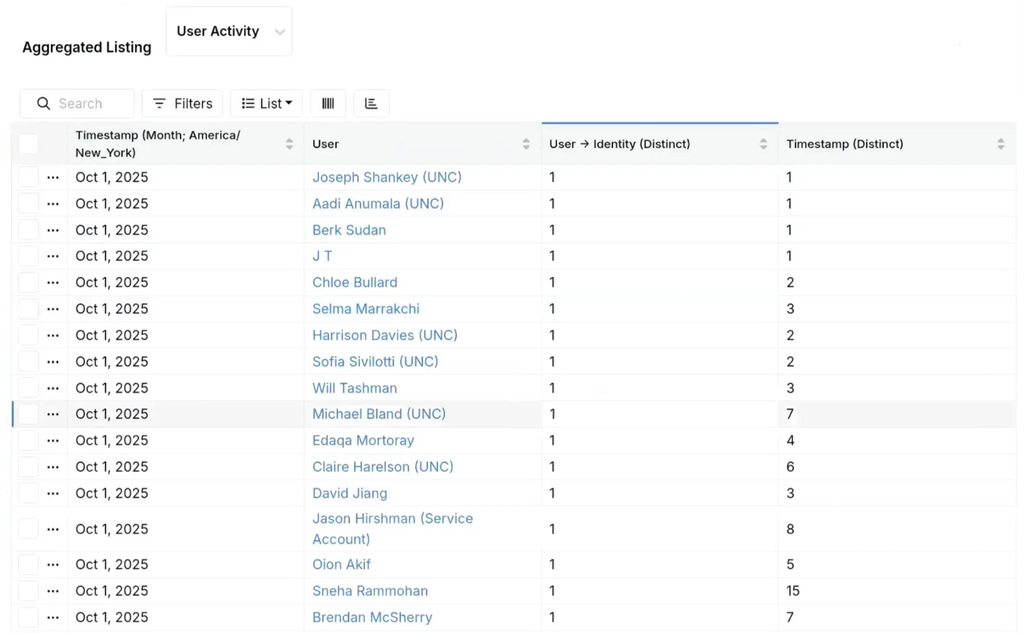
Aggregated listings can compute distinct counts over calendar periods for any datetime column. This is useful for KPIs such as “active days per user per month” or “unique months with submissions.”
- Open or create an aggregated listing that includes at least one datetime column.
- In the Select Columns modal (List > Set Columns), choose Count Distinct for the datetime aggregate column.
- Select a period granularity: Day, Week, Month, Quarter, or Year.
- Optionally, add grouping columns for user, project, equipment, or other dimensions to produce per-entity period counts.
- Click Save.
Filtering aggregate columns
Filters can be applied to individual aggregate columns, so each column summarizes only the rows that match its filter. This is useful for filtering on group-level metrics such as averages, counts, or outlier status.
- In the Select Columns modal (List > Set Columns), add an aggregate column.
- Click the Filters icon on the column and add a filter.
- Click Save.
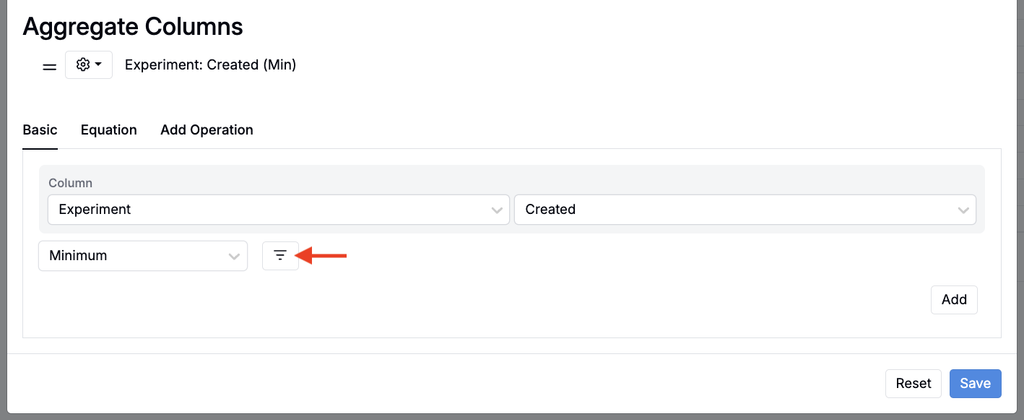
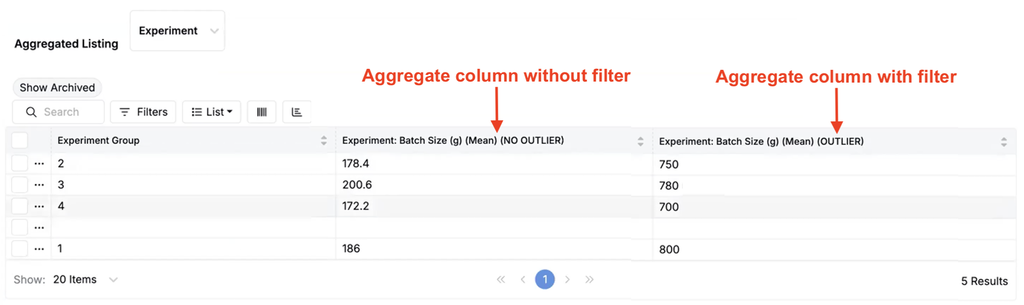
For example, to compare results with and without outliers, add a grouping column for the entity you want to summarize (e.g. Experiment Group), add two aggregate columns for the same metric (e.g. Batch Size), and add an Is Outlier = True filter to one of them.
Tips
- “Per” is your hint — any phrase like “per user,” “per month,” or “per status” signals a grouping column.
- Start simple — use a single grouping column plus a count to validate your setup, then add more groupings or switch aggregations.
- Date bucketing — switch between week and month to get the right signal‑to‑noise ratio in time series.