File Uploads: Definition Fields in the Upload Modal
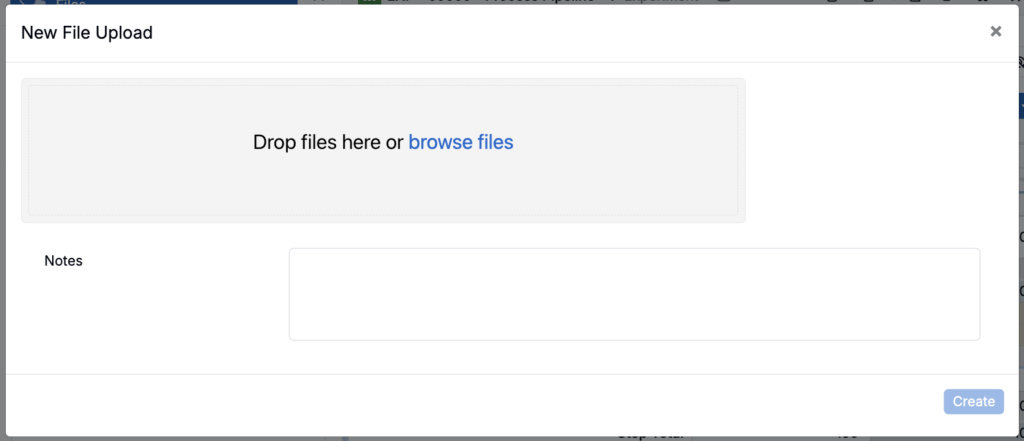
As part of a recent file folders redesign, the file upload modal now supports filling in definition-level fields when uploading a document.
These fields are added to the File Folder Membership definition by admins, and then appear in the upload modal for users to fill out. For example, a QA team uploading a certificate of analysis could be prompted to enter the batch number, expiration date, and reviewer name right in the upload modal, so the document is fully tagged and searchable without any follow-up editing.
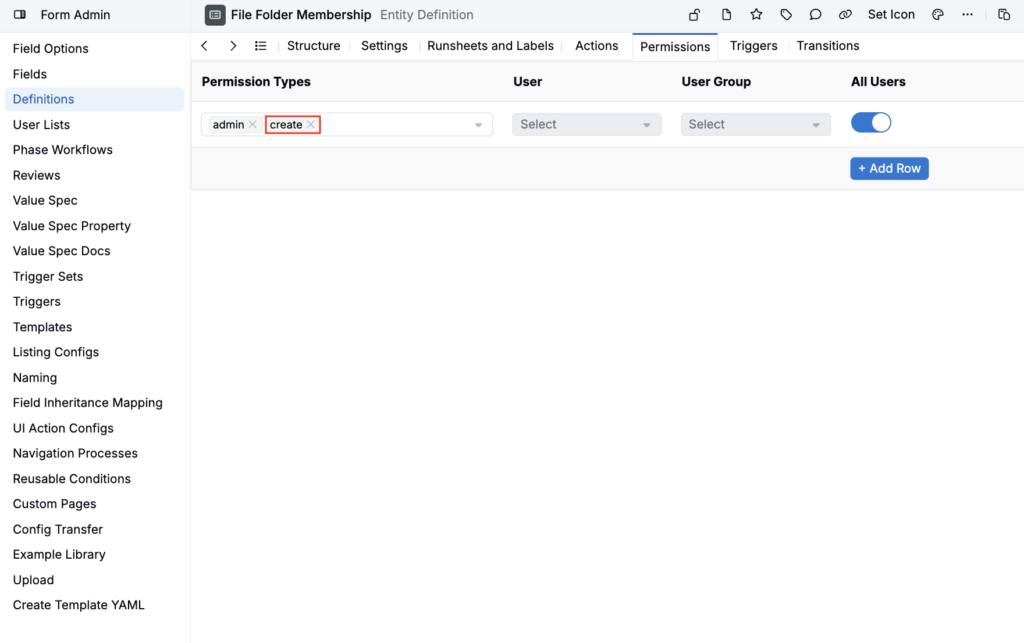
Users need create permission on File Folder Membership definition to use this flow. This matches the permission model for other create entity modals. Outside of that permission requirement, the existing upload flow has not changed.
To learn more about file folders, refer to The File Folder System.
Ingredient Lots: Workflow Variant Selection
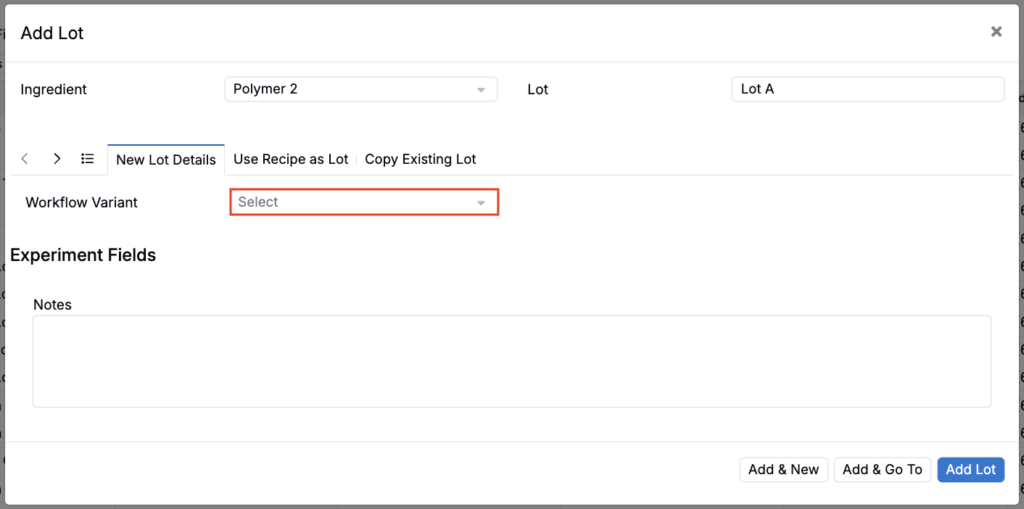
When creating a new ingredient lot, you can now choose which workflow variant it uses, so the lot’s recipe is created with the right steps and outputs from the start. This is useful for teams whose lots need to follow a specific workflow, rather than defaulting to a blank recipe or the first available workflow and requiring cleanup later.
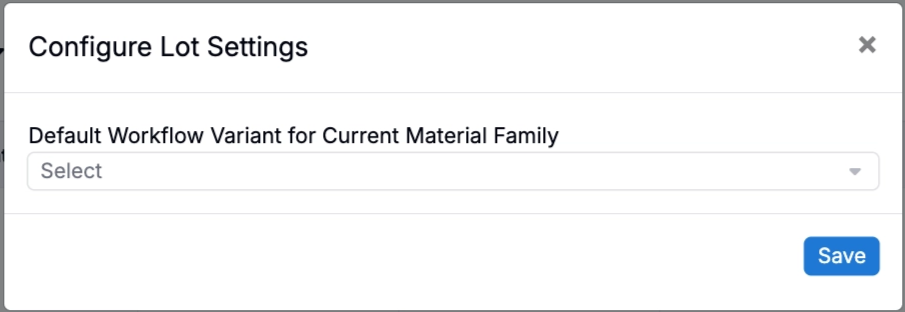
This can be set per lot in the Add Lot dialog, or as a default for the entire material family via the Configure Lot Settings button on the Lot listing page. If both are set, the per-lot choice takes precedence.
Add Line Modal: Custom Linear Equations
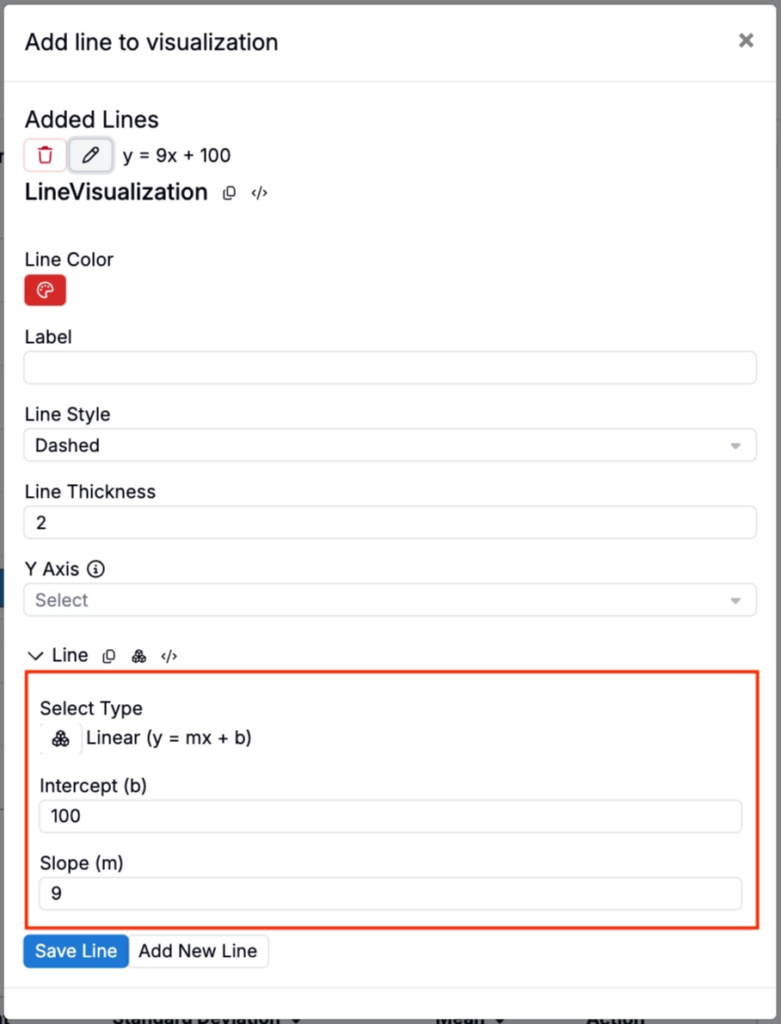
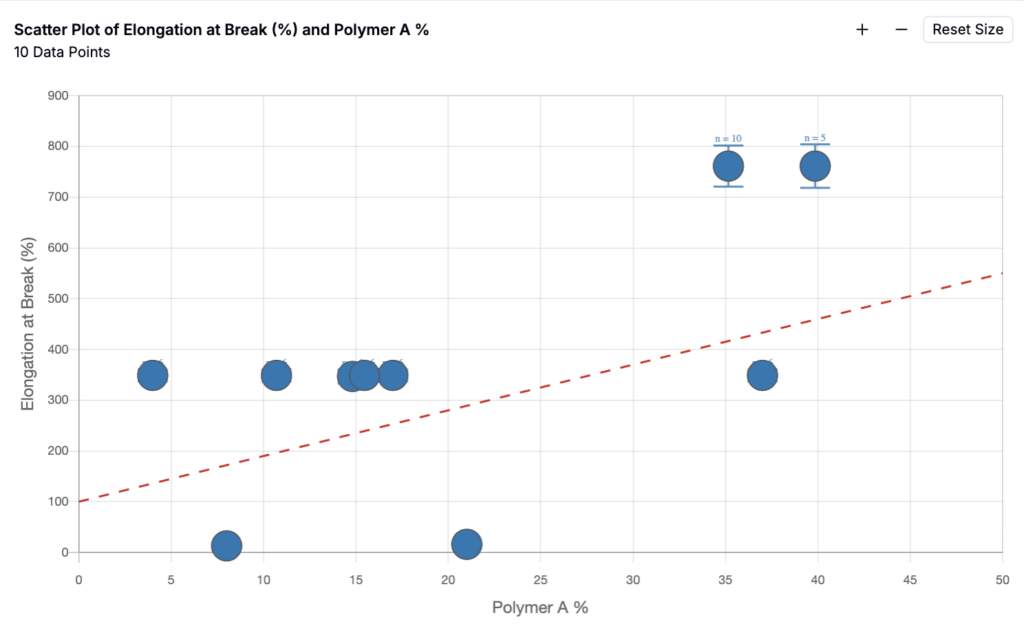
The Add Line modal for Explore Data visualizations has been updated, giving you more flexibility when adding reference lines to a chart. You can now choose a preset line or define a custom overlay line in the form y = mx + b, entering your own slope (m) and intercept (b) values.
This is especially helpful for customers comparing experimental results against expected linear relationships, such as calibration curves, target performance thresholds, or process models. Teams can quickly see whether data is tracking above, below, or in line with an expected trend without exporting the chart or manually adding reference data. This is especially useful for overlaying calibration curves, target specifications, or theoretical models directly on top of experimental data, without needing to plot them in an external tool first.
To access the modal, click the Add Line button on the Explore Data page.
AI-Assisted DOE: Workflow Setup Improvements
We’ve made several updates to the Optimize Formulations workflow for AI-Assisted DOE, making it easier to set up training data, performance targets, and design constraints directly within the guided flow.
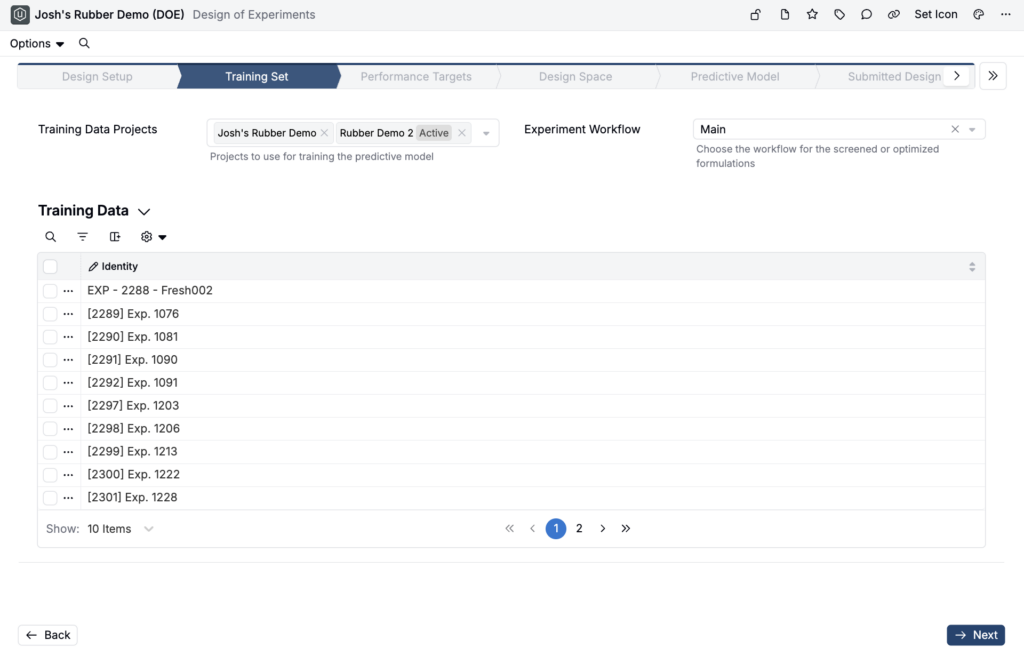
Users now define the Training Set up front, before later setup steps depend on it. This helps ensure the model is trained on the right historical experiment data from the start. The Training Set step also includes validation for workflow mismatches: if selected experiments use a different workflow than the one chosen for the DOE, a warning appears. For one-step workflows, mismatched training data is still used, but recipe steps are collapsed into a single combined formulation for model training.


The Performance Targets step has also been updated. Users can now edit performance target names and goals inline, so small corrections no longer require navigating to a separate page. This step now includes validation to catch incomplete or non-usable specs before continuing: if a performance target goal has no data, a warning appears, and if all performance goals contain no measure data, users are blocked from continuing until the issue is resolved.
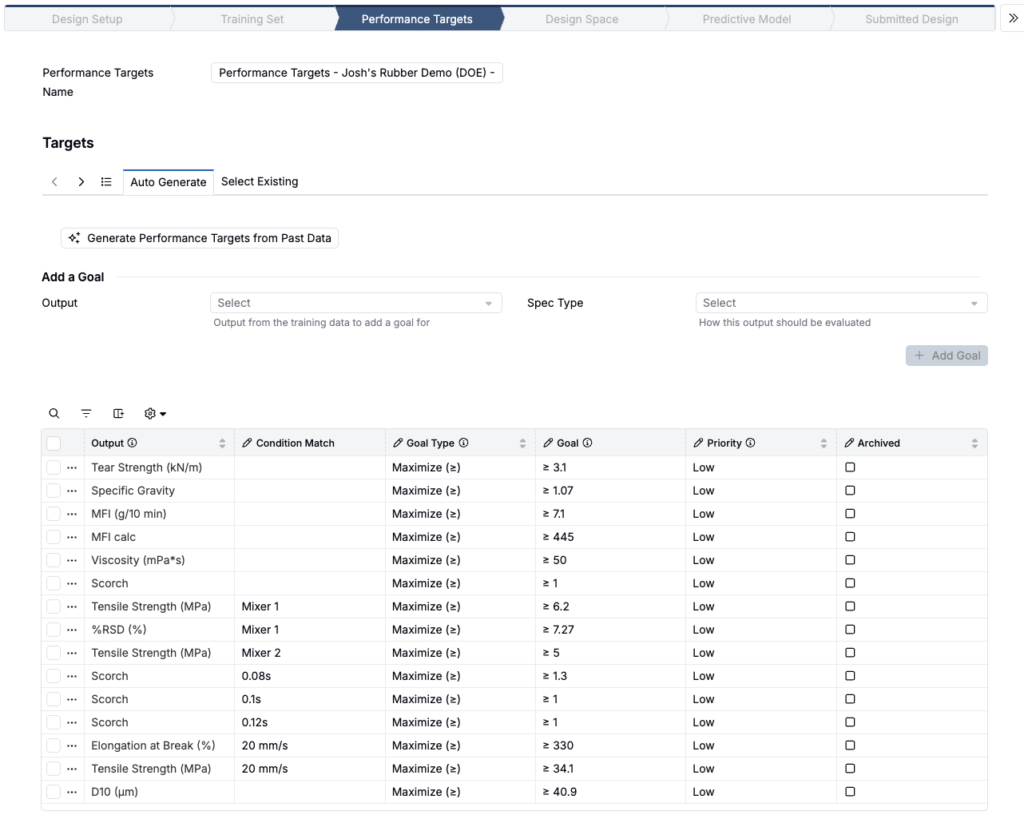
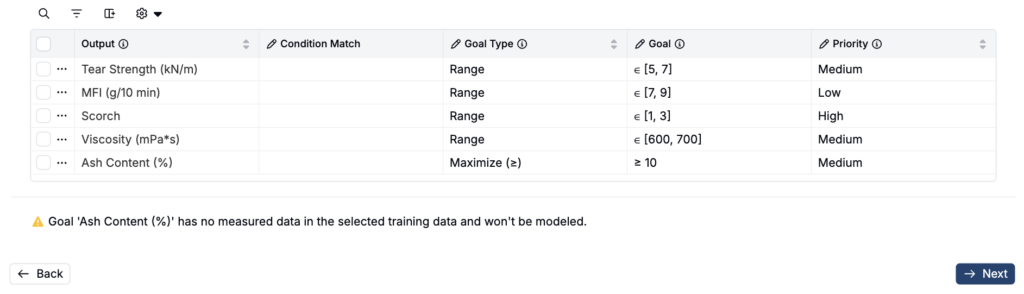

Finally, the Design Space step has been updated so users can edit the constraint name, ingredients used, ingredient amounts, and component mode directly in the flow. The Auto-Generate Constraints button now takes the selected component mode and previously selected training data into account when generating constraints.

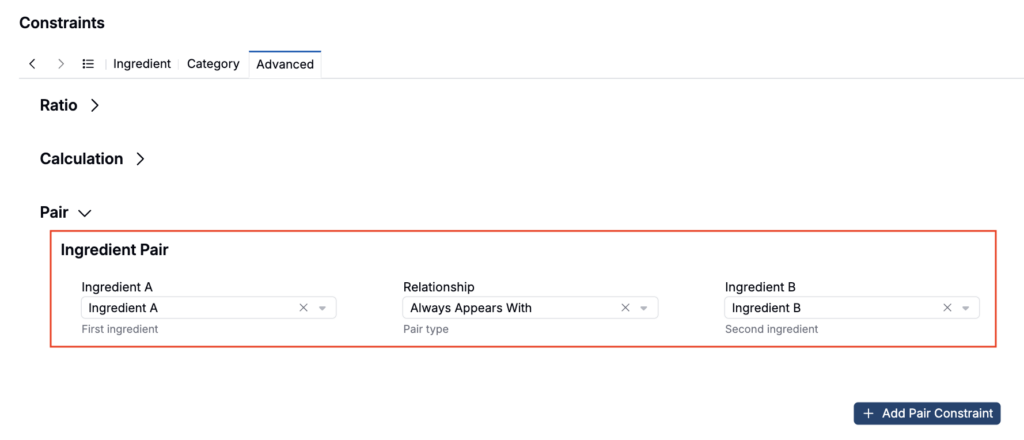
Users can also add Ingredient Pair constraints directly from the Design Space step; these constraints already existed in the full constraint editor, but this update brings them into the guided DOE setup flow so users can specify that two ingredients should always appear together or never appear together without leaving the DOE workflow.
Dashboard Notebooks: New Drag Layout Mode
Dashboard notebooks now supports a new layout mode, Vertical Cell Compaction. By default, cells in a dashboard notebook can be dragged freely but wouldn’t push each other aside.
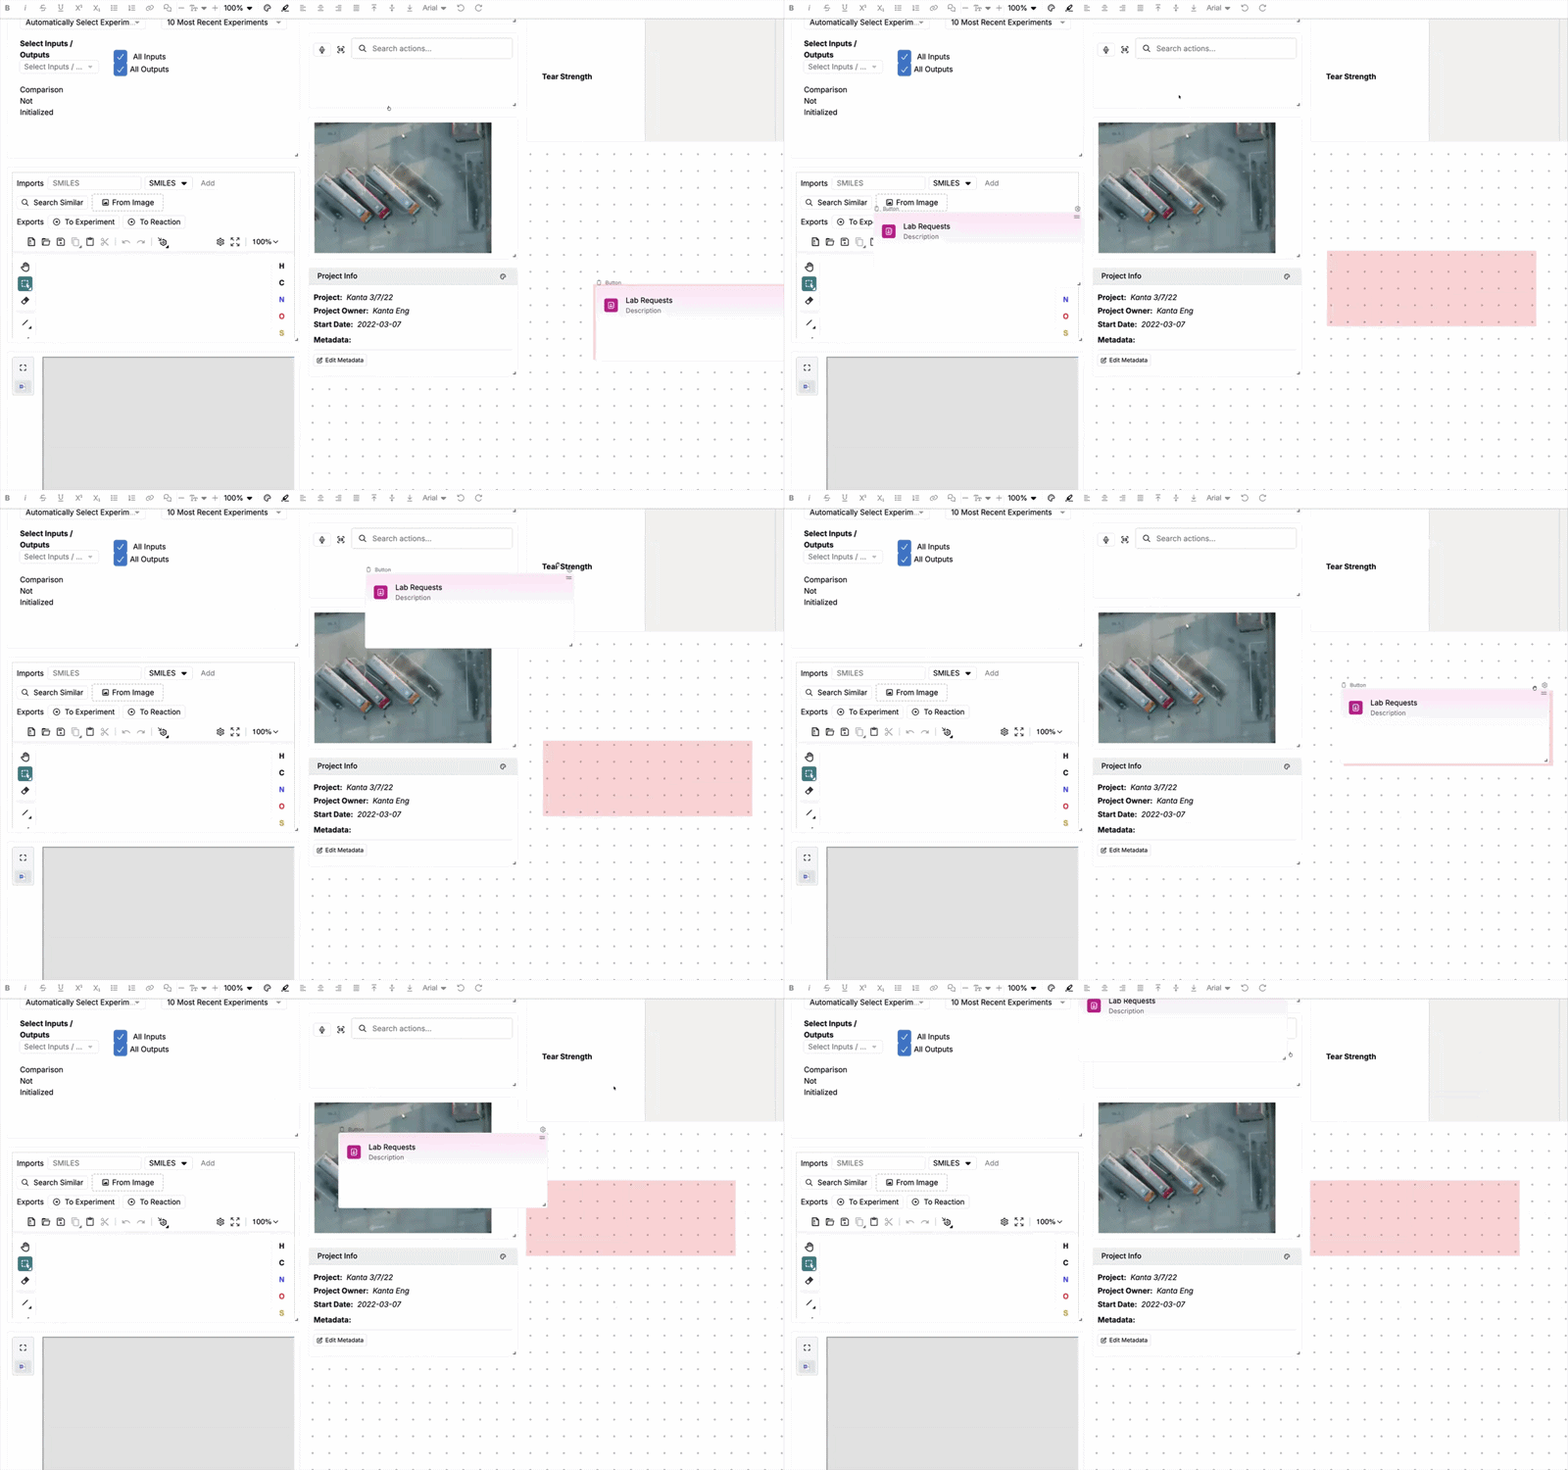
By enabling Vertical Cell Compaction (View > Vertical Cell Compaction), dragging a cell will push other cells out of the way, making it easier to reorder cells within a notebook.
Note that with this mode enabled, cells can no longer be dragged freely with gaps left between them. Toggle it back off if you need that behavior.
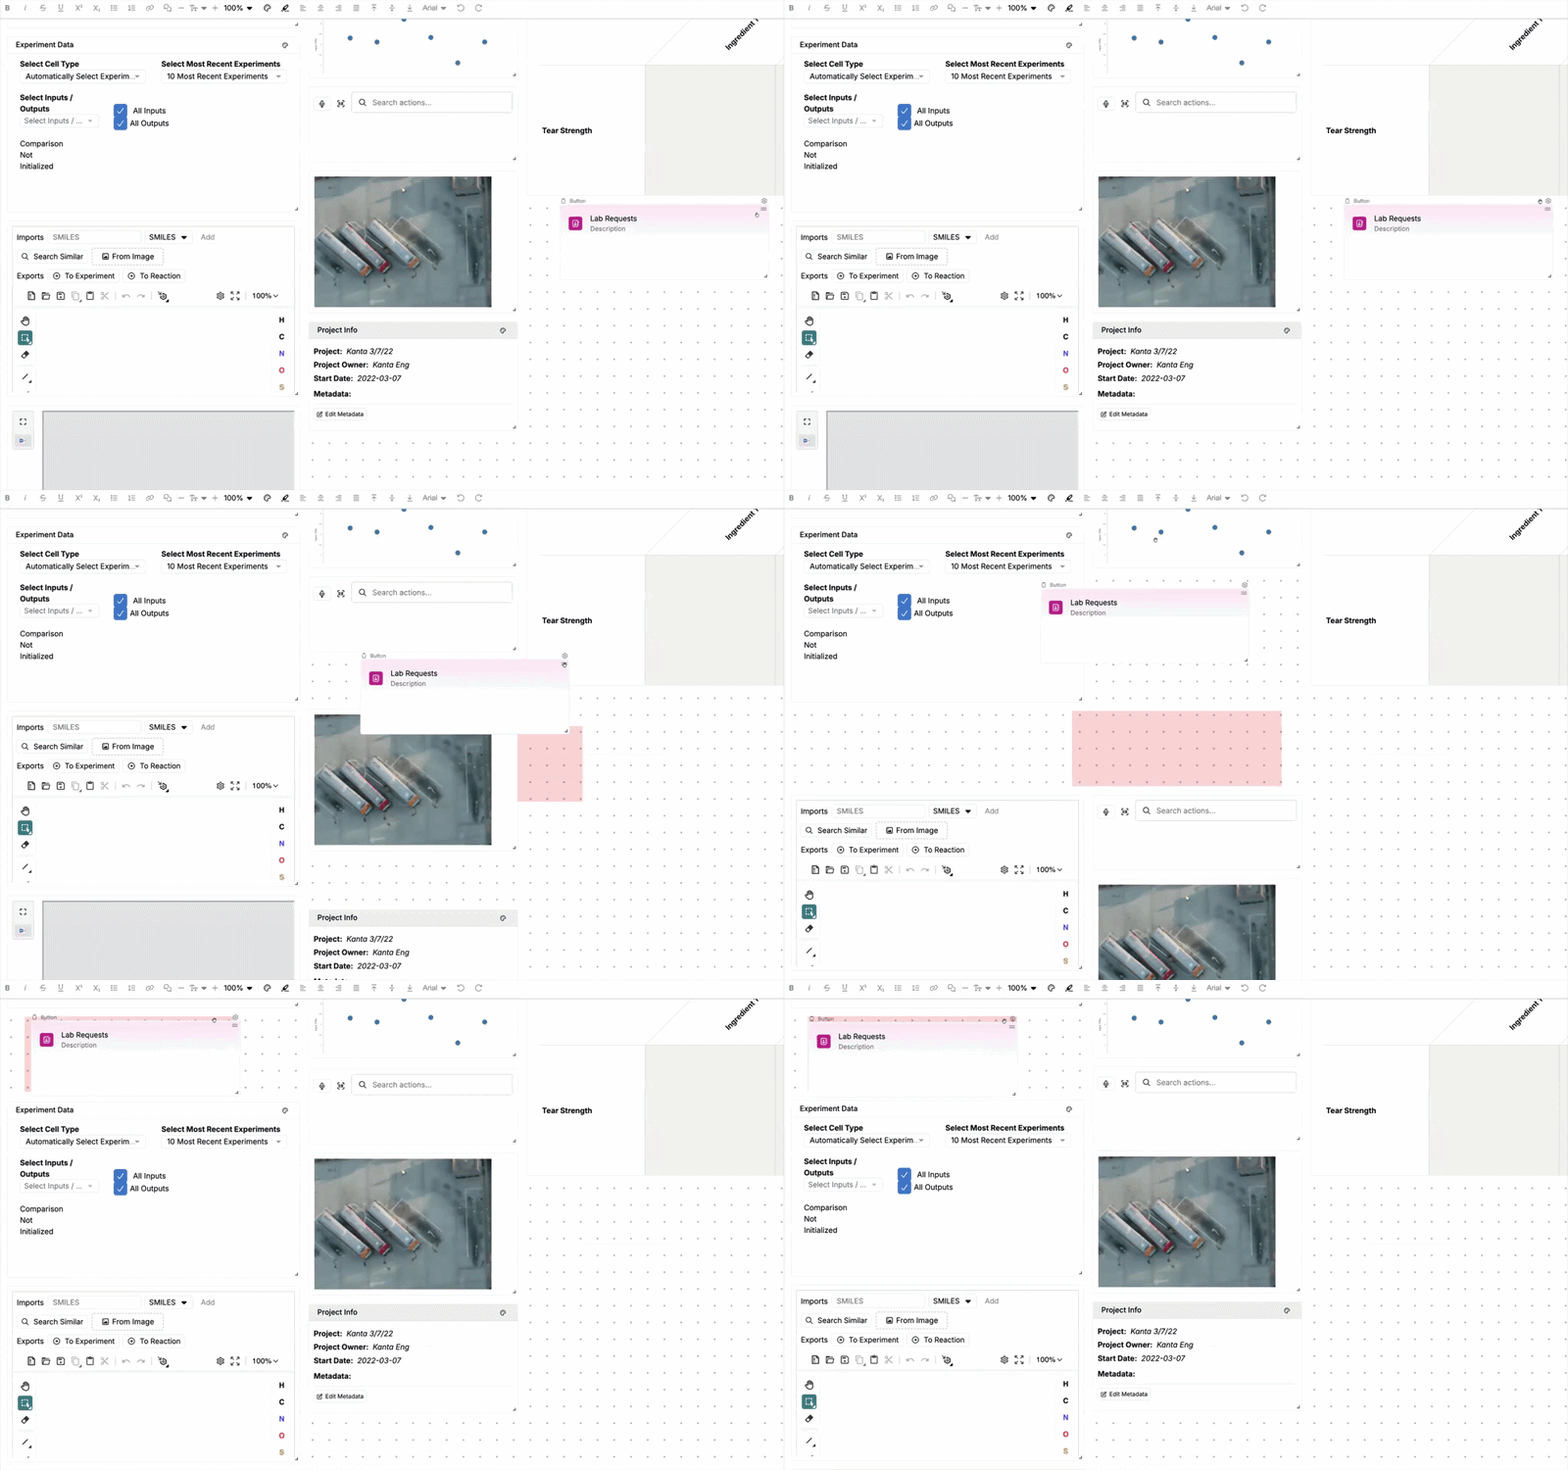
Having both modes available means you can turn on Vertical Cell Compaction to quickly restructure a long dashboard, then switch back to free placement when you want deliberate spacing between cells.
Solver Advanced Settings: New Lock and Update Buttons
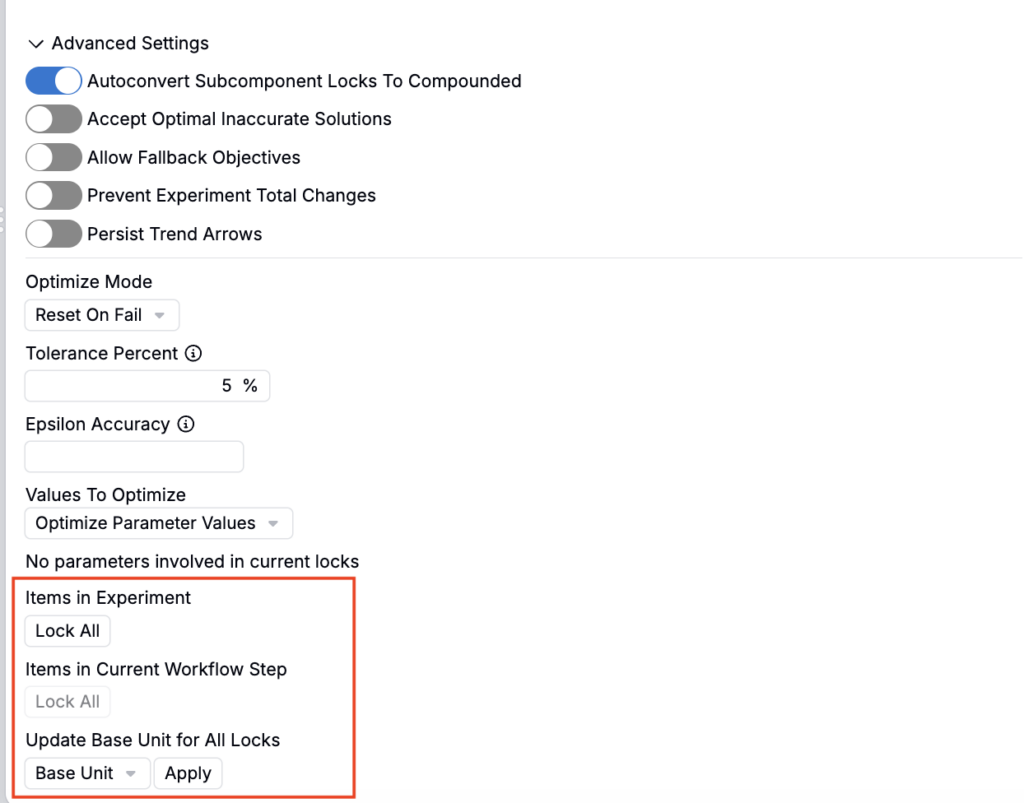
Three new buttons have been added to the advanced settings section of the Solver side panel, giving you faster ways to lock ingredients and standardize units before running a solve.
- Items in Experiment: Locks every ingredient in the recipe with a single click, useful when you want the solver to hold the full existing formulation fixed and only explore a small set of unlocked variables.
- Items in Workflow Step: Locks all items in whichever workflow step your currently focused cell belongs to, so you can lock one process step at a time instead of the whole recipe — helpful for multi-step workflows where you want to fix an earlier step while still optimizing a later one.
- Update Base Unit for All Locks: Updates the base unit for every currently locked item to match a selected unit in one action, instead of updating each lock’s unit individually. This is particularly useful when a recipe was built from ingredients with mixed units and you want everything locked to a consistent basis before solving.
Together, these buttons cut down on repetitive manual locking and unit cleanup, especially for larger or more complex recipes where locking or restandardizing units item-by-item would otherwise take a while.
Condition Parameter Unit Conversions
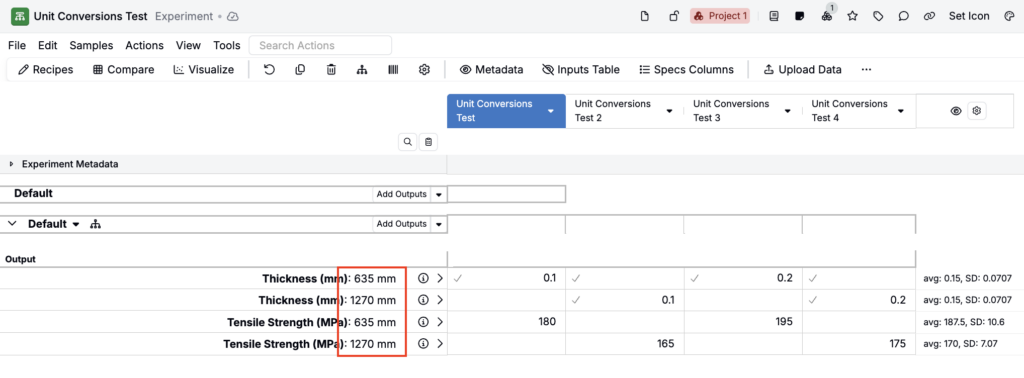
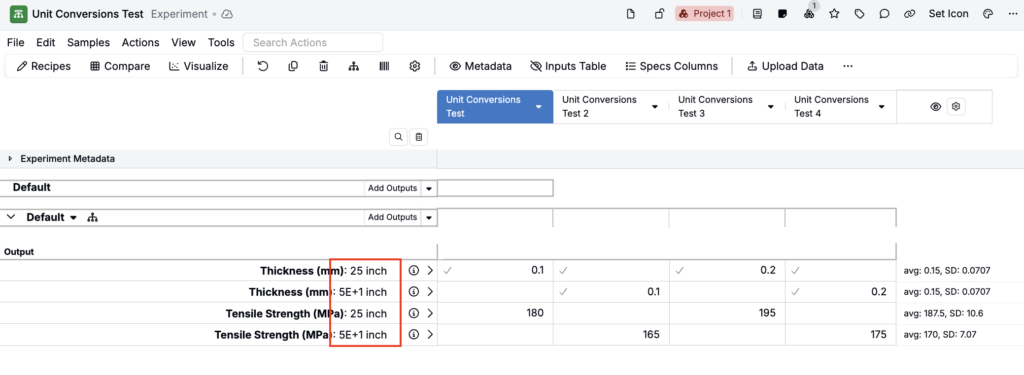
You can now configure unit conversions for any numeric condition parameter, letting each user view and enter condition values in their preferred unit.
Previously, unit conversion support for condition parameters was limited to a fixed set of special cases: temperature (°C/°F) and time. All other numeric condition parameters were locked to the unit defined at creation. This was a friction point for teams with users working in different unit systems, such as a US team needing imperial units alongside a metric-using EU team working with the same parameters.
With this update, any numeric condition parameter with a base unit can have a per-user unit conversion applied. Underlying stored data is not changed.
To learn more, refer to Condition Parameter Unit Conversions.
Quick Add Columns on Enter Recipes
We’ve added a Quick Add Columns action to the Recipe view of experiments that lets you search for and add any column type in one place, without navigating to separate menus.
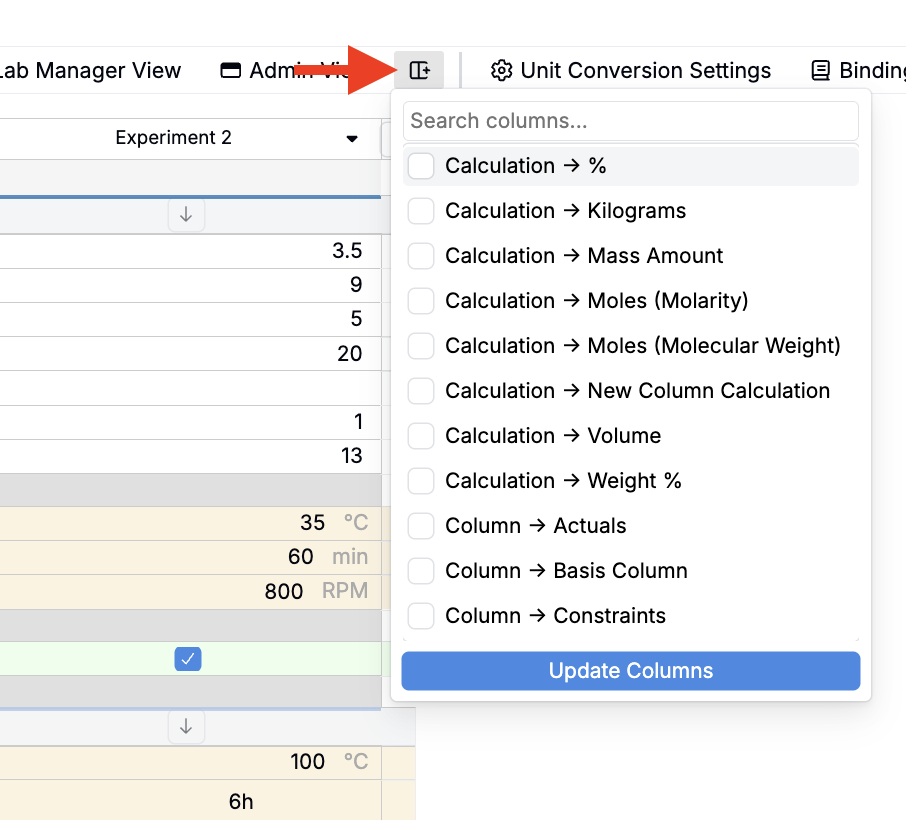
Previously, adding columns to the recipe view required knowing which menu each column type lived in. Ingredient fields, ingredient attributes, recipe step fields, equipment fields, and calculation columns were each added through different actions scattered across the interface. For users who wanted to customize their view on the fly, this made column management time-consuming and hard to discover.
The new Quick Add Columns action consolidates all of these into a single searchable popover. You can type any term (an ingredient attribute name, a calculation, a field type) and matching columns from all categories appear together. Check the ones you want, click Update Columns, and they’re added immediately.
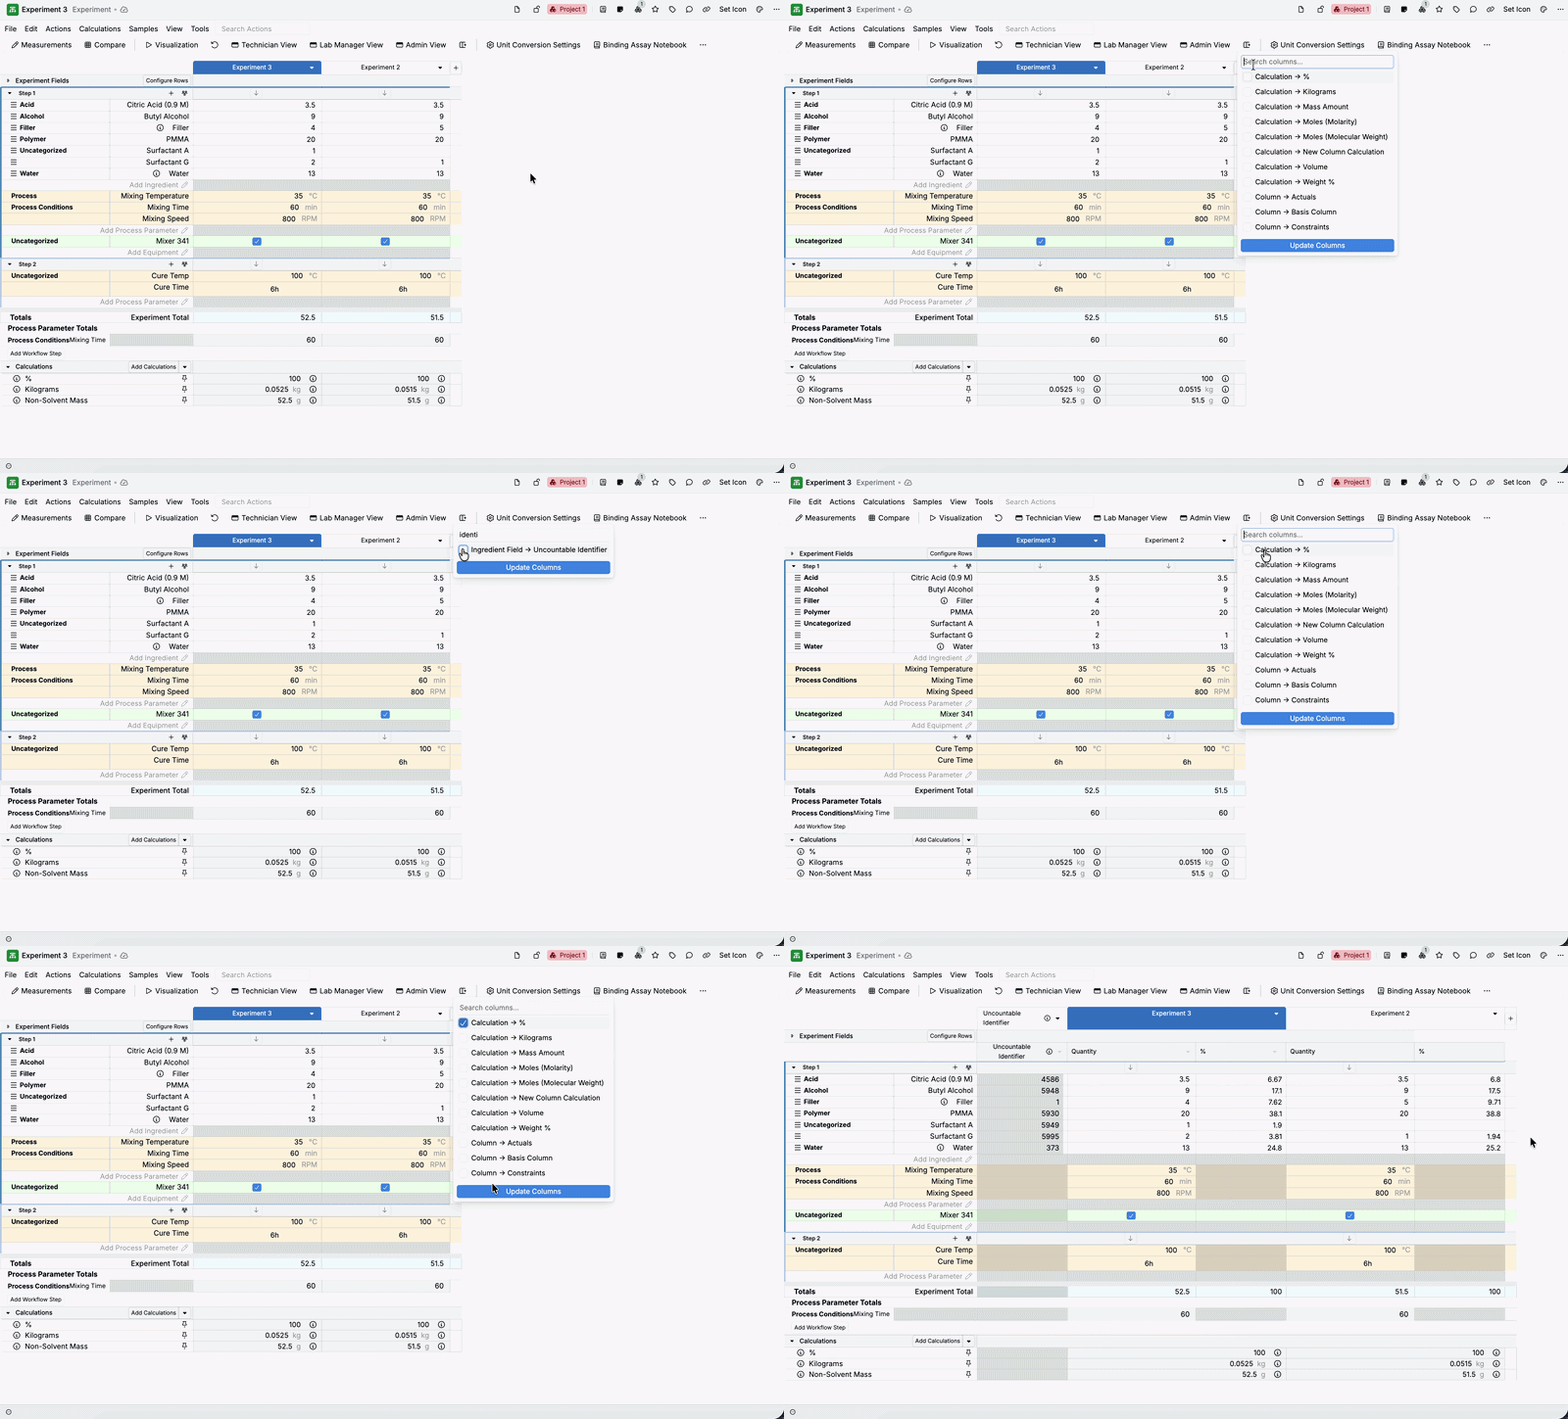
Note: Quick Add Columns is added to the actions bar by default across all schemas. It can be removed from a specific schema via the actions bar admin config, and re-added through the Configure Actions side panel if needed.
Curve Visualization: Column and Row Grid Layout
On the Visualize Curve Data page, you can now split curves into a grid of charts organized by column and/or row input parameter values, rather than seeing all curves stacked on a single plot.
Previously, the Visualize Curve Data page rendered a single chart with color and label parameters — useful for distinguishing curves, but hard to read when many experiments share overlapping values.
With this update, you can select a Column By parameter to split curves into side-by-side charts, one per distinct value.
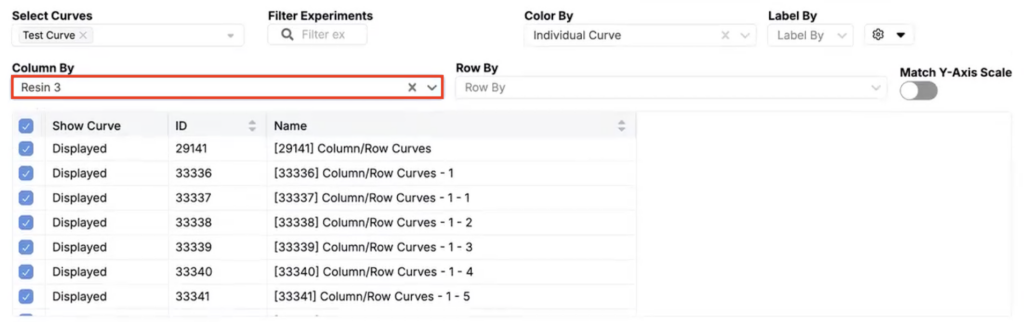
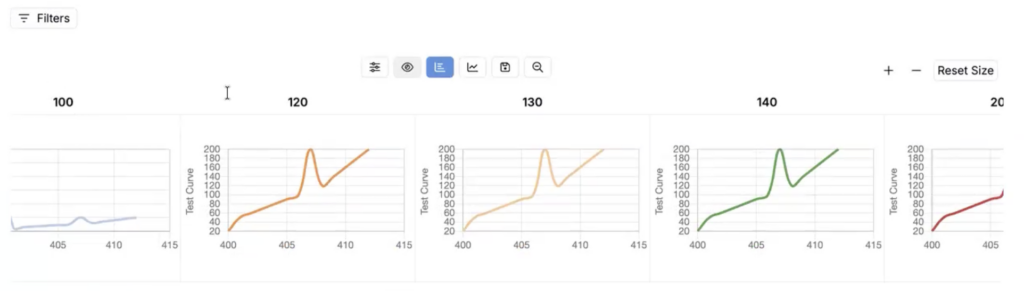
You can also select a Row By parameter to create a grid where rows correspond to different input values. Both can be used together for a full faceted grid layout.
This update makes it much easier to compare how curves differ across a specific input dimension without overlapping lines obscuring the pattern.
Barcode Rendering in Listings
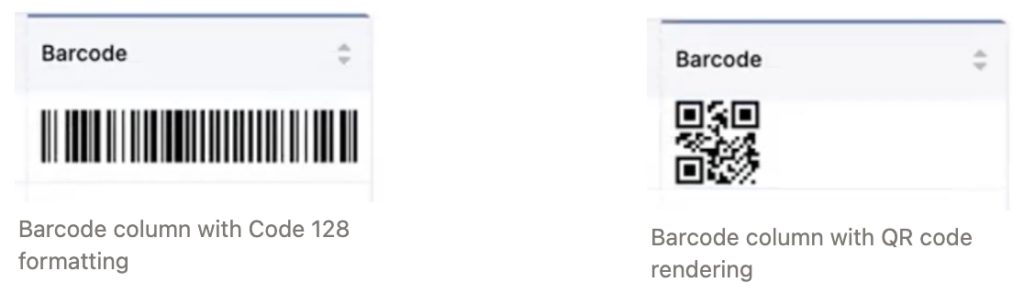
Listings now support rendering scannable barcodes inline using a new barcode image format type. With this update, you can format a listing column to display a barcode (either a QR code or a Code 128 barcode) directly in the interface, scannable straight from the screen. This removes the need to open each entity individually to download or view a label.
How to configure:
- Open the listing where you want to surface barcodes.
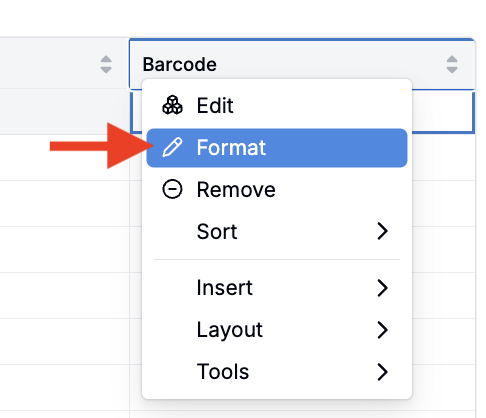
- Select Format from the Barcode column header menu.
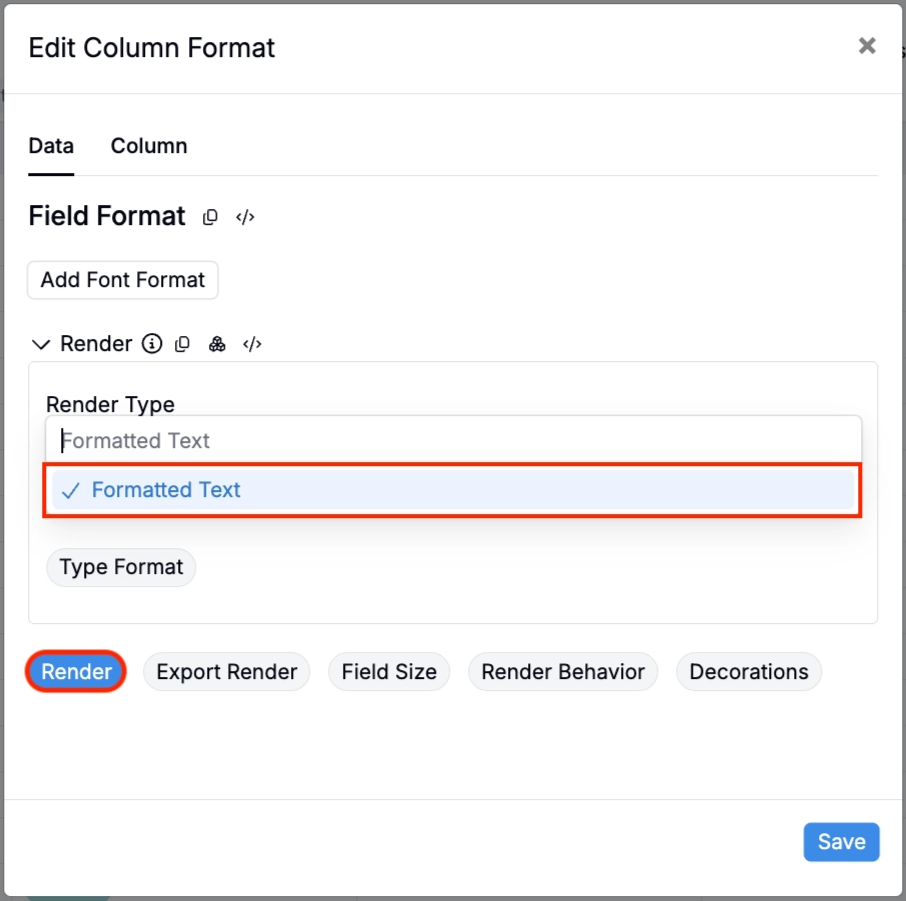
- In the modal, click Render. Set Render Type to Formatted Text.
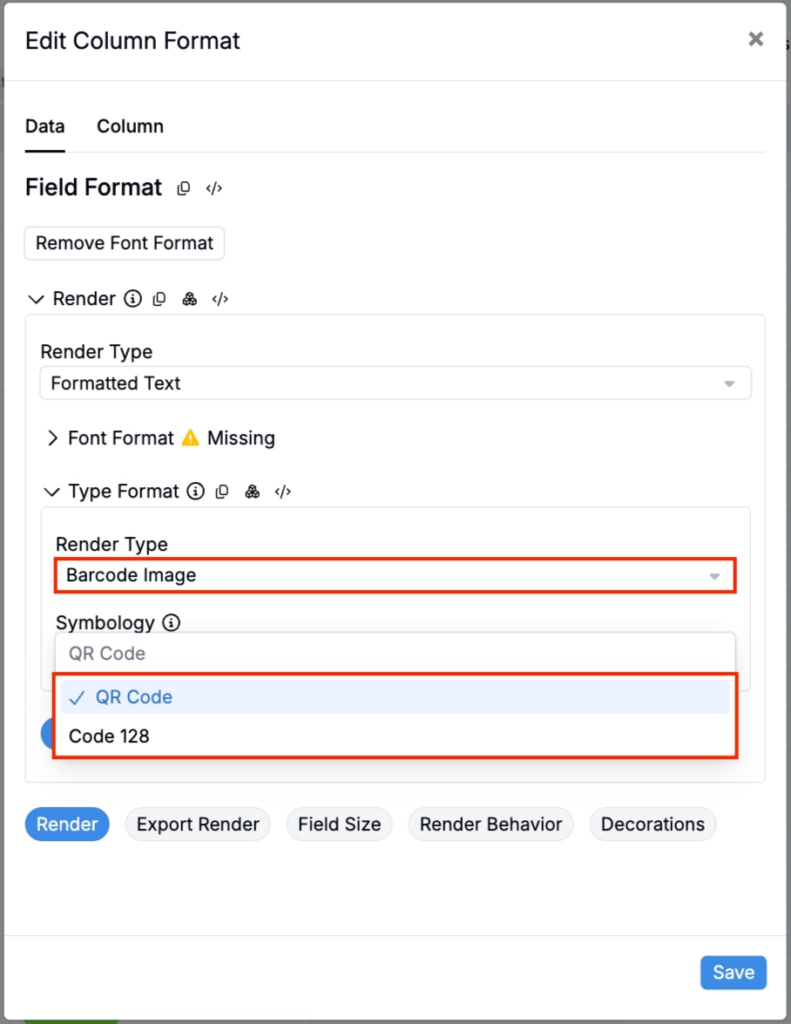
- Select Type Format. Set Render Type to Barcode Image.
- Use the Symbology Field to select between the standard Code 128 barcode or a QR Code.
- Save. The listing will now render a scannable barcode for each row.
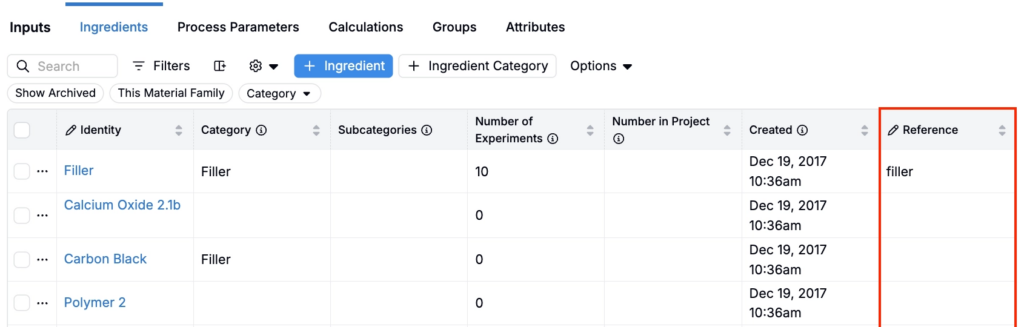
Reference name Editing Moved to Listings
The standalone Ref name Editor on the control panel has been retired. Reference names can now be edited directly through listings, using the same interface you use to manage other entity fields.
Previously, editing a reference name required navigating to a separate editor on the control panel. With this update, ref name editing is available inline from any listing where ref names are exposed. The behavior is identical (uniqueness checks and character validation still apply, and changes sync to the store) but the workflow is now consistent with how other fields are managed across the platform.
To learn more, visit Reference Names.
Audit Log: Redesigned View with New Columns
The Audit Log has a new visual design and several new columns, making it easier to understand and investigate changes across the platform.
Previously, the audit log showed limited data with no ability to customize the view. With this update, the log includes two new columns — Entity type and Entity ID — and displays both the previous value and new value for entity actions and file operations. You can also hide columns you don’t need and resize columns for better readability.
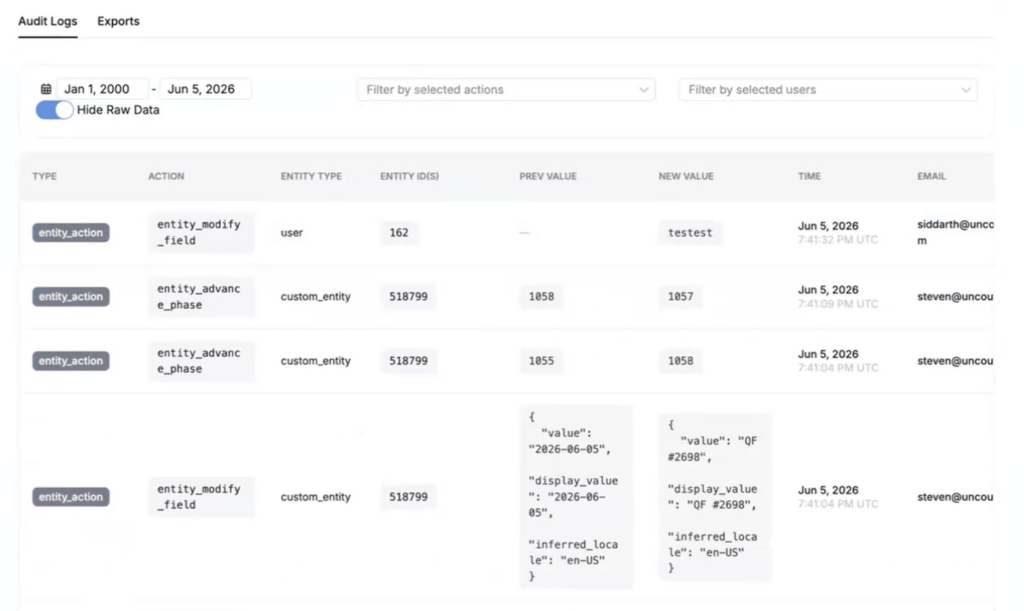
Table Builder: Conditional Background Color Formatting for Text Values
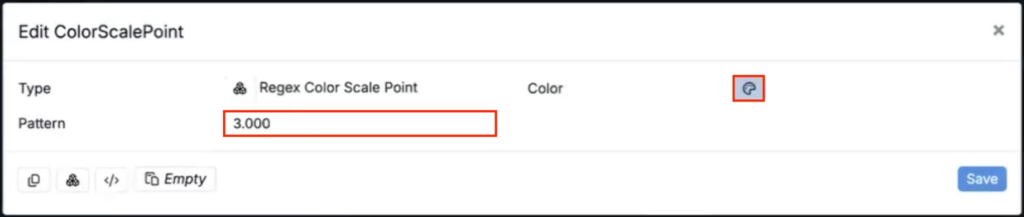
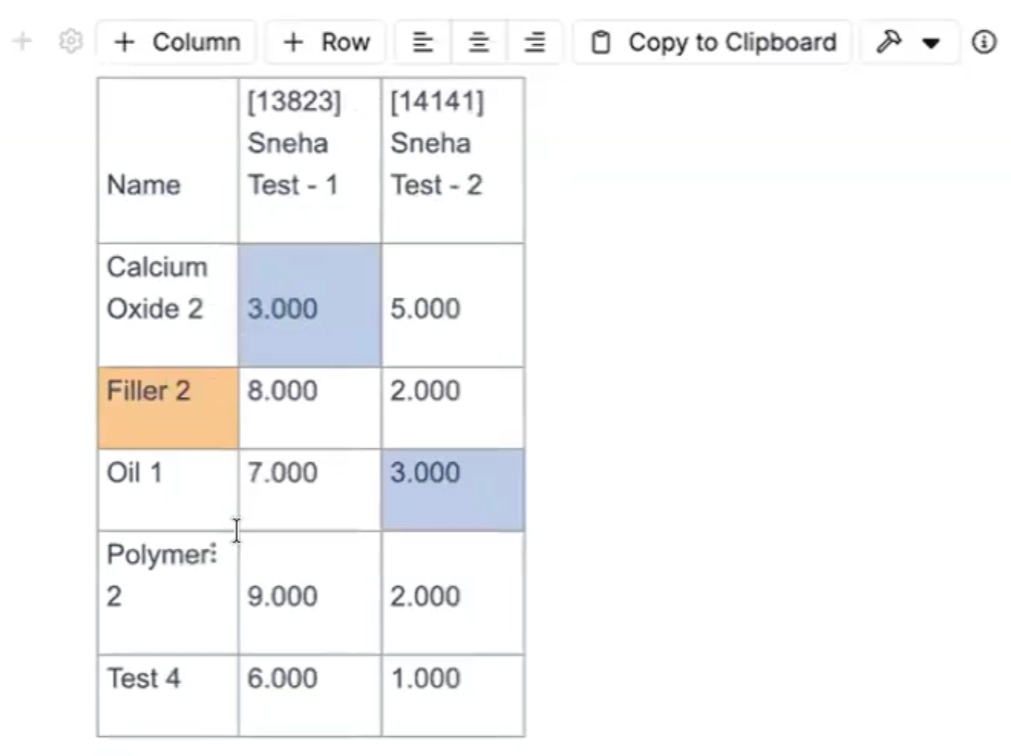
The Table Builder now supports regex-based background color formatting for text cell values, extending the conditional formatting that previously only applied to numeric data.
Previously, cell background colors in tables could only be set based on numeric scales. With this update, you can define regex pattern rules that automatically apply a background color to any cell whose value matches the specified pattern. This makes it straightforward to highlight statuses, flag specific terms, or visually differentiate categories in table outputs.
How to configure:
- Open a notebook table’s Table Builder.
- Under Formatting, add Cell Formatting.
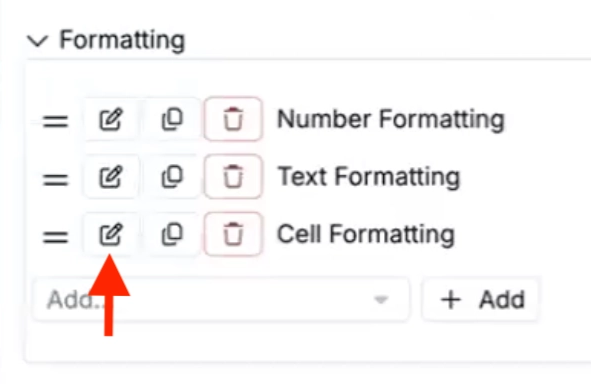
- Add Background Color formatting. Set Color type to Color Scale and points to Regex Color Scale Point.
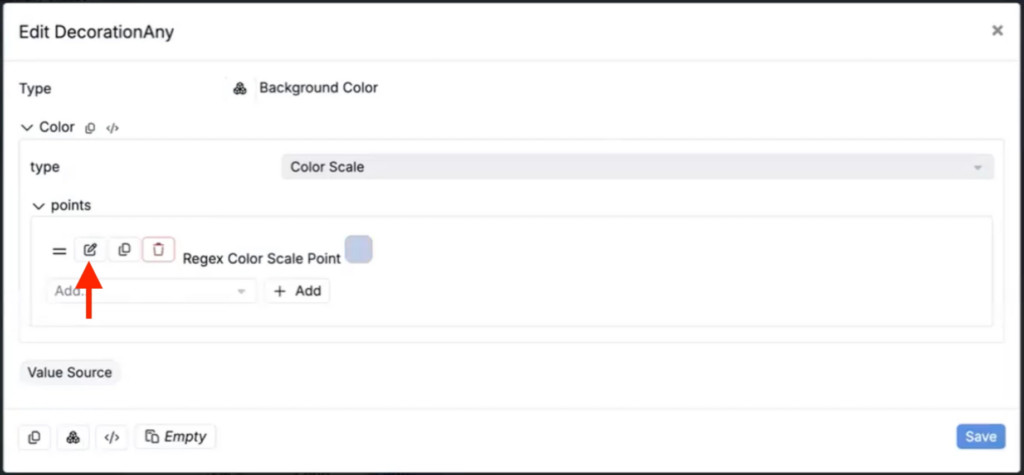
- Choose the background color and pattern.
- Save. Any cell matching the pattern will automatically display the configured background color.