Managing a lab involves numerous tasks, from tracking experiments to ensuring equipment availability. To streamline these responsibilities, Uncountable has introduced the Notebook Dashboard, a feature within the Integrated Electronic Laboratory Notebook (ELN) tool. The Notebook Dashboard provides a real-time view of key lab activities, combining critical data, visualizations, and analytics.
Designed for both frequent users and those who interact less often, like managers and executives, the Notebook Dashboard pulls platform data into live charts and tables, updating as your team works. Whether you’re hands-on in the lab or need a high-level overview, the Notebook Dashboard provides insights to optimize decision-making and resource management.
For supported cells, enable Live Update Mode from View > Toggle Live Update Mode to automatically refresh data as filters or project data change.
Notebook Dashboard Use Cases
Use the Notebook Dashboard to visualize real-time data effectively with live-updating bar charts, pie charts, line charts, radar charts, and ternary plots.
Bar charts can also be displayed vertically or horizontally, with grouped or stacked series. This flexibility is particularly useful for monitoring experiment-related metrics, managing lab utilization, and tracking project progress. Learn more.
Example use cases for dashboards include:
- Lab Utilization Reporting: Use a line or radar chart to track resource allocation across labs, equipment, and personnel.
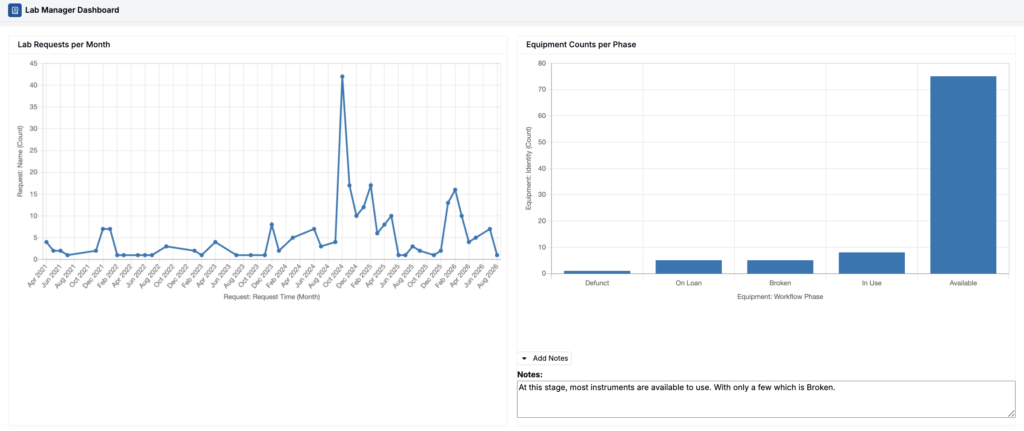
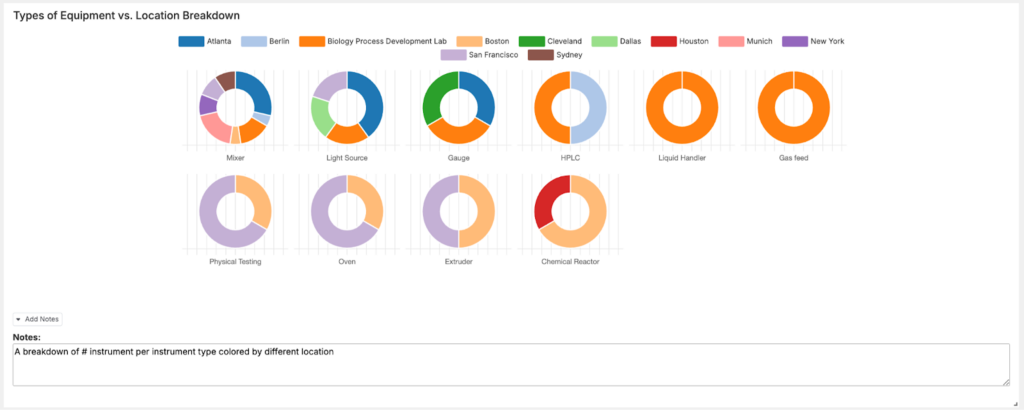
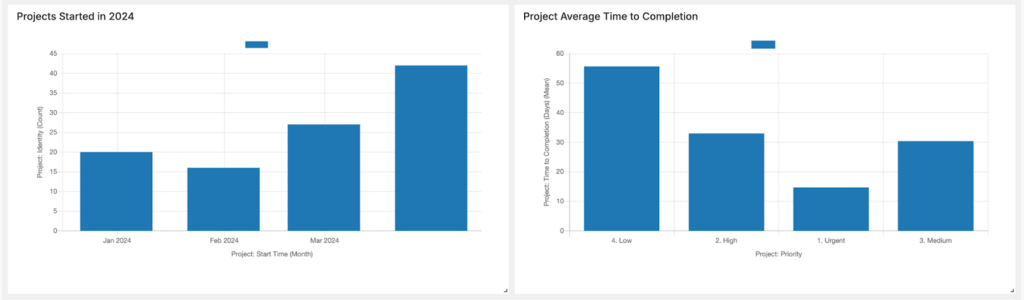
- Project Tracking: Report key project metrics like project duration, cost, and success rate, allowing lab managers to stay on top of critical project timelines and objectives.
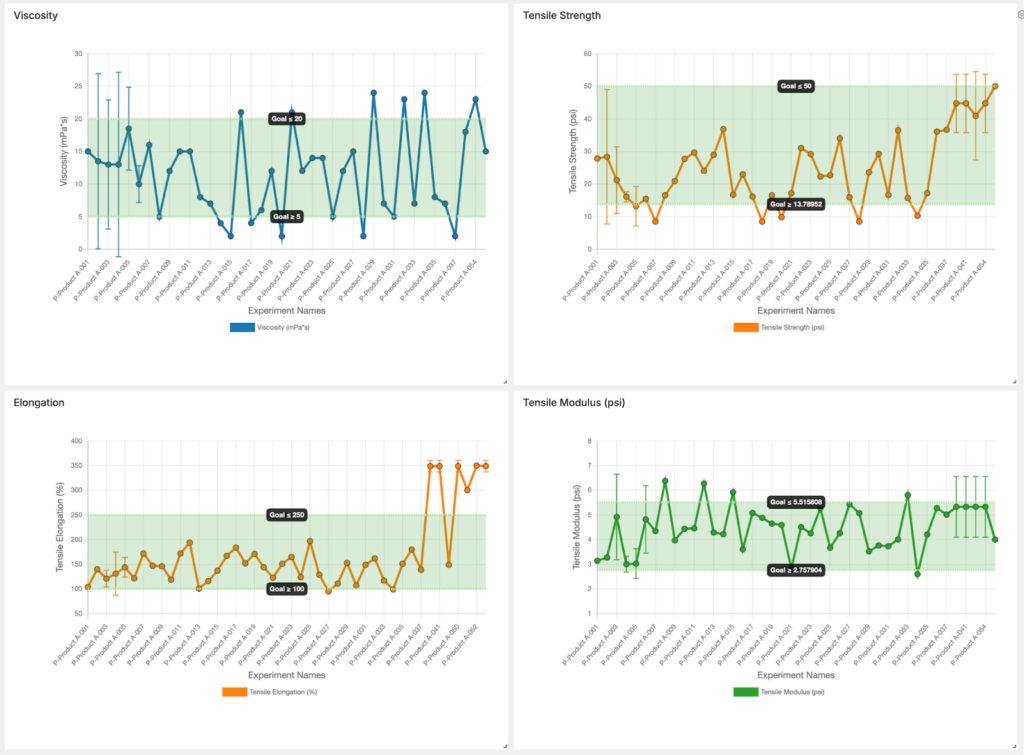
- Statistical Process Control (SPC) Charting: Proactive monitoring of product performance with SPC charts and real time “out-of-spec” notifications. Learn more.
Creating a Notebook Dashboard
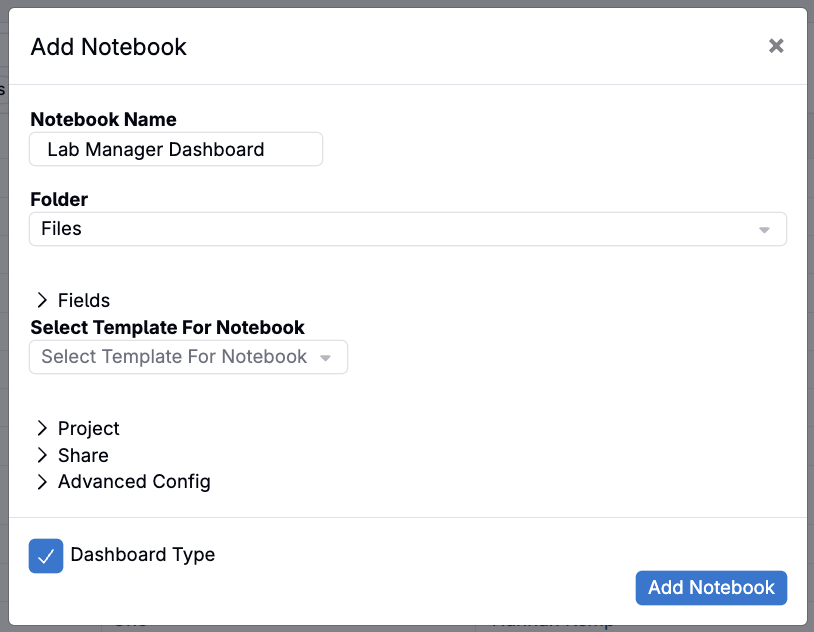
- Navigate to the Notebooks page, click Add and select Notebook.
- In the modal:
- Add a name
- Select a folder to add the notebook to
- Select a template (optional)
- Specify the project to associate the notebook with (optional)
- Choose users or user groups to share the notebook with
- Check the Dashboard Type checkbox to ensure you’re setting up a Dashboard rather than a standard ELN.
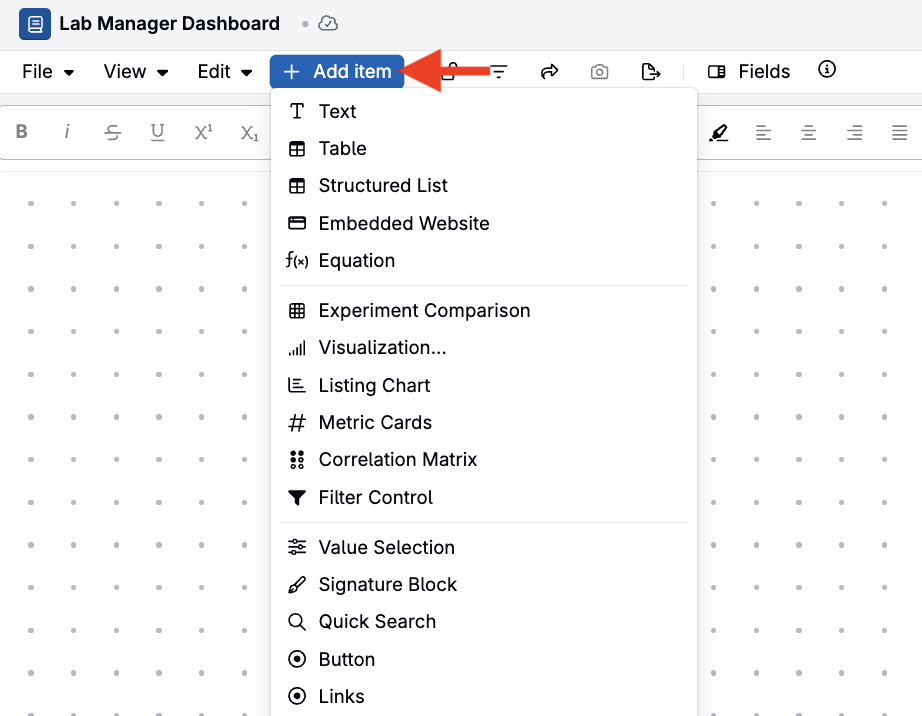
Once created, click the blue Add Item button to add a listing chart, text, custom table, structured listing, embedded website, button, or another supported item. Refer to Adding Items into a Notebook for the full list.
Customizing Your Notebook Dashboard
Once your charts have been added, you can further customize your notebook dashboard by dragging and dropping, resizing charts, changing their titles, adding notes, changing background colors, or deleting items that are no longer relevant.
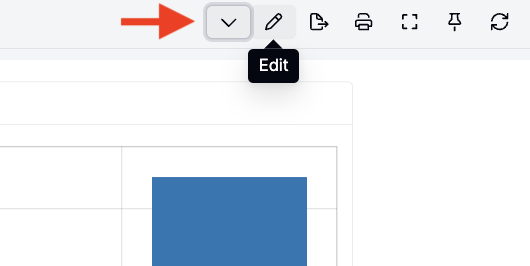
To edit an existing dashboard, click the arrow in the top right corner to expand header options, then select the pencil icon to edit.
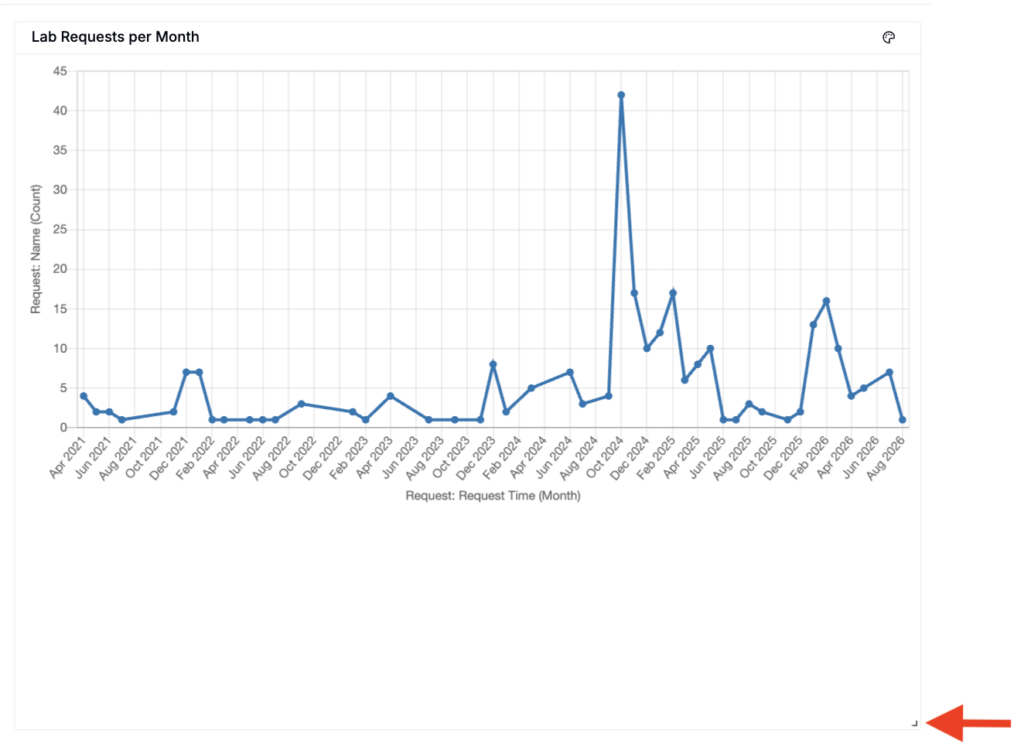
- To resize your chart, click and drag the arrow in the bottom right corner.
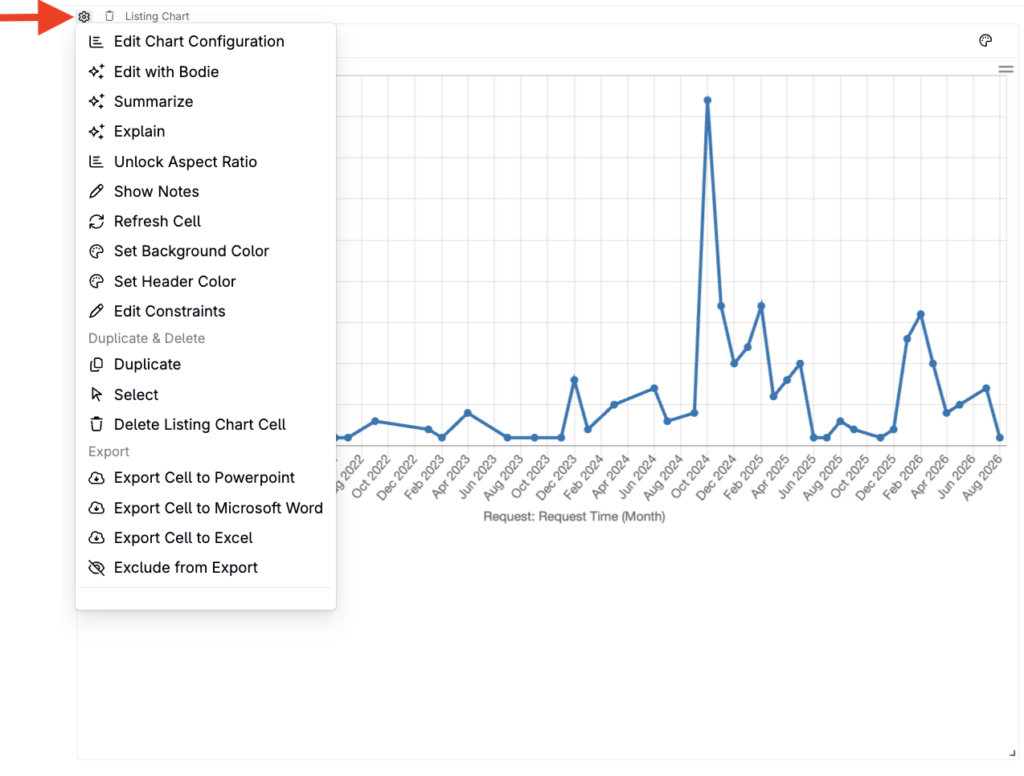
- To configure, edit, change background color, move, or delete your chart, click the cog icon in the top left corner and select from the menu options.
To make it easier to reorganize dashboard items, you can also turn on Vertical Cell Compaction from the View menu. With this mode enabled, dragging a cell pushes other cells out of the way and automatically closes vertical gaps. Turn it off if you want to place cells more freely with open space between them.
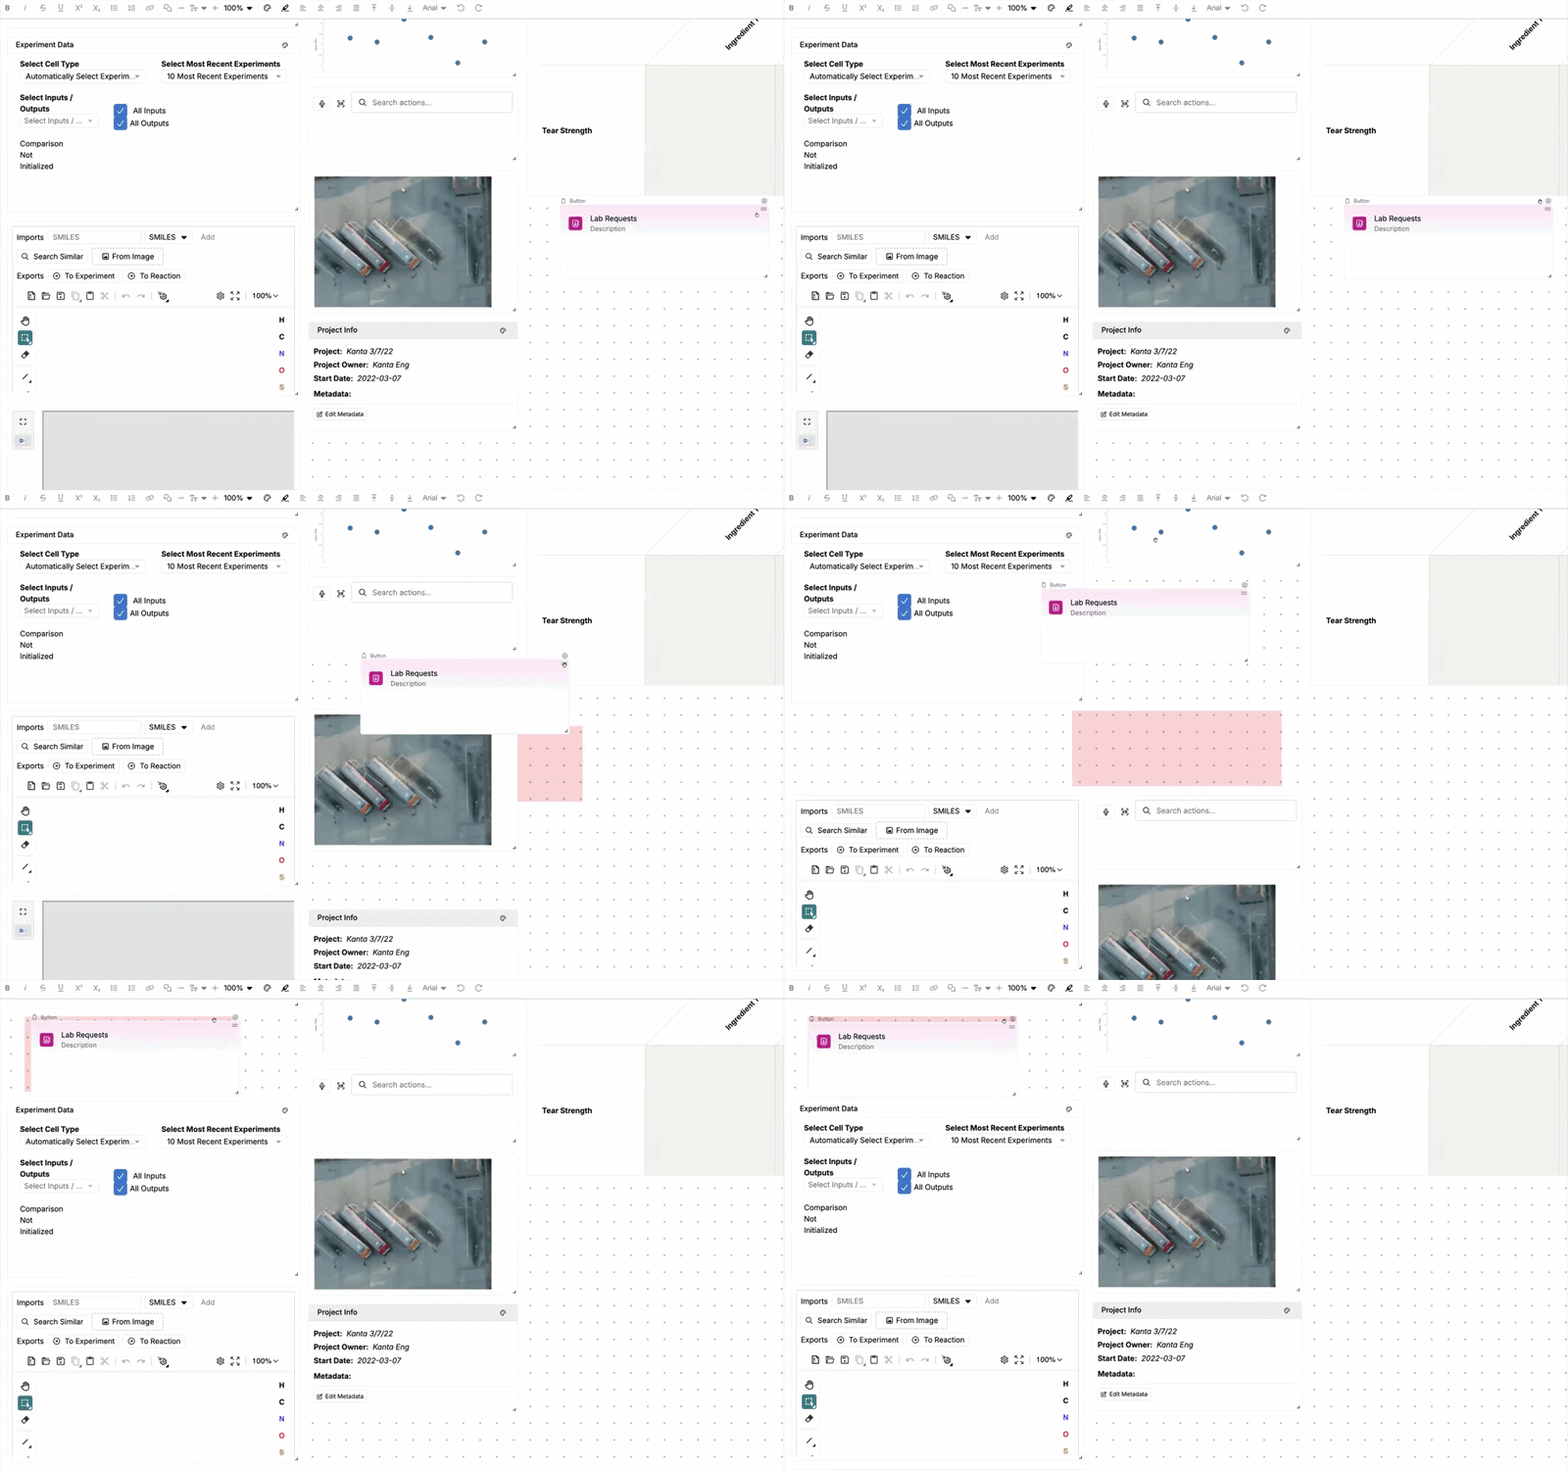
Filters
Filters can be applied to notebook dashboards to refine the data displayed. You can add filters for categorical and numeric data types.
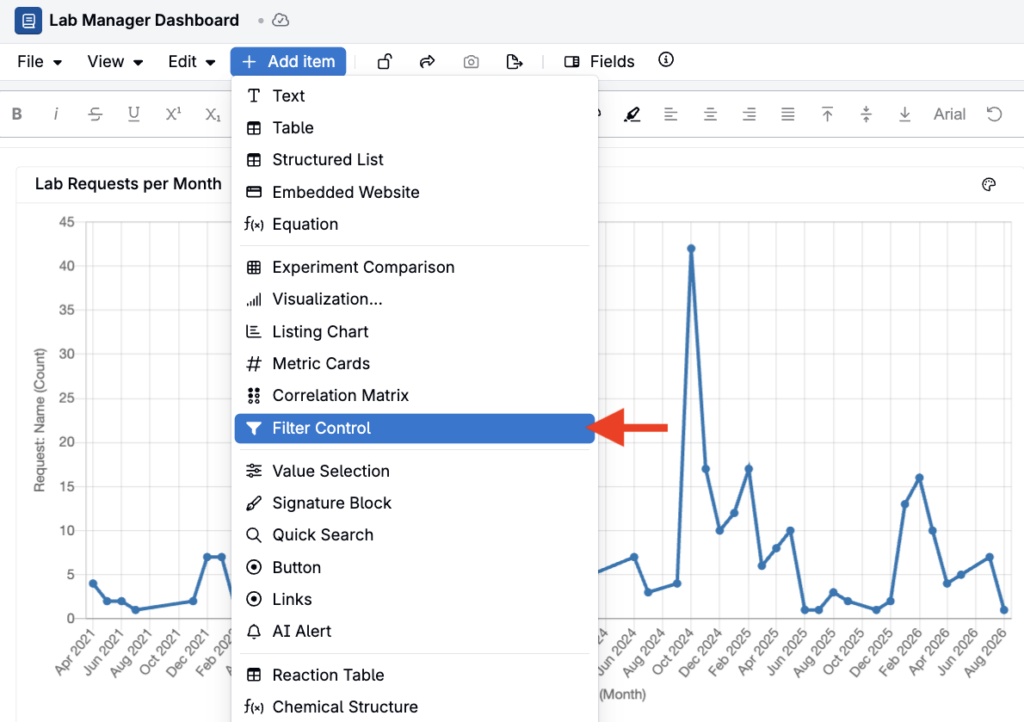
- To create a filter control cell, click Add Item and select Filter Control. Then, select the entity type you want to filter.
With Live Update Mode enabled, filters also refresh Table Builder–backed cells; these cells are read-only while live updating. Plain tables without a Table Builder configuration do not update automatically.
Adding Interactive Filters
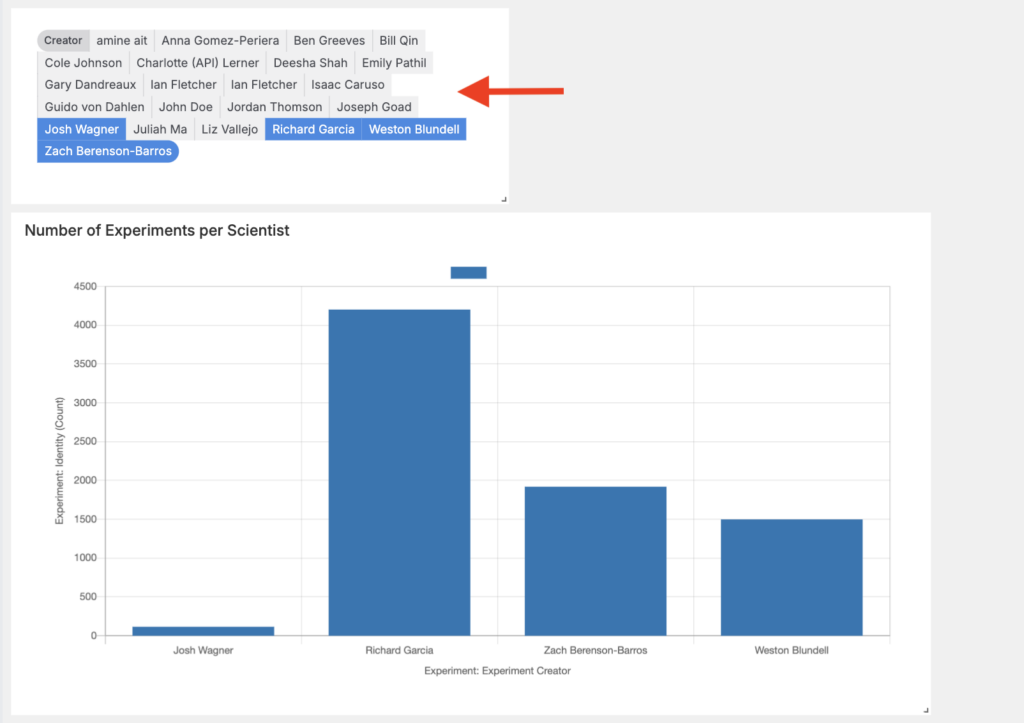
Users can also add interactive pill, dropdown, toggle, or text-type filters to categorical or numeric data. Value Selection controls can provide dashboard-wide entity or date-range selections, including relative defaults such as the previous month.
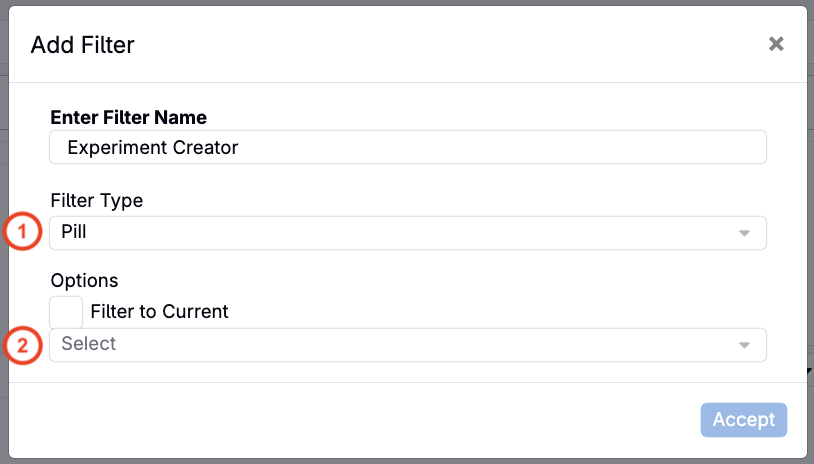
To create an interactive filter, select one or more values using the “includes” option. Then select … > + Add Interactive Filter.

From this modal, first add a Filter name. Use the Filter Type (1) field to select a filter type and the Options (2) field to select filter options.