Condition Parameter Unit Conversions
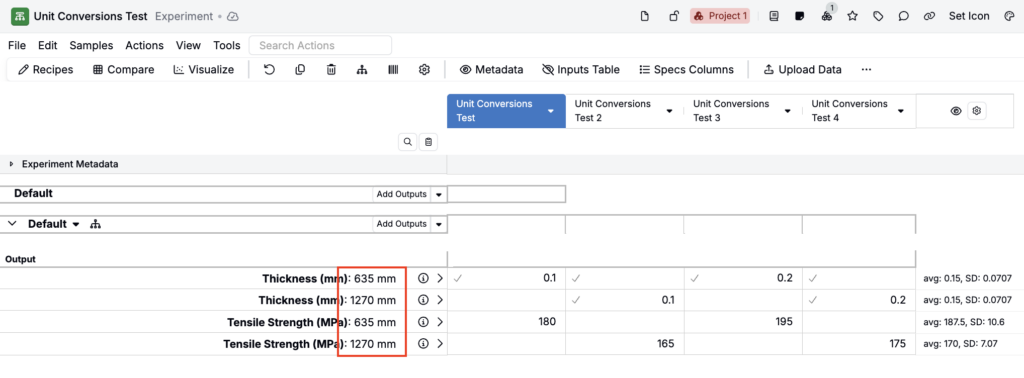
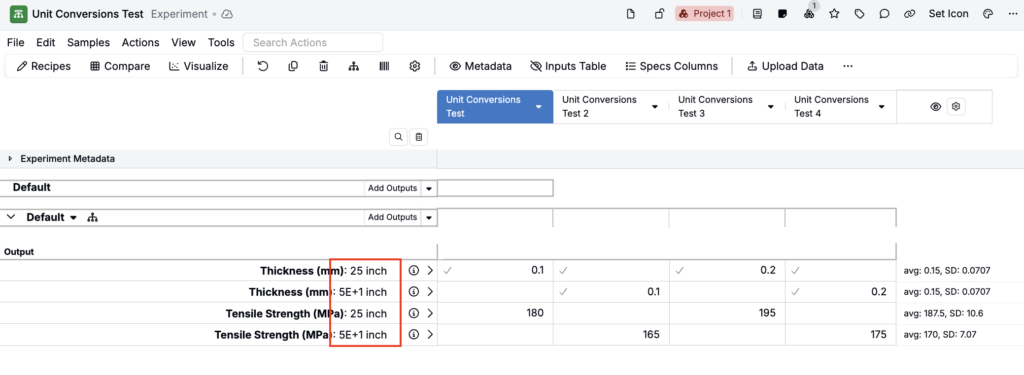
You can now configure unit conversions for any numeric condition parameter, letting each user view and enter condition values in their preferred unit.
Previously, unit conversion support for condition parameters was limited to a fixed set of special cases: temperature (°C/°F) and time. All other numeric condition parameters were locked to the unit defined at creation. This was a friction point for teams with users working in different unit systems, such as a US team needing imperial units alongside a metric-using EU team working with the same parameters.
With this update, any numeric condition parameter with a base unit can have a per-user unit conversion applied. Underlying stored data is not changed.
To learn more, refer to Condition Parameter Unit Conversions.
Quick Add Columns on Enter Recipes
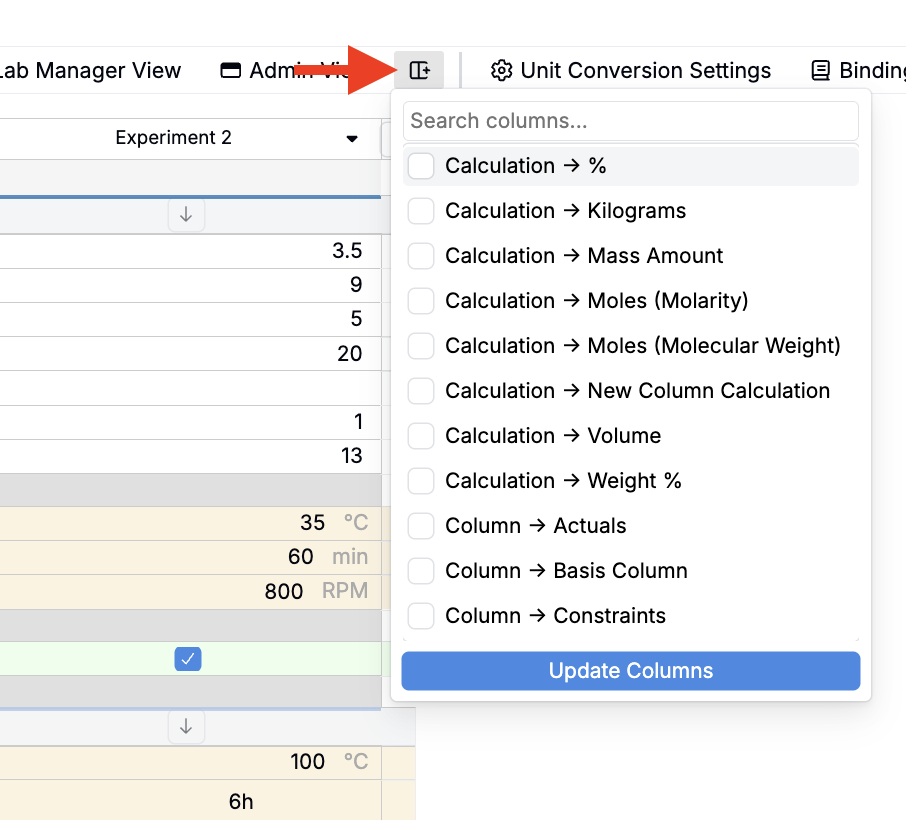
We’ve added a Quick Add Columns action to the Recipe view of experiments that lets you search for and add any column type in one place, without navigating to separate menus.
Previously, adding columns to the recipe view required knowing which menu each column type lived in. Ingredient fields, ingredient attributes, recipe step fields, equipment fields, and calculation columns were each added through different actions scattered across the interface. For users who wanted to customize their view on the fly, this made column management time-consuming and hard to discover.
The new Quick Add Columns action consolidates all of these into a single searchable popover. You can type any term (an ingredient attribute name, a calculation, a field type) and matching columns from all categories appear together. Check the ones you want, click Update Columns, and they’re added immediately.
Note: Quick Add Columns is added to the actions bar by default across all schemas. It can be removed from a specific schema via the actions bar admin config, and re-added through the Configure Actions side panel if needed.
Curve Visualization: Column and Row Grid Layout
On the Visualize Curve Data page, you can now split curves into a grid of charts organized by column and/or row input parameter values, rather than seeing all curves stacked on a single plot.
Previously, the Visualize Curve Data page rendered a single chart with color and label parameters — useful for distinguishing curves, but hard to read when many experiments share overlapping values.
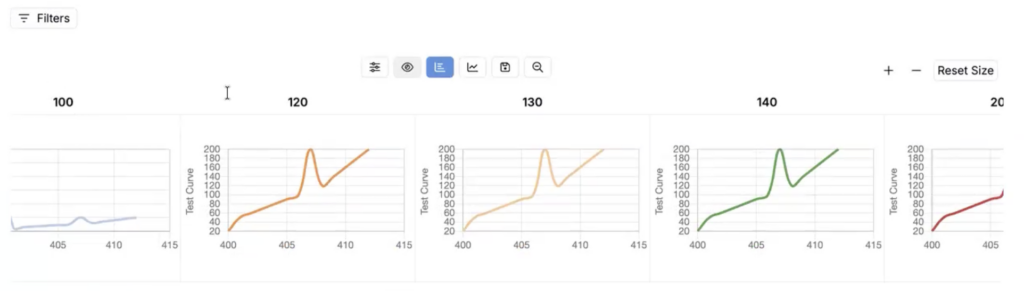
With this update, you can select a Column By parameter to split curves into side-by-side charts, one per distinct value.
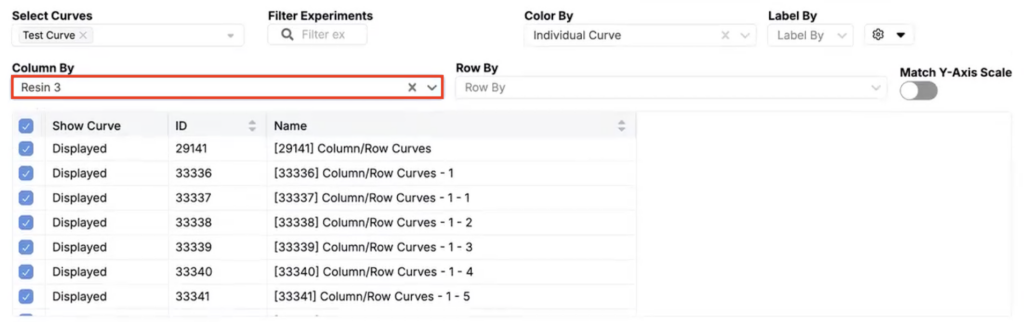
You can also select a Row By parameter to create a grid where rows correspond to different input values. Both can be used together for a full faceted grid layout.
This update makes it much easier to compare how curves differ across a specific input dimension without overlapping lines obscuring the pattern.
Barcode Rendering in Listings
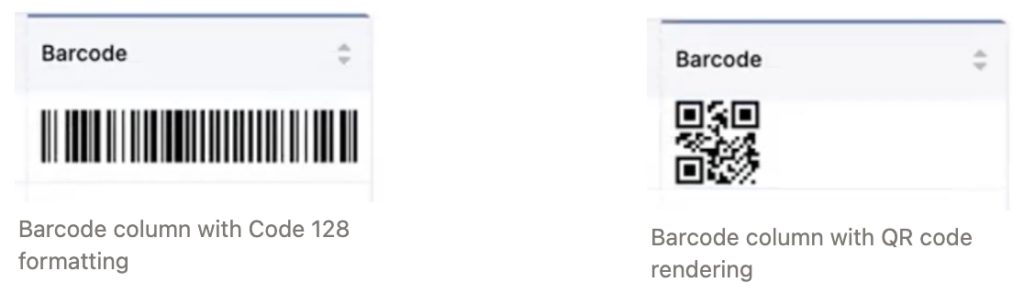
Listings now support rendering scannable barcodes inline using a new barcode image format type. With this update, you can format a listing column to display a barcode (either a QR code or a Code 128 barcode) directly in the interface, scannable straight from the screen. This removes the need to open each entity individually to download or view a label.
How to configure:
- Open the listing where you want to surface barcodes.
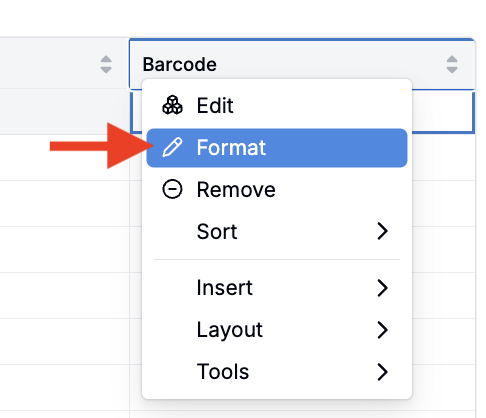
- Select Format from the Barcode column header menu.
- In the modal, click Render. Set Render Type to Formatted Text.
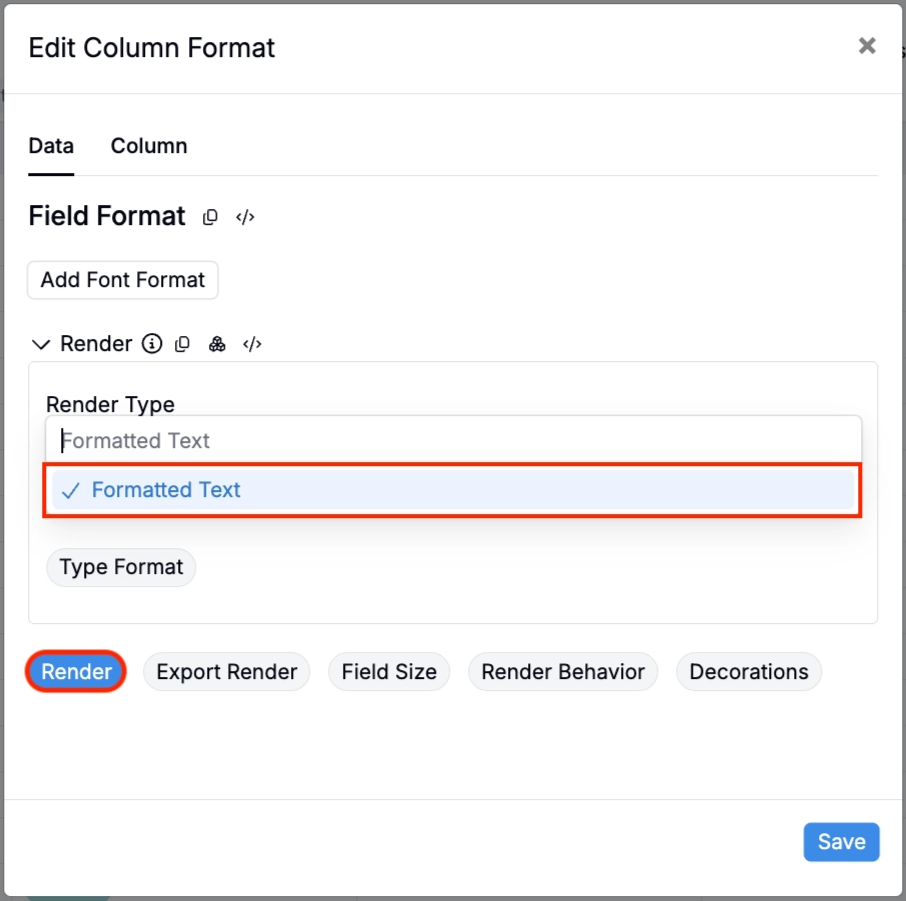
- Select Type Format. Set Render Type to Barcode Image.
- Use the Symbology Field to select between the standard Code 128 barcode or a QR Code.
- Save. The listing will now render a scannable barcode for each row.
Reference name Editing Moved to Listings
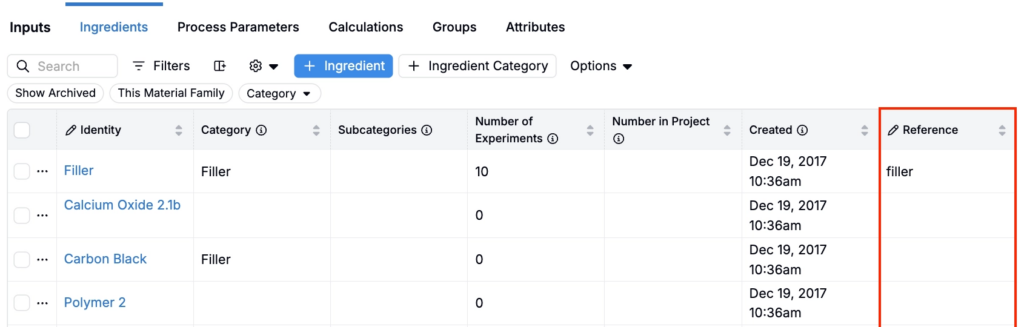
The standalone Ref name Editor on the control panel has been retired. Reference names can now be edited directly through listings, using the same interface you use to manage other entity fields.
Previously, editing a reference name required navigating to a separate editor on the control panel. With this update, ref name editing is available inline from any listing where ref names are exposed. The behavior is identical (uniqueness checks and character validation still apply, and changes sync to the store) but the workflow is now consistent with how other fields are managed across the platform.
To learn more, visit Reference Names.
Audit Log: Redesigned View with New Columns
The Audit Log has a new visual design and several new columns, making it easier to understand and investigate changes across the platform.
Previously, the audit log showed limited data with no ability to customize the view. With this update, the log includes two new columns — Entity type and Entity ID — and displays both the previous value and new value for entity actions and file operations. You can also hide columns you don’t need and resize columns for better readability.
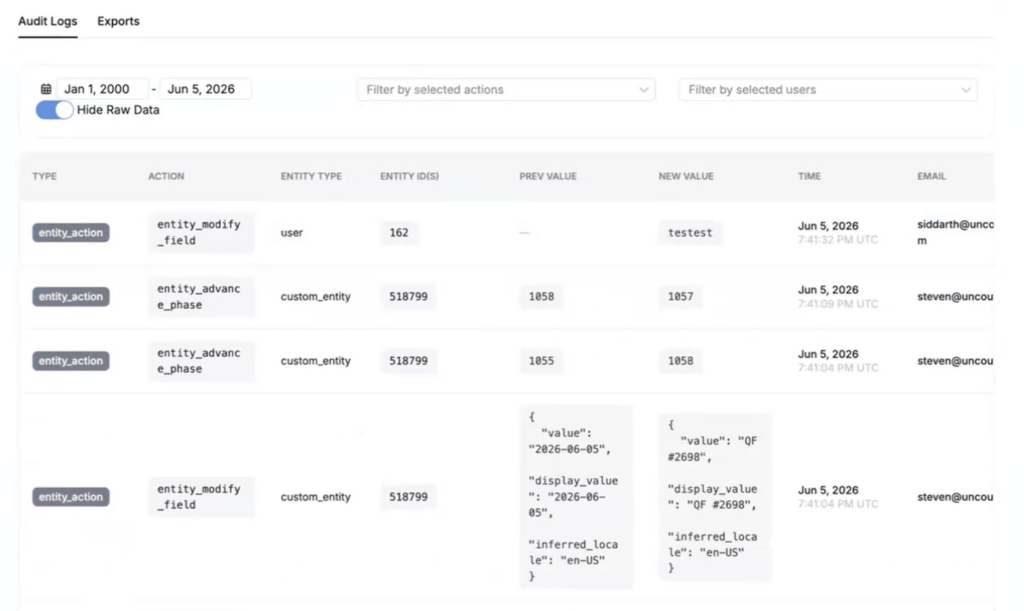
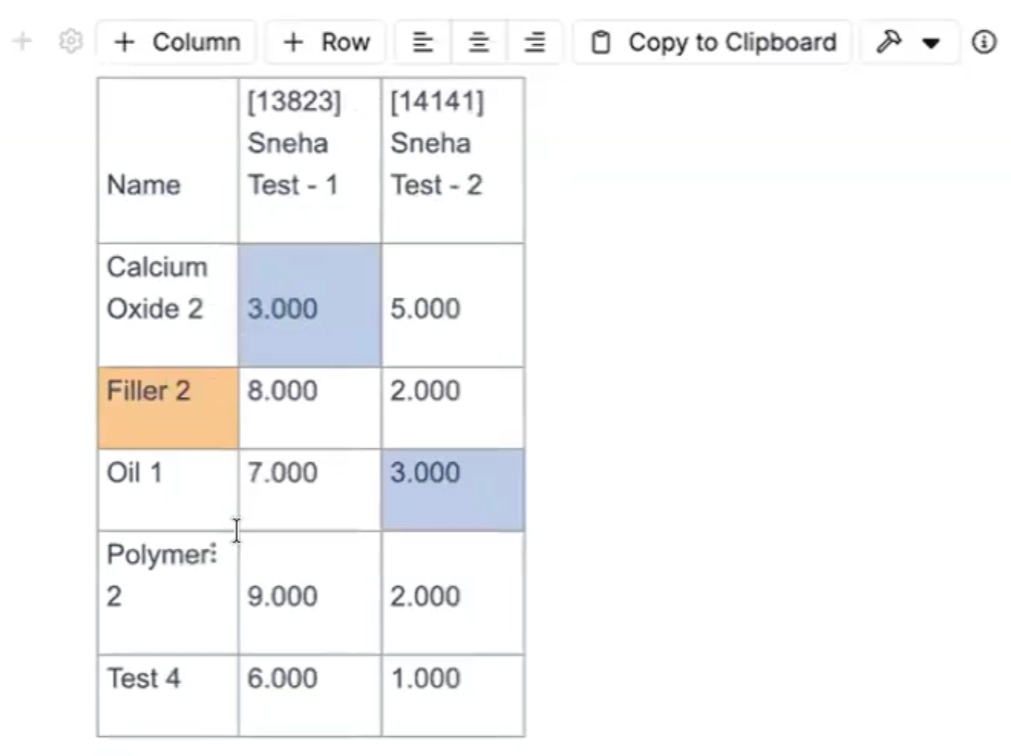
Table Builder: Conditional Background Color Formatting for Text Values
The Table Builder now supports regex-based background color formatting for text cell values, extending the conditional formatting that previously only applied to numeric data.
Previously, cell background colors in tables could only be set based on numeric scales. With this update, you can define regex pattern rules that automatically apply a background color to any cell whose value matches the specified pattern. This makes it straightforward to highlight statuses, flag specific terms, or visually differentiate categories in table outputs.
How to configure:
- Open a notebook table’s Table Builder.
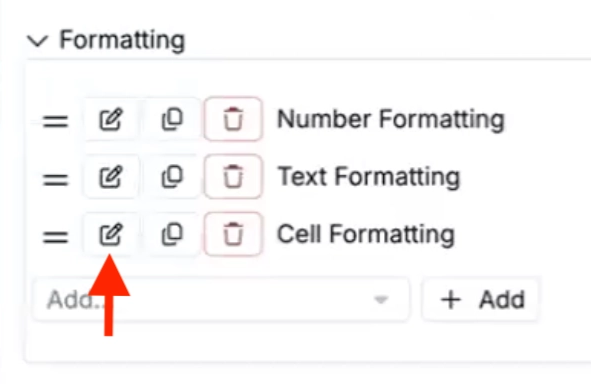
- Under Formatting, add Cell Formatting.
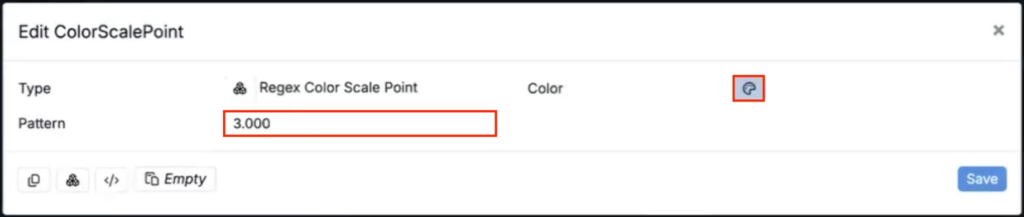
- Add Background Color formatting. Set Color type to Color Scale and points to Regex Color Scale Point.
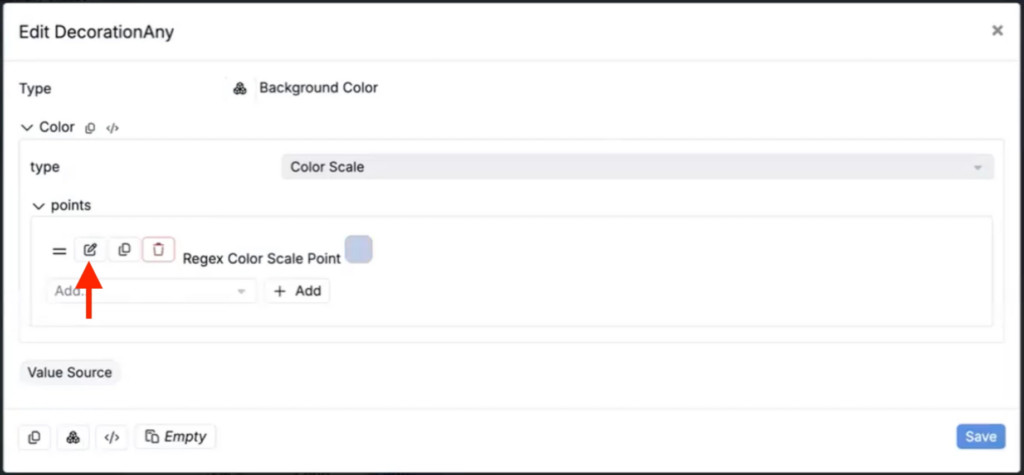
- Choose the background color and pattern.
- Save. Any cell matching the pattern will automatically display the configured background color.