Weighted Sum Calculations Without a Quantity Dependency
Weighted sum input calculations can now operate without using ingredient quantities as the base value. Previously, weighted sum calculations required a source (typically ingredient quantity), so ingredients without quantities were excluded.
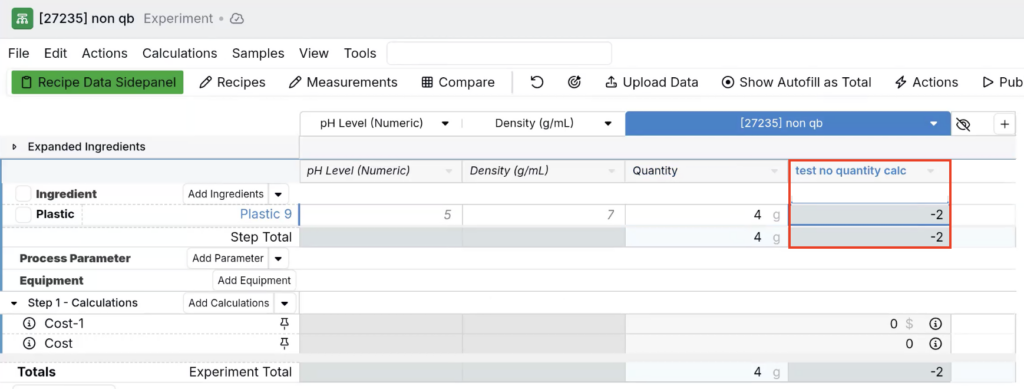
In the calculation settings, you can now choose a Source of No Source, which lets the calculation run even when ingredients don’t have quantities set.
This is useful when you want to build column calculations that reference ingredients (and attributes). For example, you can create a Weighted Sum column calculation that references ingredient attributes (like pH and Density) and calculates a value like pH – Density, without requiring ingredient quantities.
How to configure:
- Create (or edit) a Weighted Sum calculation.
- Under Source, select No Source.
- Configure the calculation equation (e.g. difference between pH and Density).
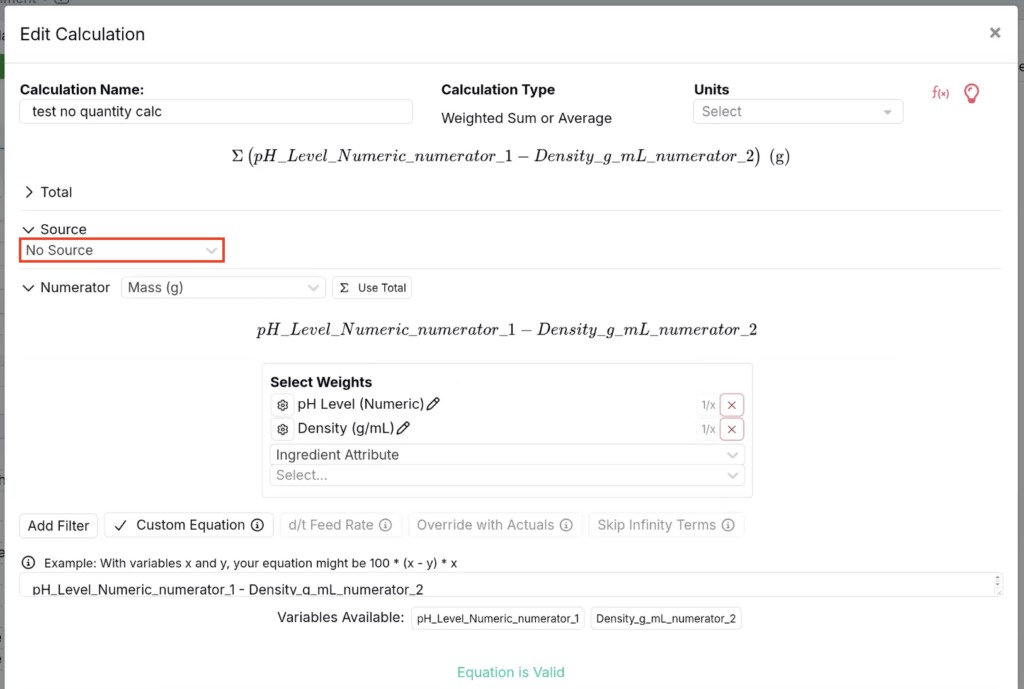
- Save the calculation — ingredients will be included even if they have no quantity set.
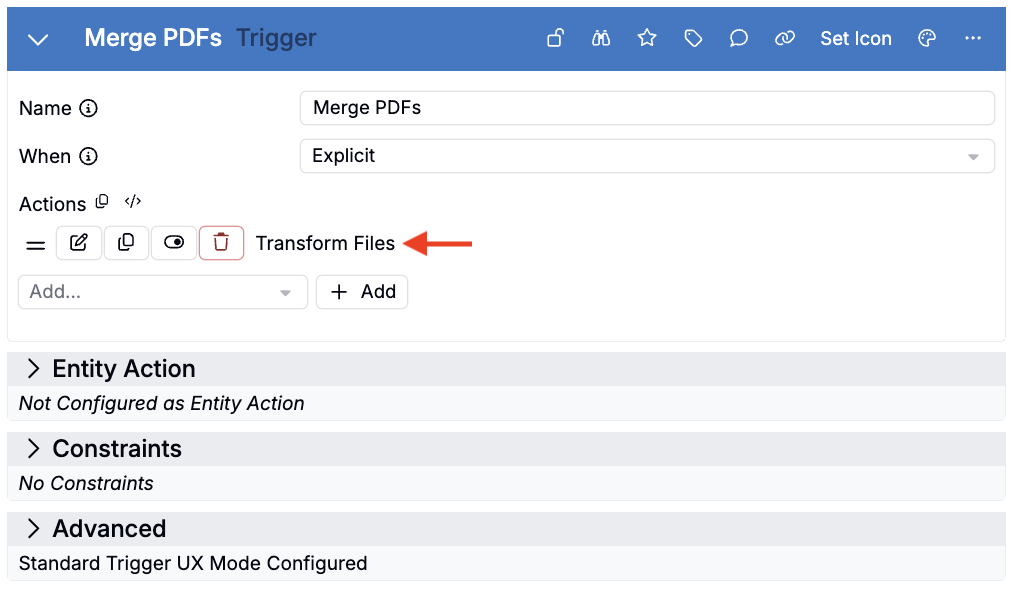
New Trigger Action: Transform Files
We’ve added a new trigger action, Transform Files, that can combine multiple PDFs into a single merged PDF. Teams can now use this trigger when multiple PDFs are generated or collected separately, but need to be delivered or stored as one packet.
For example, use this new trigger action to:
- Create a single COA/SDS packet per material or batch
- Merge multi-part test reports into one file for easier review and sharing
- Combine signed pages into a single final archival PDF
- Generate a complete handoff / customer deliverable packet automatically
How to configure
- Create a new trigger.
- Add a trigger name and set When to Explicit.
- Add a Transform Files trigger action.
- Click the 📝 icon to edit the trigger action.
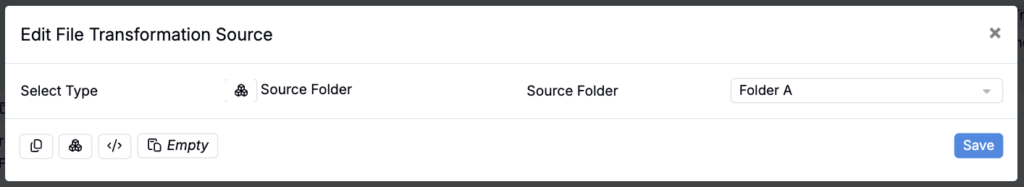
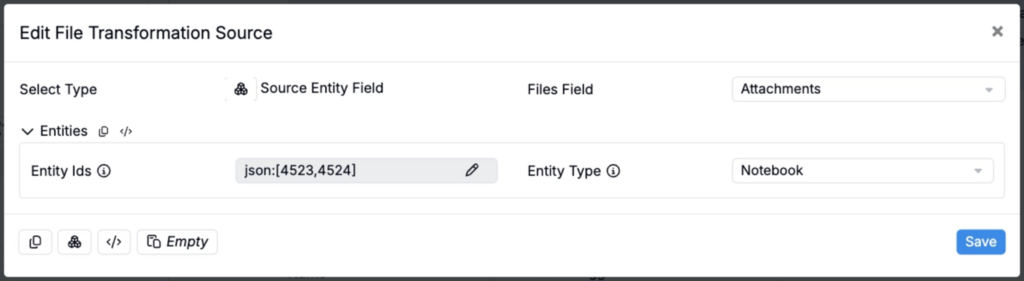
- Under File Sources, add one of the following:
- Source Entity FieldSource Folder
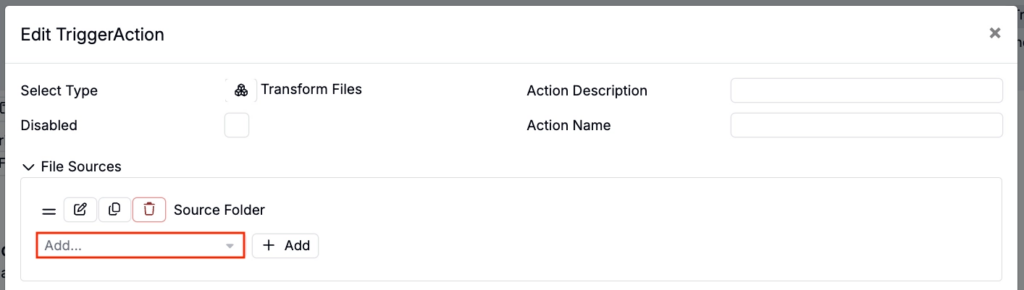
- If pulling PDFs from a Source Folder:
- Use the Source Folder field to select a folder to draw from.
- If pulling PDFs from a Source Entity Field:
- Use the Files Field to select an attachment field to draw from.
- Use the Entities section to specify the entity IDs and entity type.
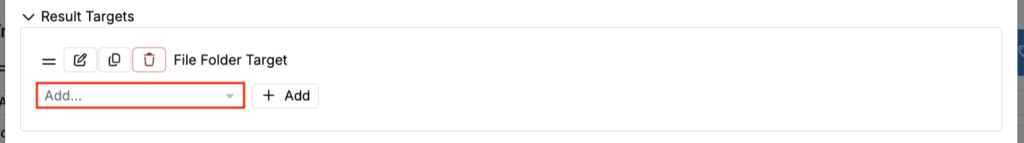
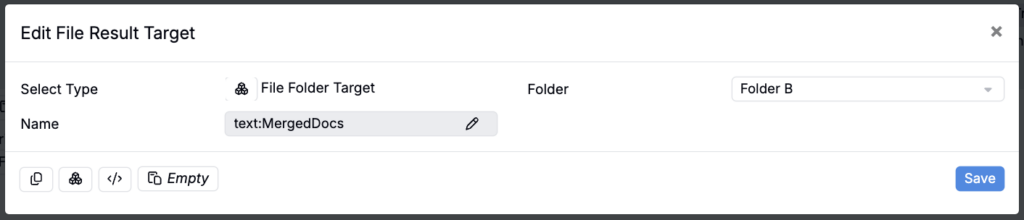
- Under Result Targets, select File Folder Target and choose the destination folder.
- Use the Folder field to select a target folder.
- Use the Name field to name the merged PDF.
- Under Transformation, select Merge PDFs.
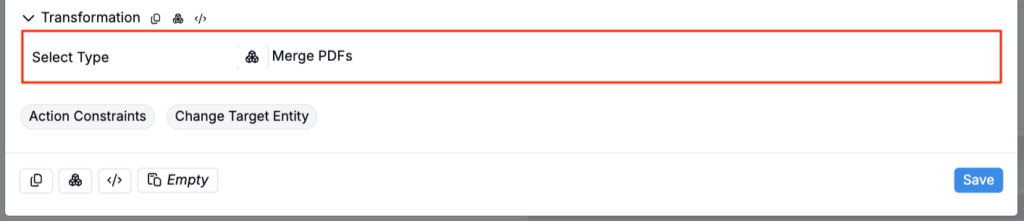
- Save, then execute the trigger. All PDFs from the selected source(s) will be merged into a single PDF in the target folder.
Combined Charts for Multi Y-Axis Visualizations
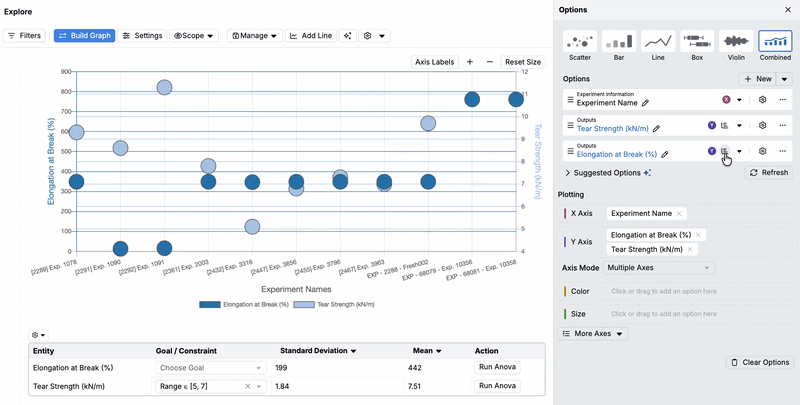
Support for combined charts on multi y-axis visualizations is now available in Explore Data. Multiple Y-axis series can be displayed together in a single chart, with each series shown using its own chart type (scatter, bar, or line).
Previously, to compare multiple Y-axis series side by side, you needed to create multiple separate plots, making it harder to compare related metrics. With combined charts, you can overlay multiple series on the same chart for faster, more direct comparisons.
How to use:
- Open Explore Data and create (or open) a multi y-axis chart.
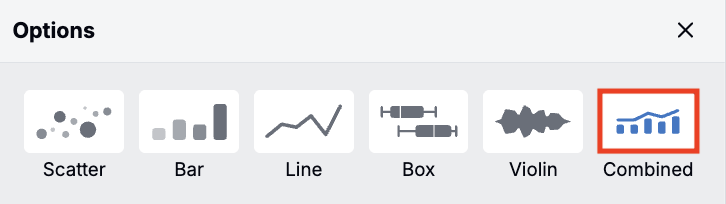
- Select the Combined plot type.
- For each Y-axis series, click the chart icon and choose scatter, bar, or line.
Availability:
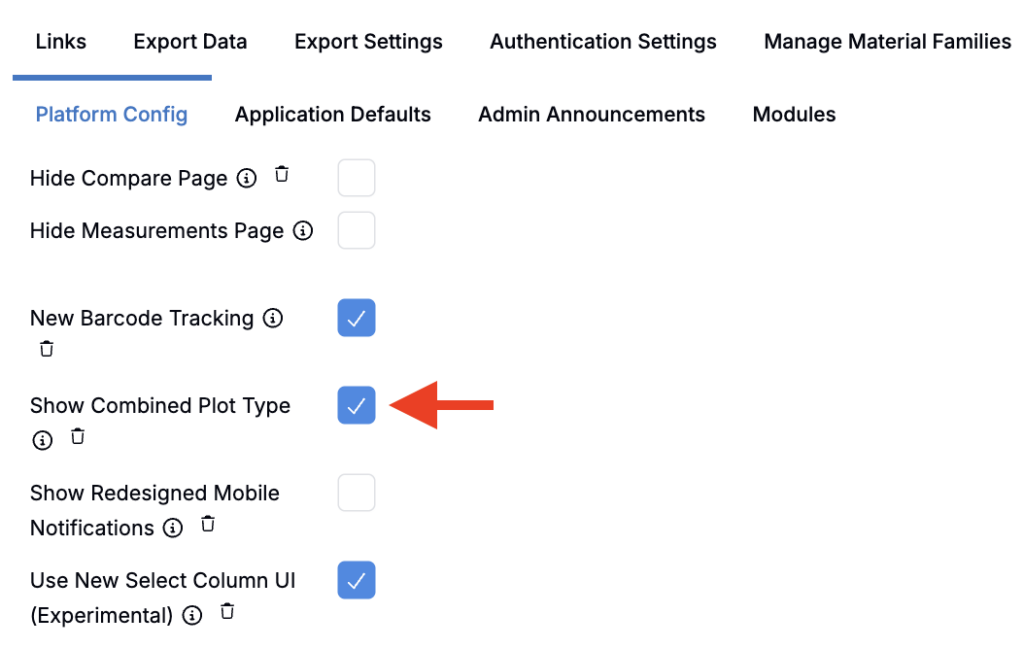
This feature is currently must be enabled by toggling on Show Combined Plot Type in Company-Wide Settings > Platform Config. In the next few weeks, the flag will be removed and support for Combined plot types will be enabled by default.
To learn more, refer to Combined Charts for Multi Y-Axis Visualizations.
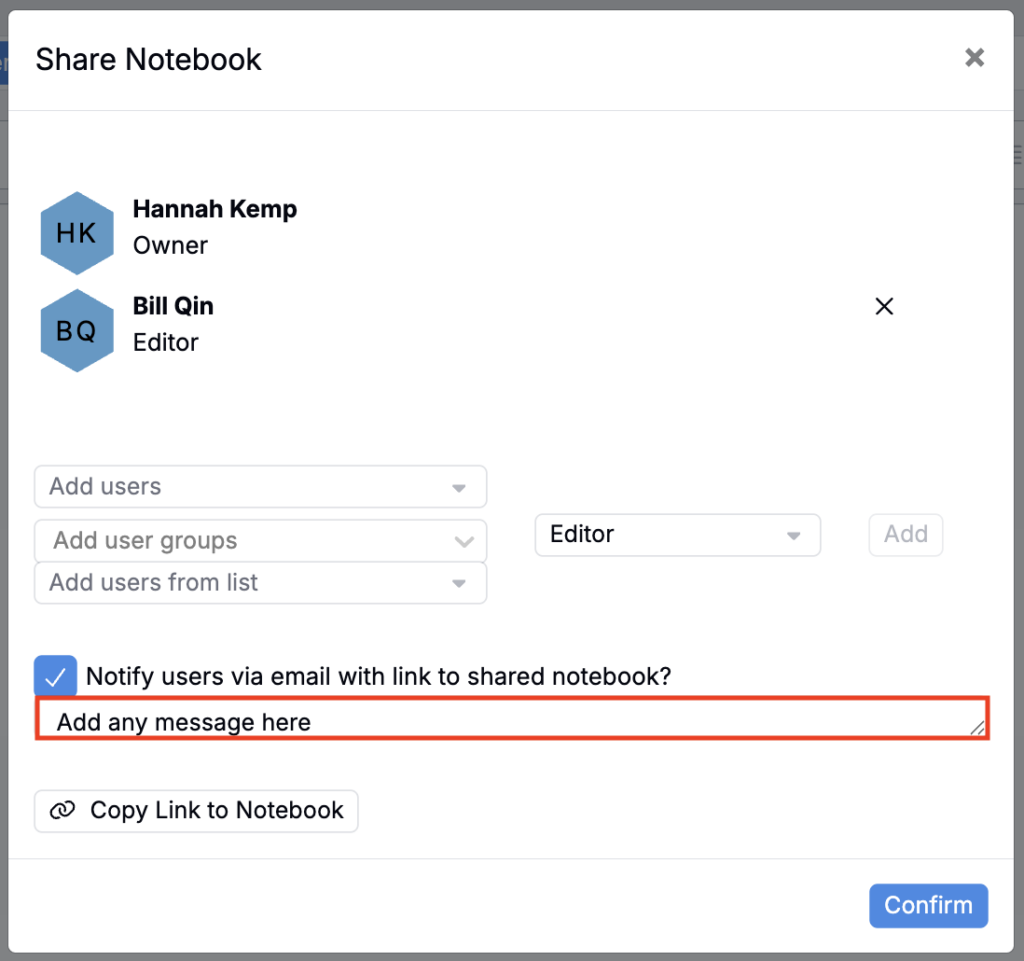
Share a Notebook with a Custom Message
Sharing a notebook now supports adding a custom message that will be sent along with the share notification.
Previously, recipients would receive the standard share email with no additional context. With this update, you can add a short note (for example: what changed, what you’d like reviewed, or any deadlines) so teammates understand what to do next.
How to share with a message:
- Open the notebook you want to share.
- Click Share.
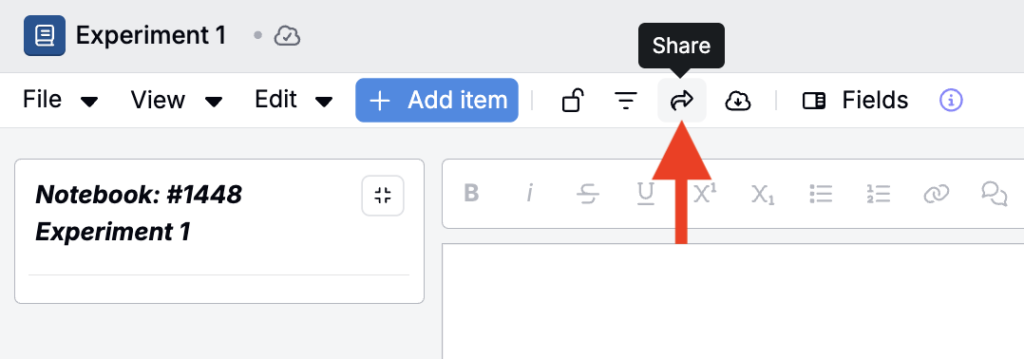
- In the modal, add recipients and set their access (e.g., Editor).
- Enter a message in the Message field.
- Click Confirm to share — your message will appear in the email notification sent to recipients.
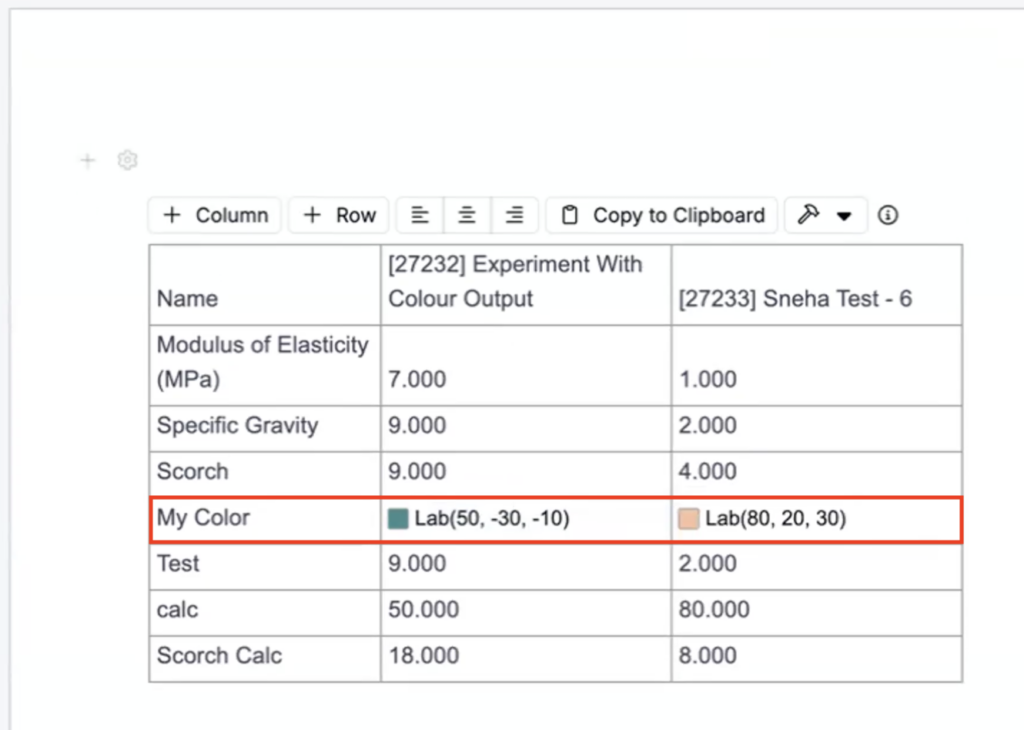
Color (L/a/b) Swatches in Notebook Comparison Tables
Notebook comparison tables now display color swatches inline for any color output. Instead of showing raw color coordinates as text, the table renders a colored preview chip alongside the value.
Teams working with color-matching formulations often compare color outputs across experiments. Previously, comparing values like “Lab(50, -30, -10)” required translation to understand what color was actually represented. The inline swatches make it immediately apparent whether two experiments are visually close or far apart, speeding up formulation review.
Configurable Action Bar Constraints
The Configure Actions panel now supports action bar item constraints. Visibility conditions can be attached to individual action buttons — for example, showing a button only when the current user is assigned, or only when a specific field value matches a condition.
Previously, all action bar buttons were always visible to all users, which could lead to cluttered toolbars and occasional mis-clicks on actions not relevant to the current user’s role. Constraints let you set unique default buttons per role or workflow state, so each user sees only the actions relevant to them.
How to configure an action constraint:
- On a recipe or experiment, open the Configure Actions panel from the top-right toolbar.
- Select or add any action button in the list.
- Use the Constraints field to select a Visible constraint.
- In the modal, select a Condition Type (e.g. adding Workflow Phase Match constraint on a Visualization action).
- Add your constraint conditions (e.g. only visible when the experiment’s phase is “Ultimate”).
- Click Save.
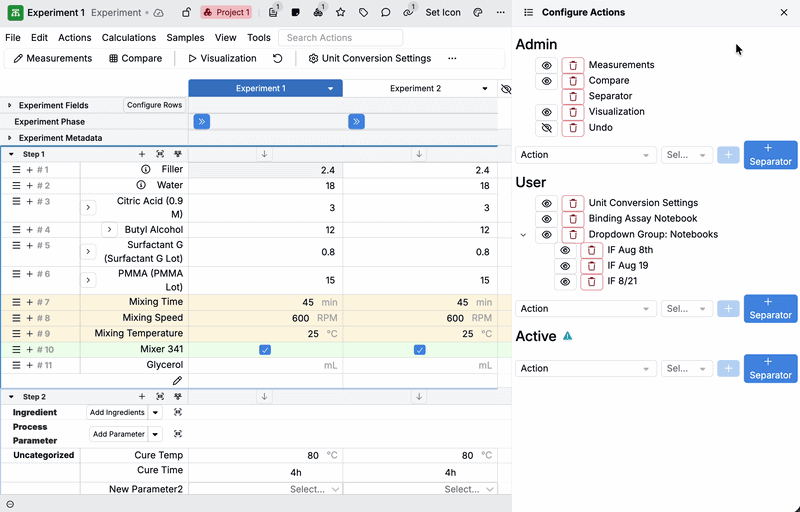
Once saved, an action button will appear only when its constraint conditions are met.
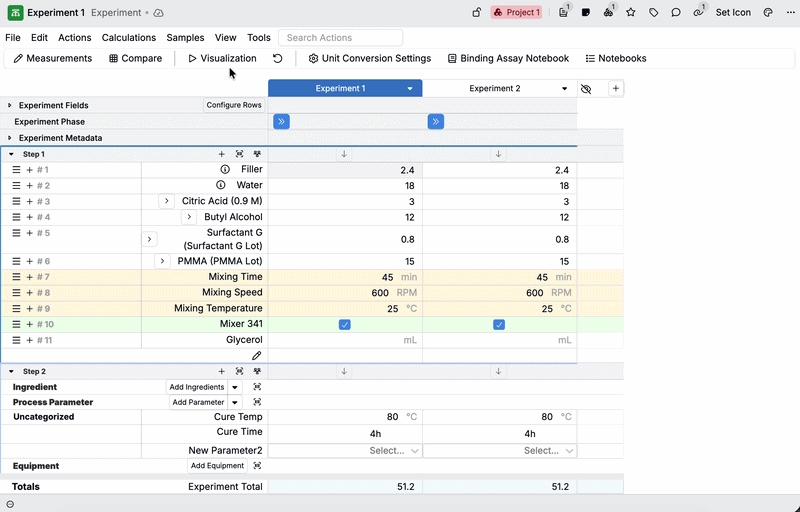
In the example below, Experiment 1 is in phase “Ultimate” and Experiment 2 is in phase “Primary”. When Experiment 1 is active, the Visualizations action appears in the toolbar; when Experiment 2 is active, the Visualizations action is not visible
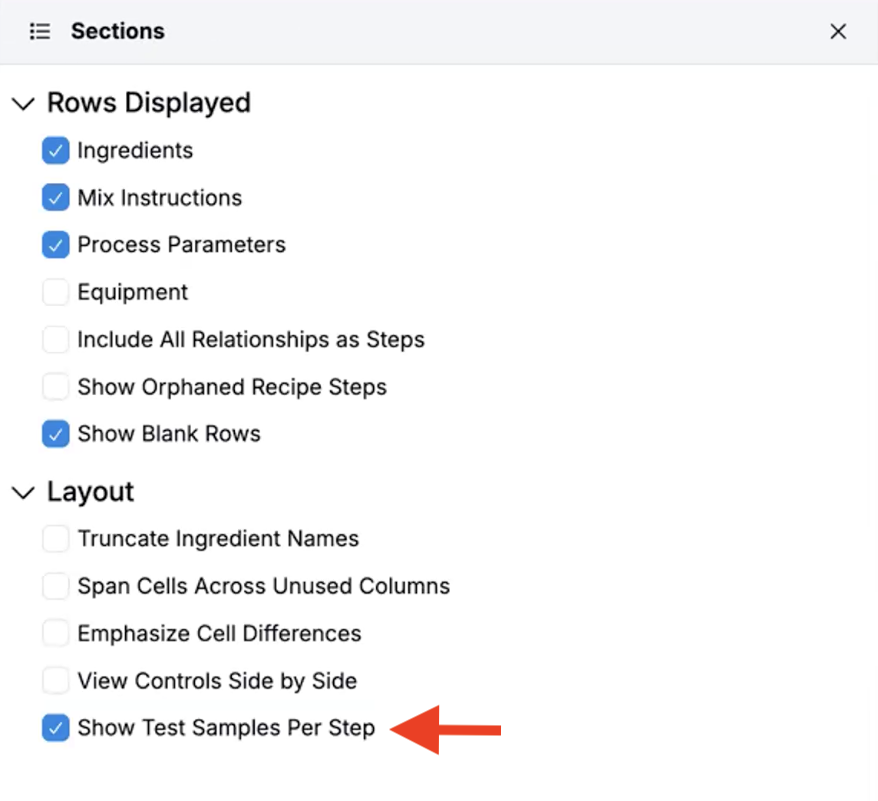
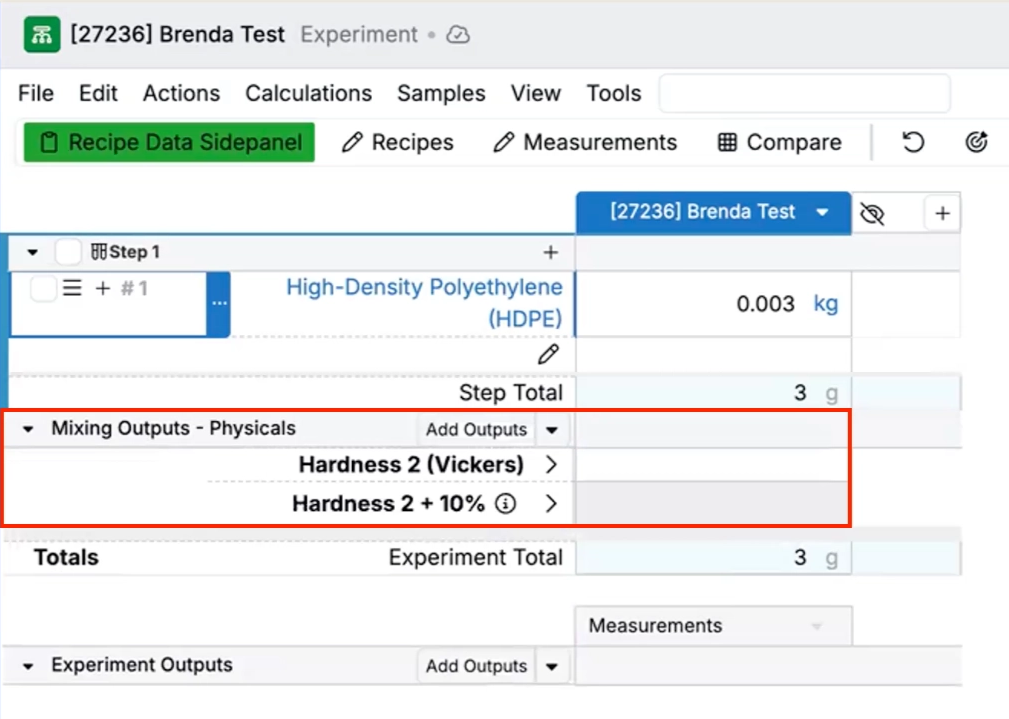
Workflow Steps: Show Test Samples per Step (Meshed Test Samples)
An early version of a new recipe layout option now connects workflow steps with test samples on the Recipe view of experiments. When enabled, test samples can be created and viewed directly below the workflow step they belong to, making it easier to track which samples were taken at each step as you work through a recipe.
We added this because teams often take multiple samples throughout a procedure (e.g., after mix, cure, or aging), and those samples used to live on only the Measurements view. Putting samples directly under each step keeps sampling context with the procedure, improving traceability and reducing missed samples.
How to enable:
- Open any recipe.
- Open the Sections sidepanel.
- Under Layout, toggle on Show test samples per step.
- Once added, click into the workflow step header and select Create Test Sample from the menu.
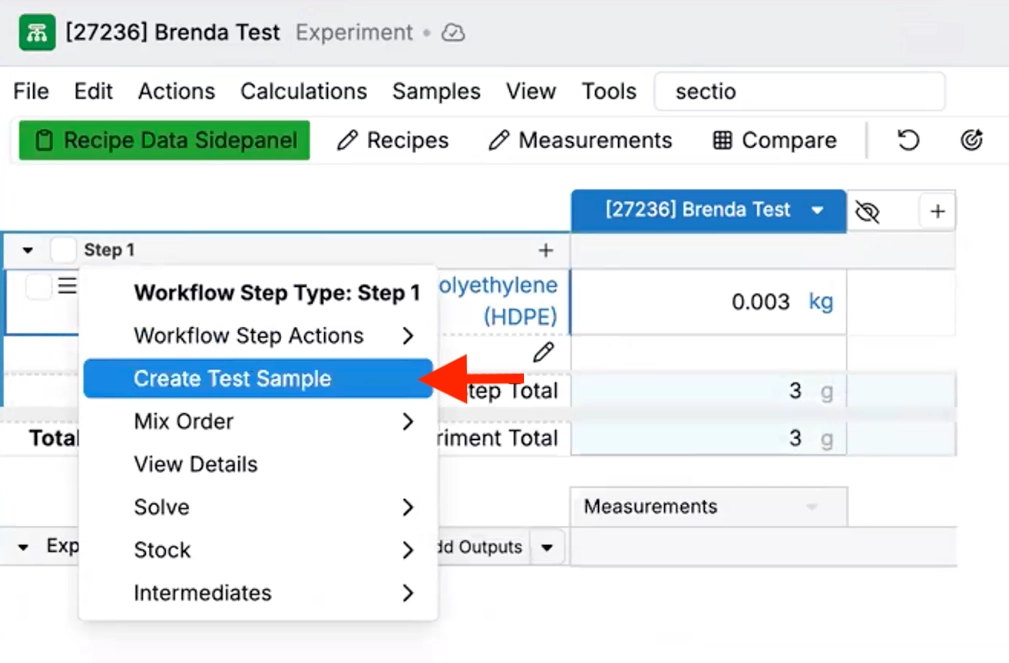
- The test sample will appear below the workflow step. Click Add Outputs to add measurements to the test sample.
Event Log: Phase Diagram View
Event Logs now includes a dedicated Phase Events tab that visualizes phase-related events as a Phase Diagram (plus a time-in-phase breakdown table). The diagram shows phases as nodes and transitions as connecting edges, with each transition labeled with who made the change and when.
Phase transition history used to be buried in raw audit logs. With the new diagram, phase movement is presented as a clear timeline — and the table below shows exact timestamps and time spent in each phase — making bottlenecks and stalled handoffs much easier to spot. If a record has no workflow phases (or no transitions yet), the diagram is hidden.
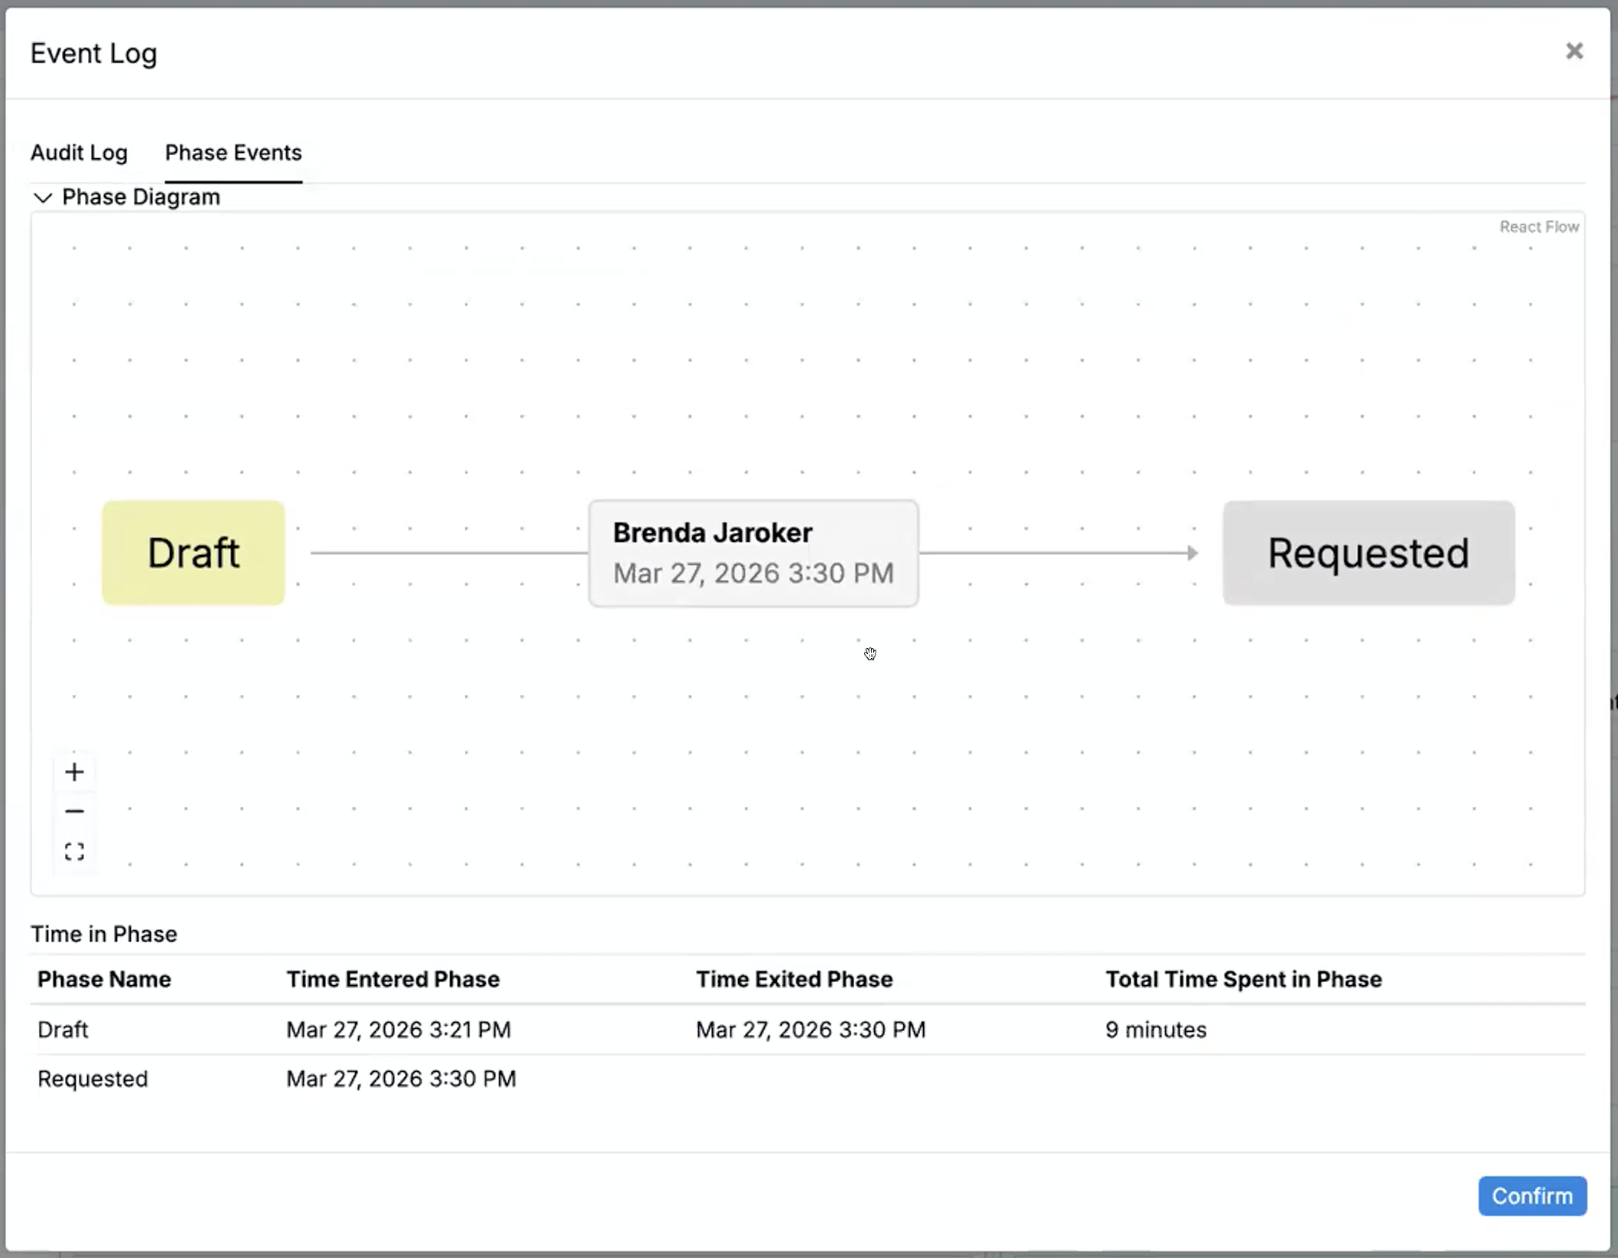
How to view the Phase Diagram:
- Open any record that participates in a phase workflow (e.g. a task).
- Option the Event Log (Options > Event Log).
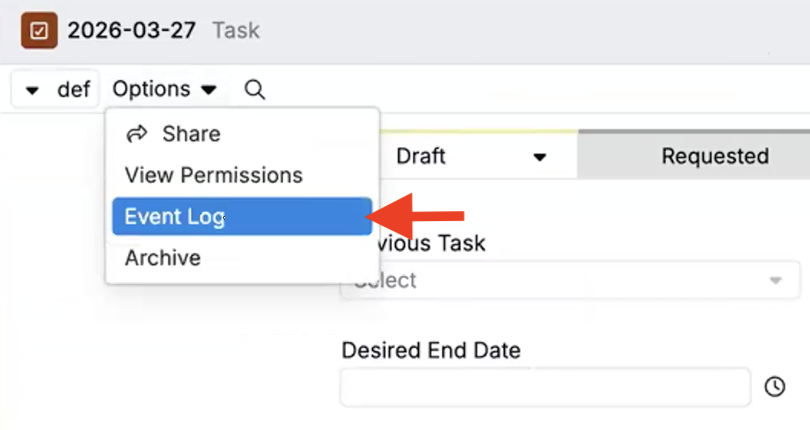
- Select the Phase Events tab.
- Review the visual phase diagram for the transition history, and the table below for exact timestamps and duration in each phase.

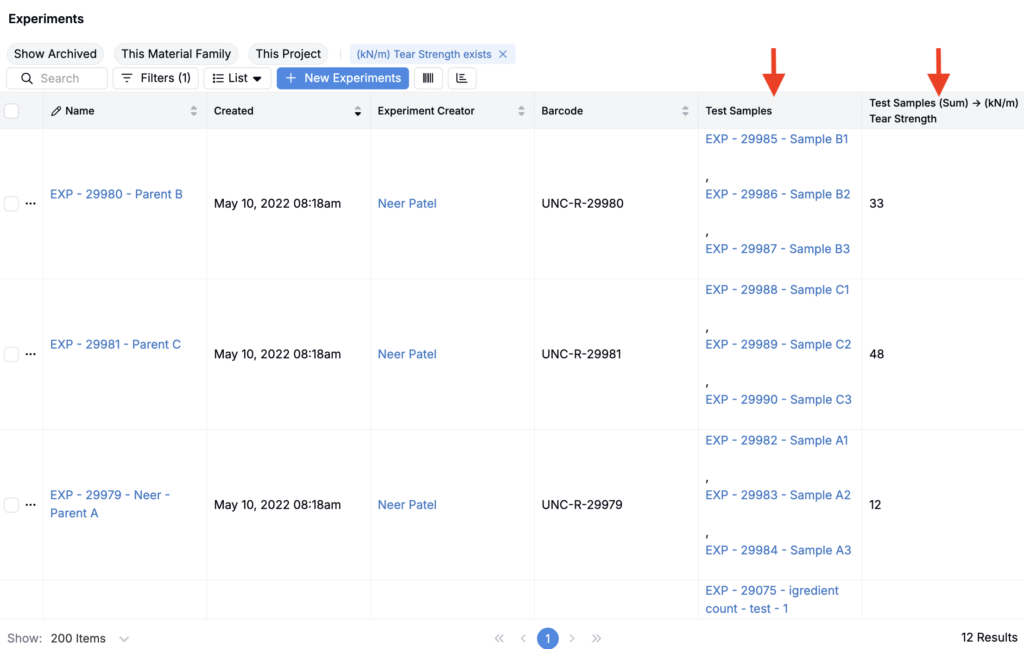
Output Filters Across Test Samples and Component Experiments
Experiment listing filters on experiment outputs can now evaluate outputs captured on test samples and component recipes — not just outputs recorded on the parent experiment.
When you add an experiment output filter, use the Included Outputs section to specify where to look: Experiment, Component Experiment, and/or Test Samples. The listing will return the parent experiment associated with any matching component experiment or test sample containing the output.
This makes it easier to find experiments based on results that were captured downstream (for example, on a sampling step or a sub-recipe), without manually opening each experiment to check related records. Common use cases include spotting experiments where a specific test sample measurement is out of spec, or finding all parent experiments whose component recipe produced a target output range.
How to use:
- Go to the Experiments listing.
- Add an experiment outputs filter.
- Expand Included Outputs and select Experiment, Component Experiments, and/or Test Samples to search across those output types.
- Use the Depth field to select the level of depth to search (e.g. Depth 1/Children, Depth 2/Grandchildren).
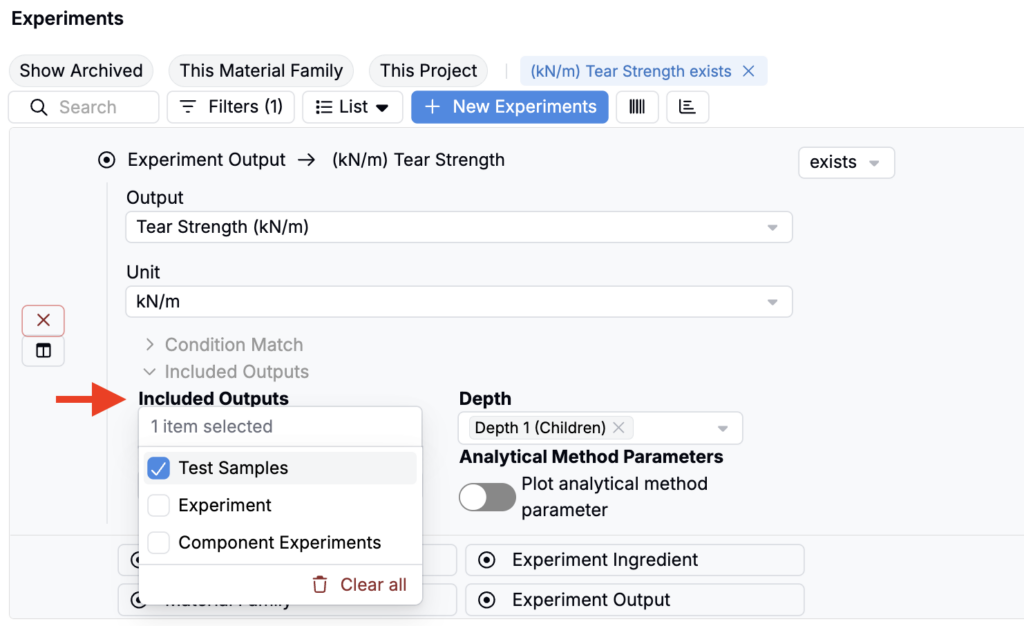
- The listing will update to show experiments that have matching outputs in the selected scope.
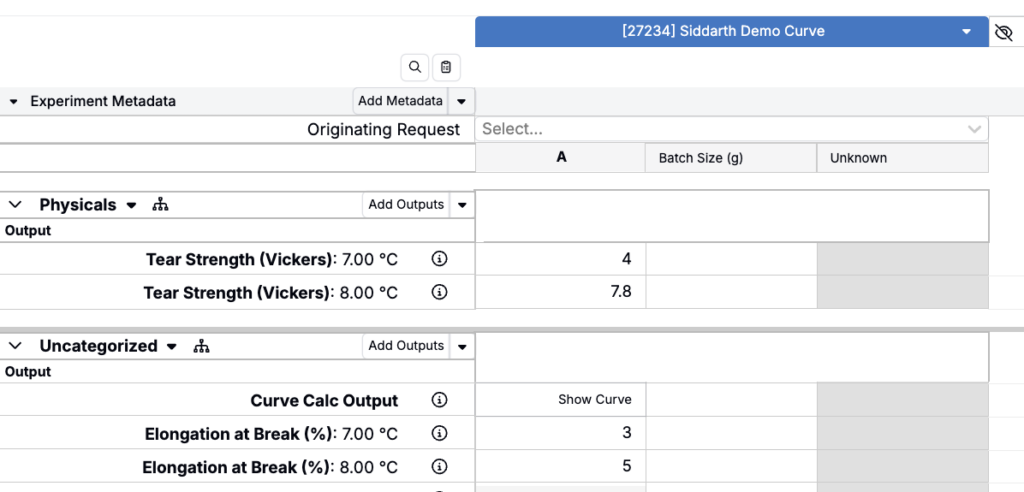
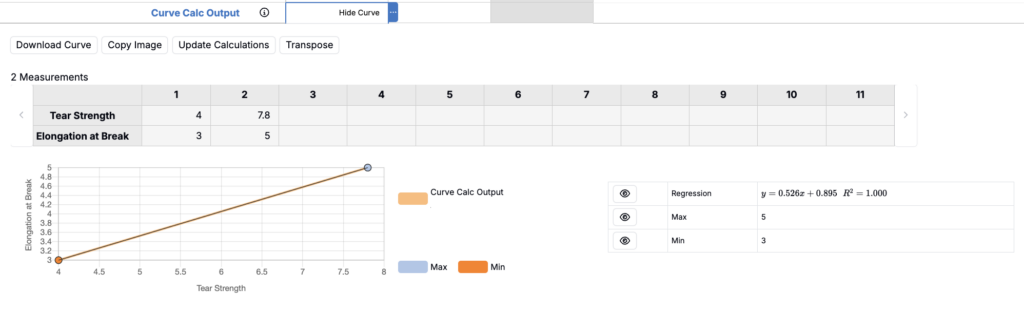
Output-vs-Output Curves
Recipes now support a new curve calculation type that builds an output-vs-output curve by combining two measured outputs.
Instead of plotting an output over run number, a condition parameter, or a process parameter, you can choose two outputs from your experiment and generate a curve where both the X-axis and Y-axis are outputs. Points are joined by a shared condition parameter or process parameter, so repeated condition values are consolidated into a single (X, Y) point.
For example, if you have an experiment measuring Tear Strength and Elongation at Break at different aging temperatures, you can create a curve comparing tear strength (Y) versus elongation (X), with points joined by temperature so each temperature maps to one point on the curve.
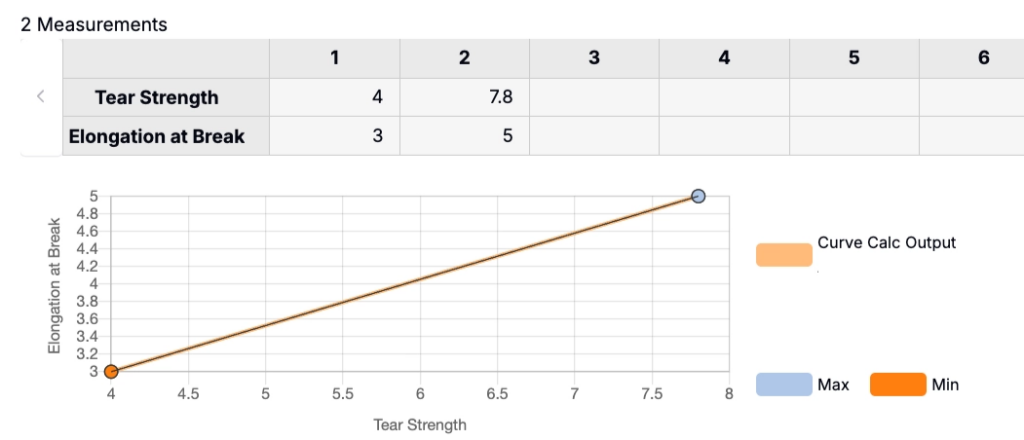
This was added to support workflows where you need to visualize and quantify relationships between two outcomes. It’s especially useful when replicates or repeated condition values should be consolidated into a single point for analysis.
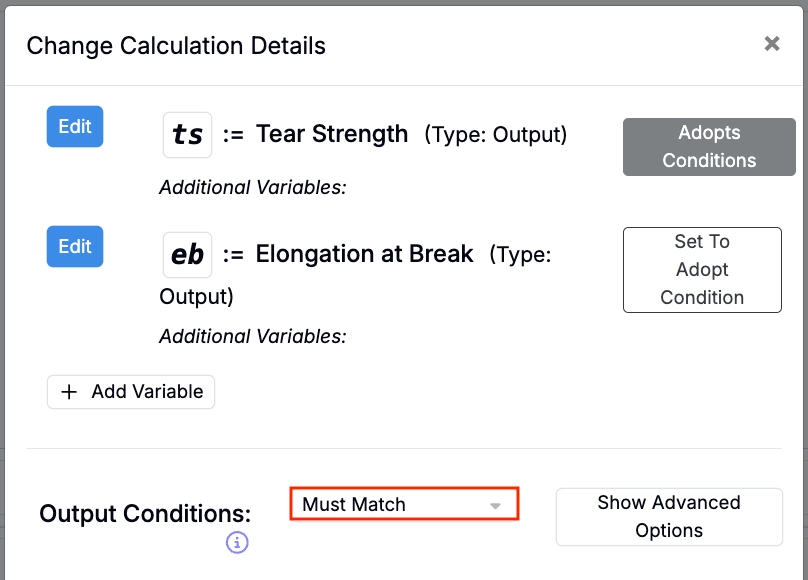
How to add a curve calculation:
- Create a new Curve type calculation.
- Add the type outputs you want to plot as variables (e.g. Tear Strength and Elongation at Break).
- Set Output Conditions to Must Match.
- In the Curve Concatenation tab, set X Axis Source to Output and select the output you want to plot on the X-axis.
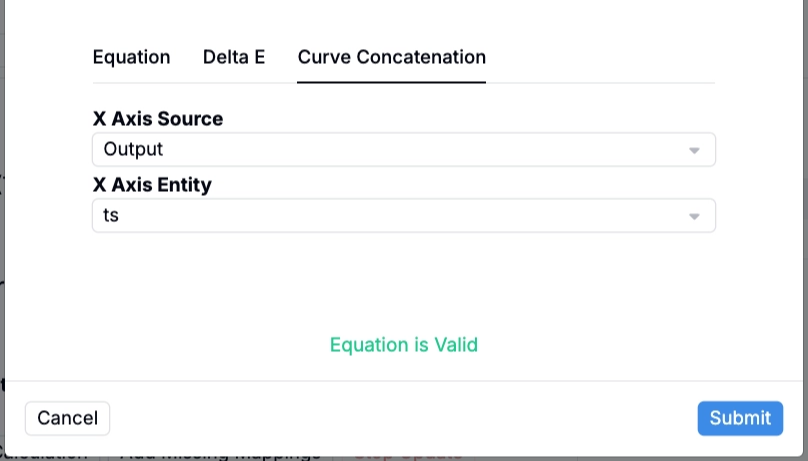
- Click Submit. The curve output and regression plot will appear in the recipe view.
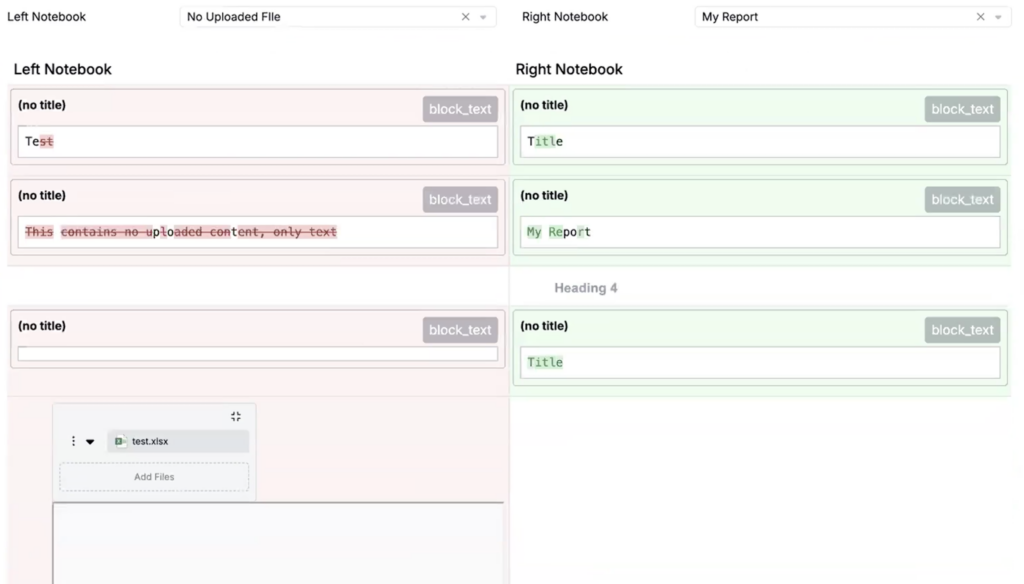
Notebook Diff: Side-by-Side Comparison Field
A new group type, Notebook Diff, can now be added to task or entity forms. It renders two notebooks side by side so reviewers can compare versions directly within a task without opening separate tabs.
Design reviews and formulation sign-offs often require comparing the current notebook version against a prior snapshot. Previously this meant opening two separate notebooks and toggling between tabs. The Notebook Diff field embeds both notebooks inline on entities so reviewers can scan changes in context without leaving the entity page.
How to configure the Notebook Diff field:
- Navigate to the definition of the entity you want to add the Notebook Diff to.
- Add a new group to the definition.
- Set the field Type to Notebook Diff.
- Configure the Left Notebook Field and Right Notebook Field to point to the notebook fields you want to compare.
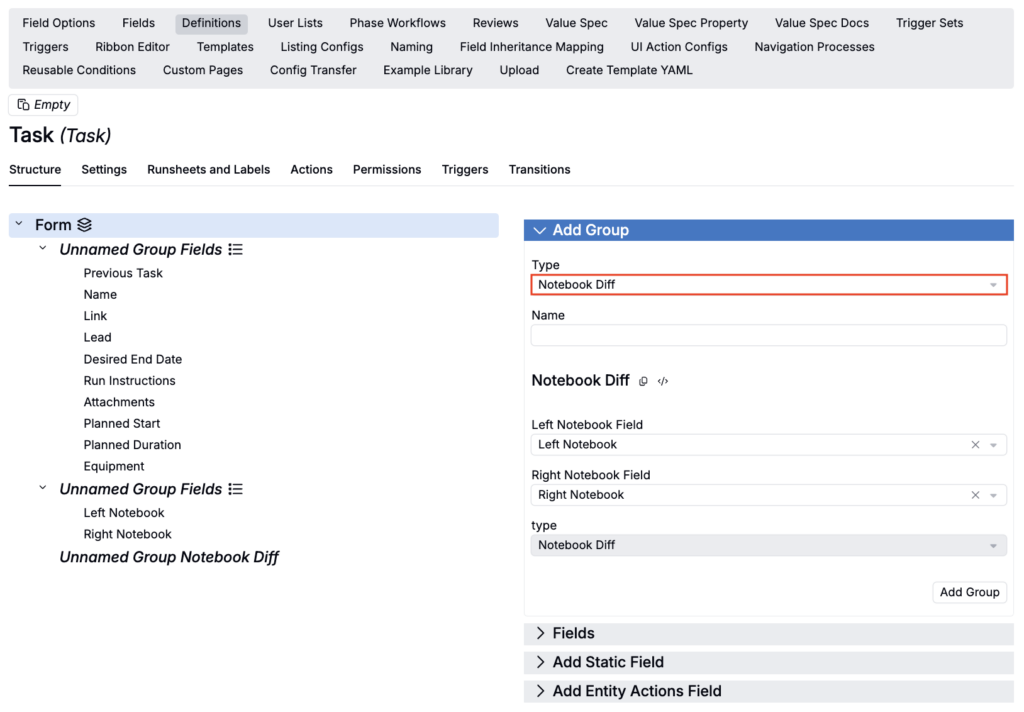
The Notebook Diff group will now appear on all new entity forms. Use the Left and Right Notebook selection fields to render notebooks side-by-side.
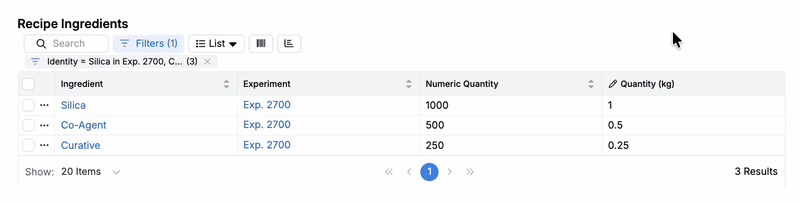
New Column Type: Calculated Quantity Columns
We’ve introduced a new Recipe Ingredient listing column type: Calculated Quantity.
This column type allows you to add calculation-based columns directly to recipe ingredient listings. Values entered in these columns automatically update the corresponding values in the Quantity column in real time.
A common use case is adding Basis Calculation columns. For example, you can add a kg basis column and input values in kilograms — no manual conversion required. This improves formulation efficiency by eliminating the need to manually convert between units, reducing errors and saving time when scaling recipes across different batch sizes.
This feature is currently available only in schemas with the new column selection UI enabled. To enable it, toggle on Use New Select Columns UI (Experimental) in Company-Wide Settings > Platform Config.
How to configure:
On any listing with a base recipe_ingredient base:
- Edit table columns (List > Set Column).
- In the modal, select Calculated Quantity.
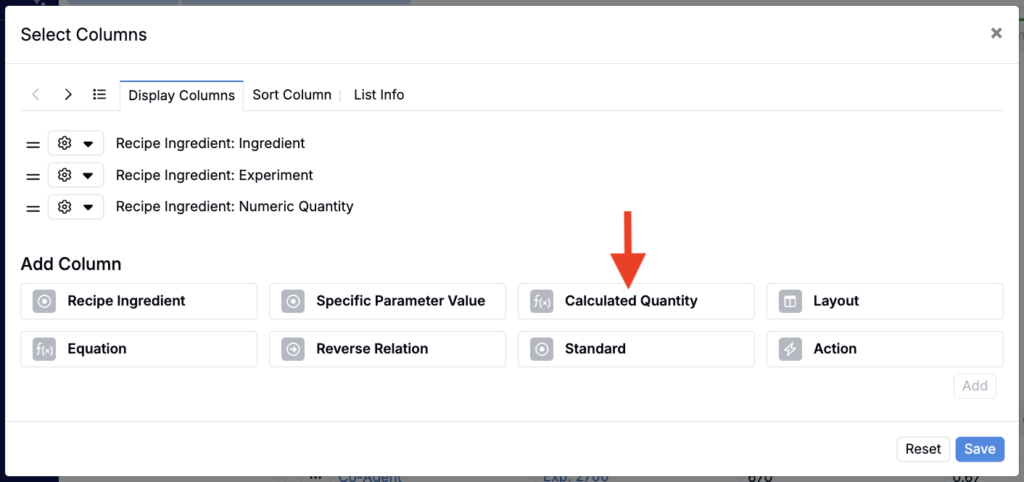
- Select the Basis Calculation (e.g. kg).
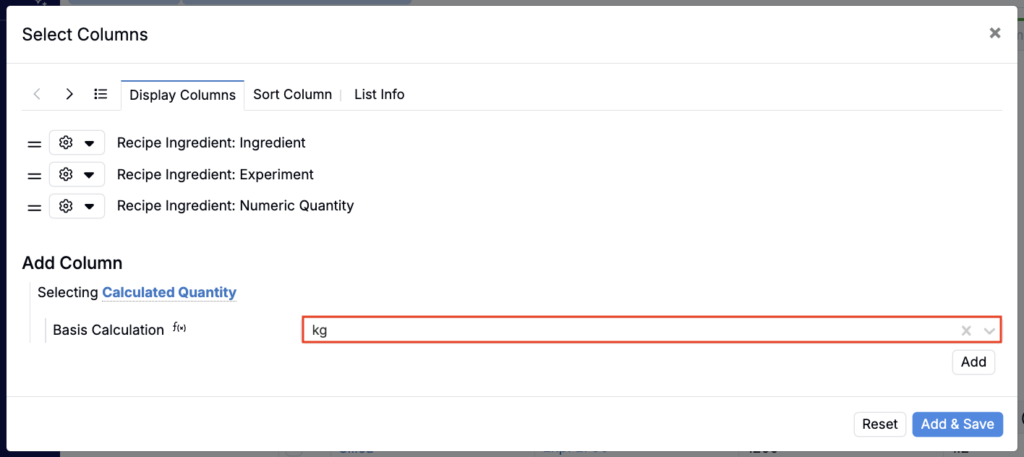
- Add and save.
Once added, editing values in the Calculated Quantity column will update corresponding values in Quantity column and vice versa.
New Excel Export (beta) for Listings
We’ve added a new Excel export option to listings. You’ll find it in the listing controls dropdown under Export > Excel (beta).
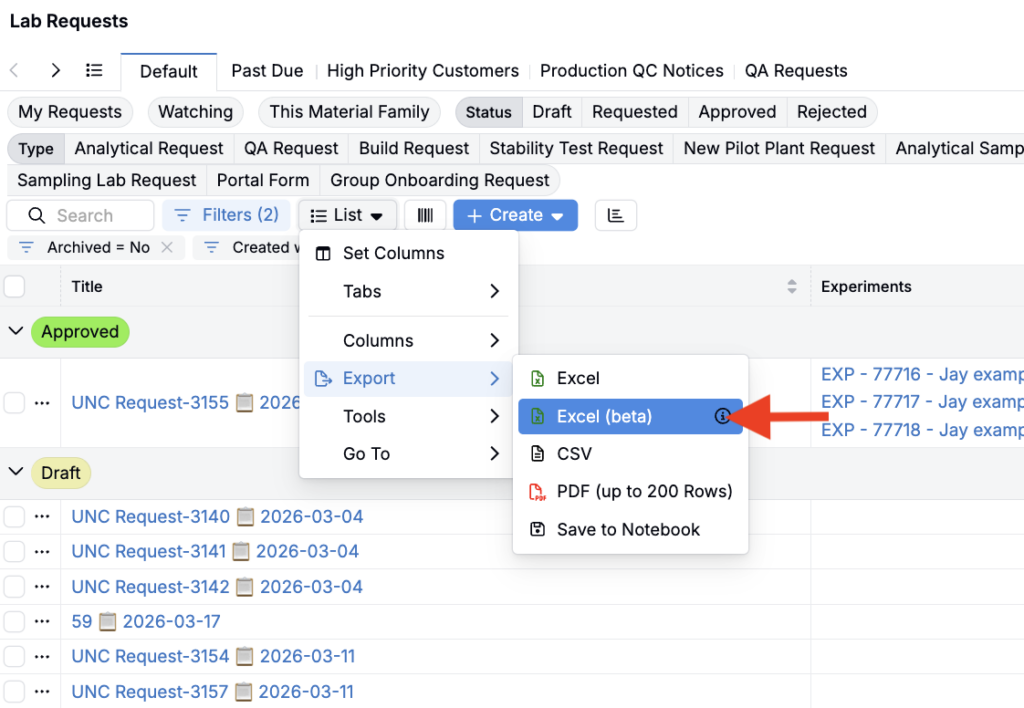
The main improvement over the existing export is support for row grouping. If you have grouping columns configured on your listing, the Excel export previously did not include group headers, so grouped listings were exported as a flat list of rows that was harder to scan and summarize.
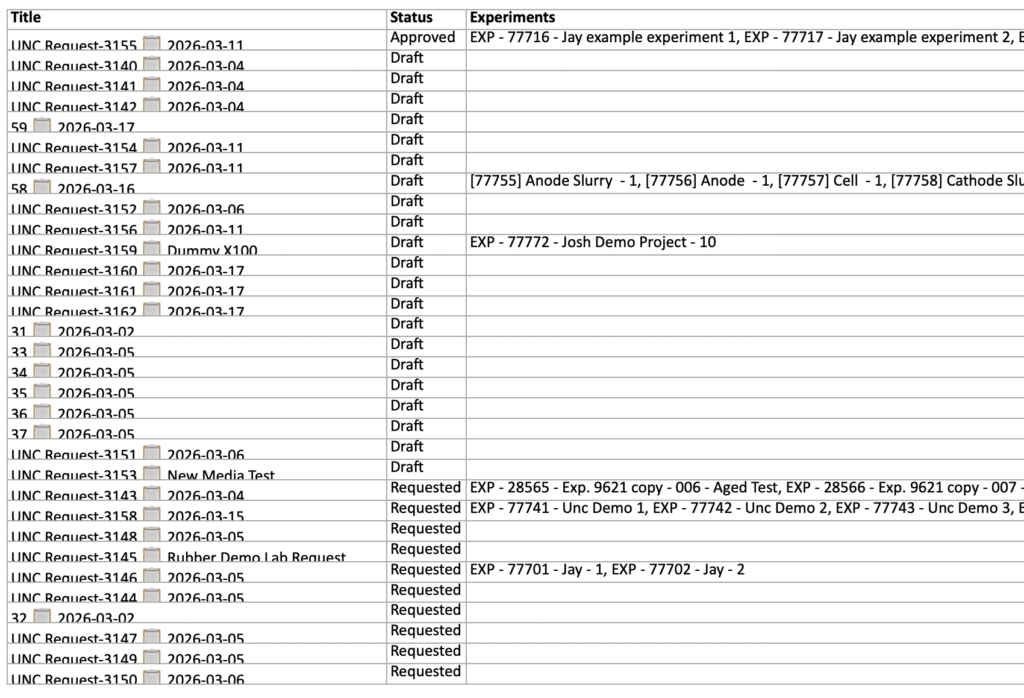
With the new export method, group header rows are included so the data is organized the same way you see it on screen.
This export runs asynchronously, like the current one. It saves to the Exports folder and notifies you when it’s done. While currently in beta, but this method will fully replace the current export process by next week.
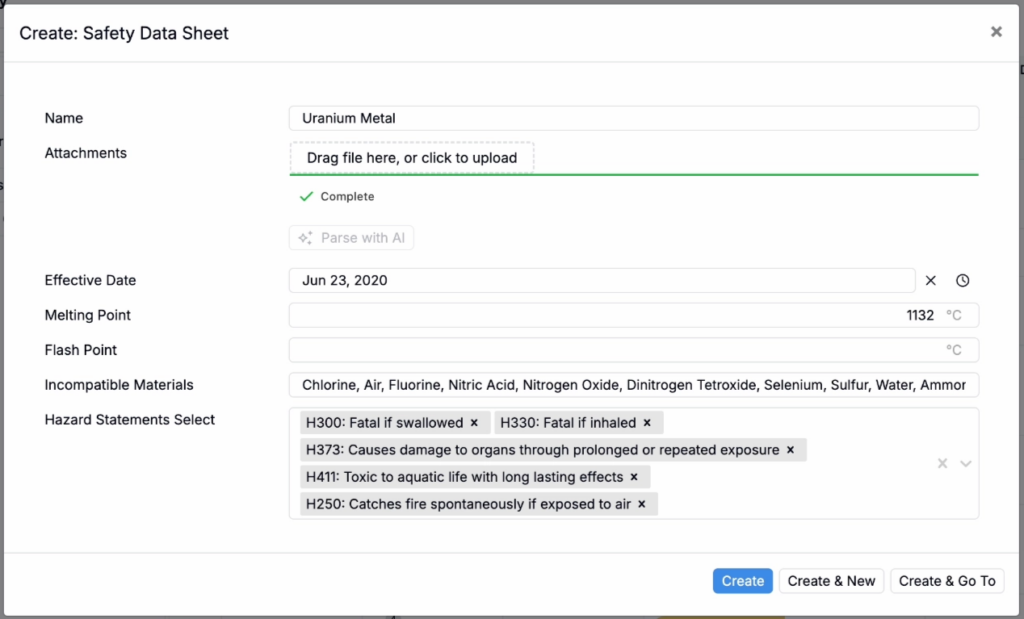
Parse with AI: Populate Entity Fields from a PDF
Uncountable users with Gen AI enabled within their schema can now use AI to automatically populate an entity from a PDF attachment. This works with most field types, including dates, single select, and multi-select.
To use it, add an Attachments field to the entity type you want to populate. Then, when creating a new entity from the listing page, click Parse with AI under the Attachments field in the Create modal. You can optionally add instructions, such as which sections to prioritize, and then start parsing.
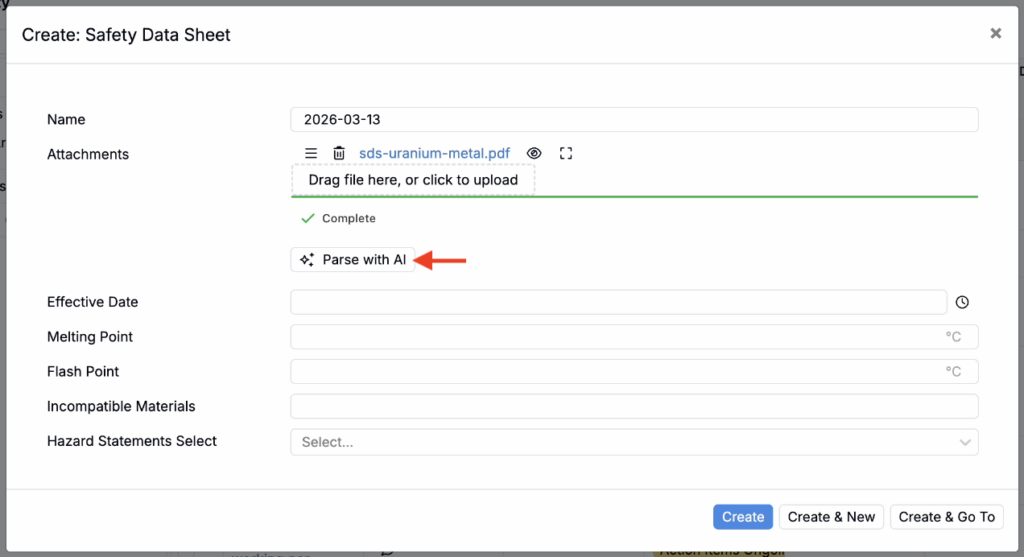
For example, you can use Parse with AI when uploading new Safety Data Sheets. The parser reads the attached file and fills in key fields like effective date, incompatible materials, and hazard statements.
Parse with AI was introduced to speed up workflows that already rely on PDFs, such as Safety Data Sheets (SDS), Technical Data Sheets (TDS), Certifications of Analysis, (COAs), and other vendor or compliance documents. By turning a PDF into structured fields at creation time, teams can reduce repetitive work and move faster through day-to-day intake.
To learn more, refer to Gen AI: Parse with AI.
Pivot Group Suggestion Strategies
Pivot groups over transitive aggregates now support Suggestion Strategies, which control how pivot columns are suggested. You can add filters to limit which values are considered, and optionally choose a sort column and direction to determine the order the pivot columns appear.
We added this because pivot column selection used to be static, but many workflows need pivots to stay in sync as underlying entities change. For example, if a pivot groups by test samples in an experiment, newly added test samples can automatically appear as pivot columns after a refresh, without rebuilding the pivot.
How to use suggestion strategies:
- Edit the pivot group.
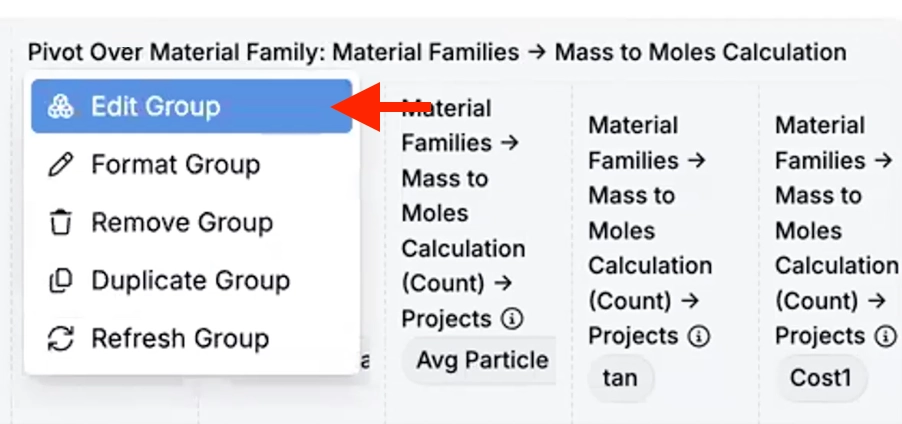
- Under Suggestion Strategies, adjust filters and add sorts.
- Click Refresh Group.
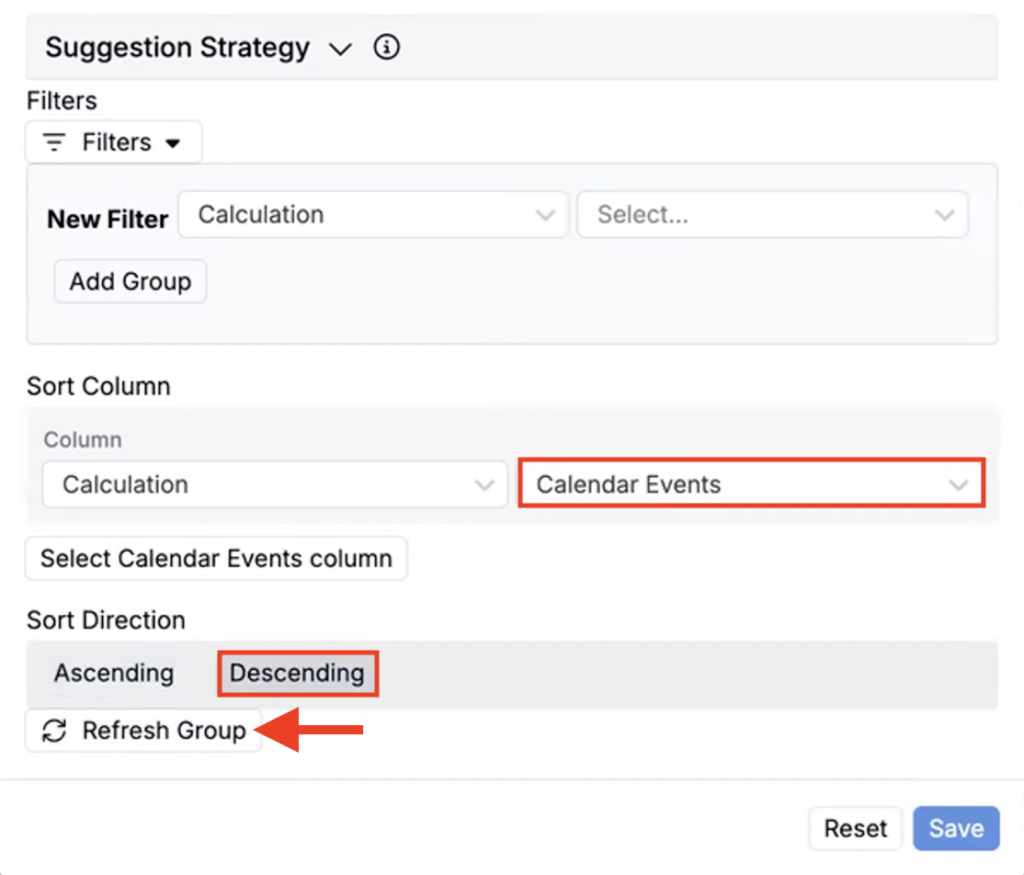
- Updated columns will now appear in the Columns section.
- Click Save. Your pivot group will now be updated to include the columns suggested.
Excel-Type Formulas Now Persist Across Refresh
Excel-style formulas entered in the Recipe or Measurements data table now persist across refresh. Previously, the result would persist after refreshing, but the underlying formula was hidden, and dependent changes would not cascade the way they do in Excel.
With this update:
- Cells with formulas show an f(x) indicator that remains after refresh.
- Clicking into the cell reveals the formula.

- When dependent cells change, the formula cell shows a ⚠️ warning. Use the warning to update the cell and re-sync the result.
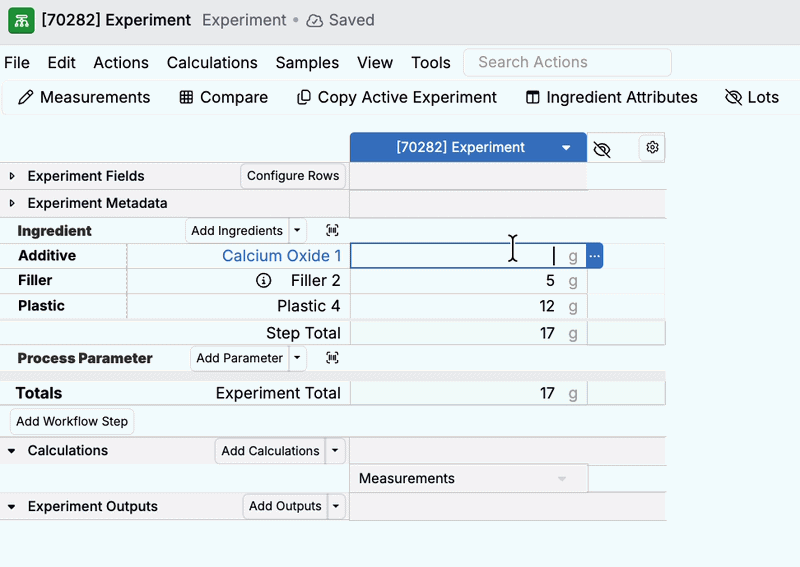
- You can also use the new Resync Excel Formulas action in the toolbar to automatically update multiple dependent formulas at once.
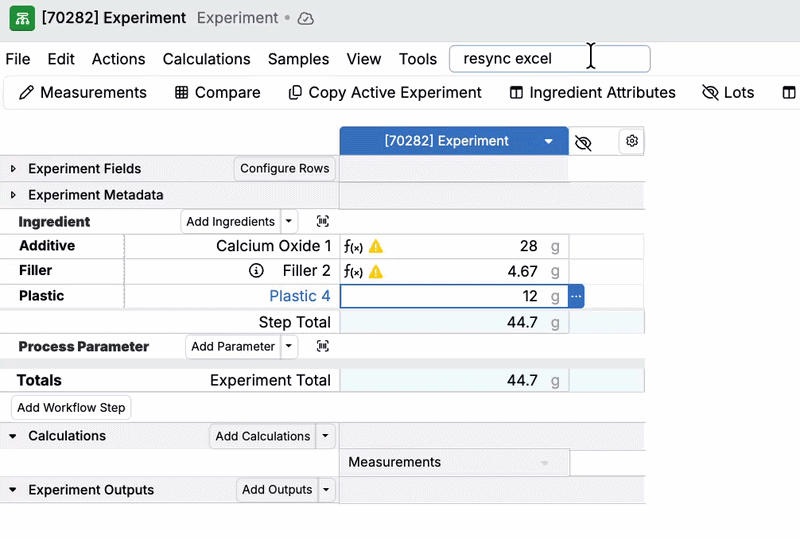
- Formulas can reference values across different quantity bases (for example, grams and moles). If you change the quantity basis, the formula is cleared to avoid silently applying a formula to a new unit basis.
These formulas continue to work even if ingredient order (and therefore cell references) changes via mix order.
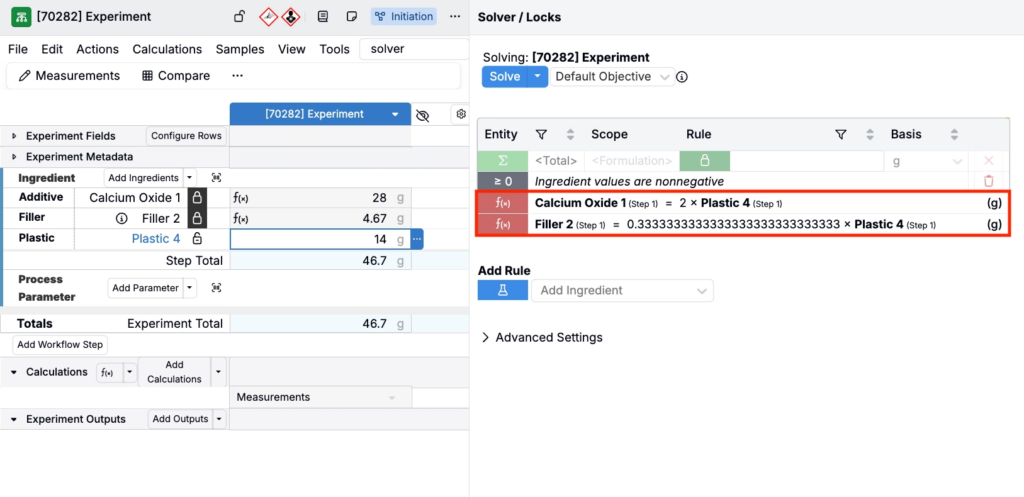
Excel-Type Formulas Now Visible in Solver Sidepanel
Excel-type formulas also now appear in the Solver side panel as a read-only Linear Constraint row.
Each Linear Constraint row show the cell the formula is written on, referenced cells with their (including the ingredient and workflow step context), and any constant values in the equation.
Because this is derived from the underlying Excel formula, changes to the formula automatically update what’s shown in the side panel. If the formula is removed, the corresponding constraint is also removed from the Solver sidepanel without needing a page refresh.
Uncountable Help Bot: Redesigned UI for Easier Navigation
The Uncountable Help Bot has a refreshed UI designed to make it easier to access, view past chats, and create new ones.
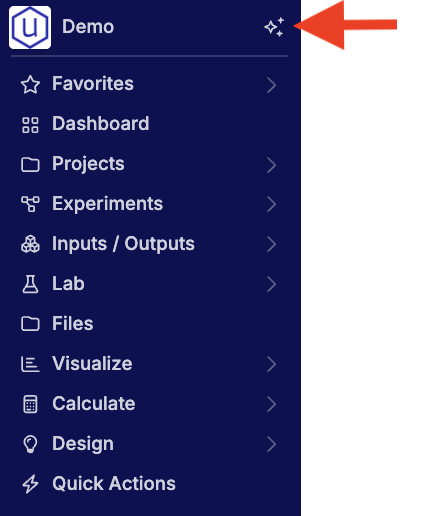
- Access the Help Bot by selecting the ✨ symbol at the top of the Uncountable navigation bar. This will open the chat in a sidepanel on the left side of your screen. If you close the chat, clicking it again will bring you back to your active thread.
Currently, this feature must be enabled manually in Company-Wide Settings > Platform Config by toggling on Enable Ask AI in Sidebar.
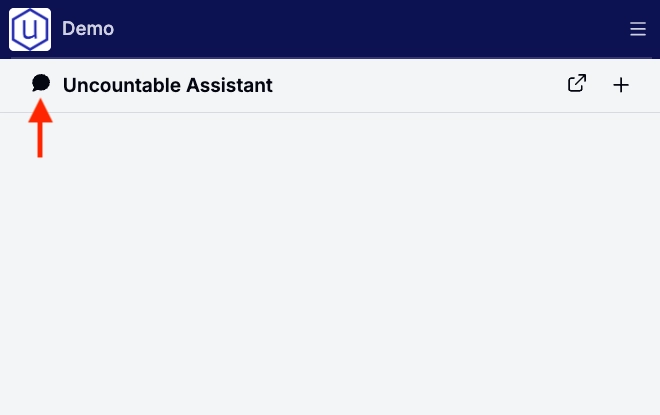
- View a listing of past Help Bot chats by clicking the 🗨️ icon in the top left corner of the Help Bot chat.
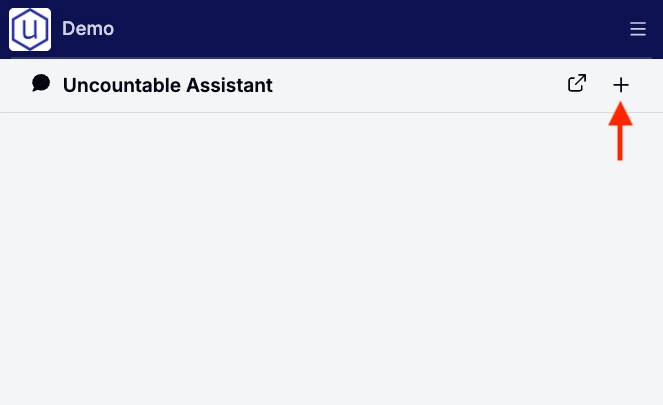
- Create a new chat by clicking the ➕ icon in the top right corner of the Help Bot chat.
- View your chat in a full page (instead of sidepanel) by clicking the open icon in the top right corner of the Help Bot sidepanel.
This redesign was introduced because users increasingly treat Help Bot chat as a workflow surface, not a one-off interaction. The new UI reduces friction when you need to reference prior chats, restart a workflow, or quickly return to your active thread.
To learn more, refer to Gen AI: Uncountable Help Bot.
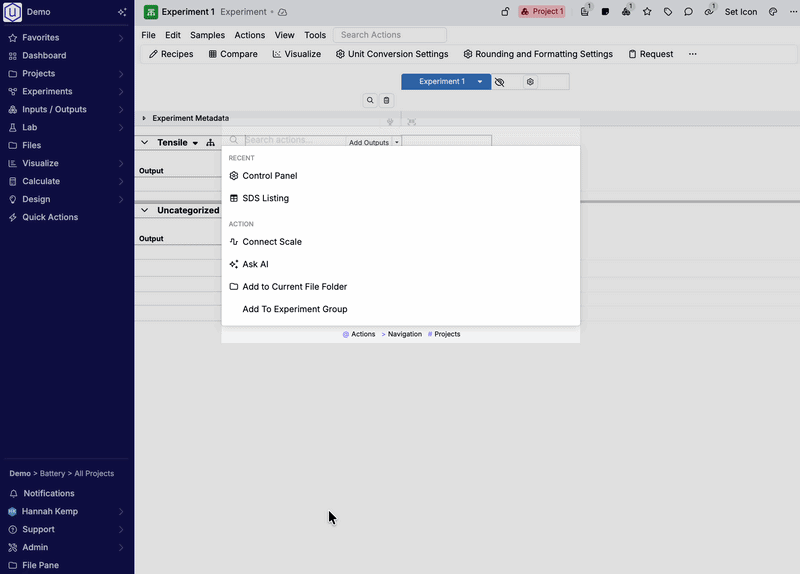
“Ask AI” from the Quick Actions Menu
Uncountable users can now ask the AI Help Bot questions directly from Quick Actions.
This reduces the number of clicks needed to access the help tool. It is intended to make the help bot more discoverable and better integrated into your workflows at the moment users get stuck. Instead of leaving the workflow to search docs or open a separate help surface, users can quickly access the help bot and ask questions.
Now, simply click Quick Actions in the navigation bar (or use the Command + K shortcut) to open the Quick Actions modal, type your question, and select Ask AI.
To learn more, refer to Gen AI: Uncountable Help Bot.
Uncountable Help Bot: Edit Custom Entities
The Uncountable Help Bot now also supports editing custom entities directly through chat. For example, you can now use the help bot to request entity changes such as:
- “Append ‘(Legacy)’ to all entities created before 2024.”
- “Set the workflow phase for all Quality Incidents reported in October 2024 to ‘Resolution in Progress’.”
If the request is not immediately clear, the Help Bot will then follow up with clarifying questions to ensure the edit is scoped correctly (for example, when names match multiple entities, or the entity type or field is not specified). Before submitting, the Help Bot will send a proposed change summary so you can quickly review what changed.
Edits run under the current user’s permissions. This means that the Help Bot can only make changes to entities that the current user has access to.
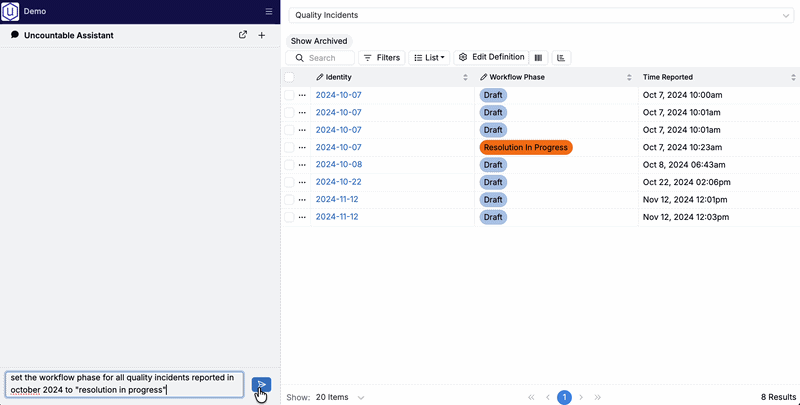
Currently, this applies only to custom entities but support for future base entity types will be added in the future. To learn more, refer to Gen AI: Uncountable Help Bot.
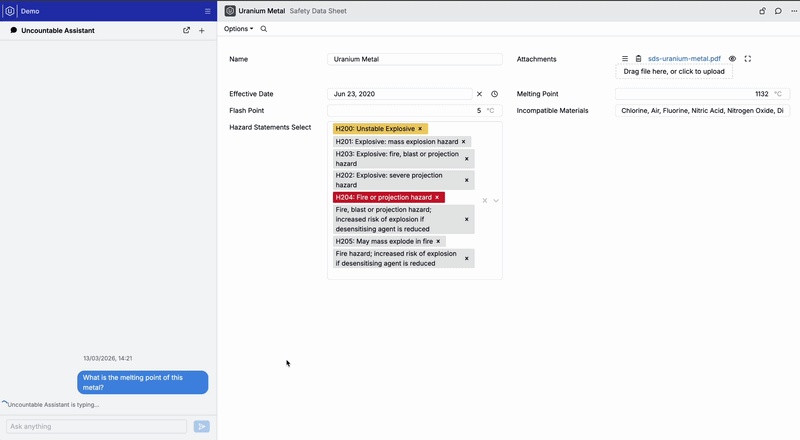
Uncountable Help Bot: Context-Aware Responses
The Help Bot can now use the context of what you are currently viewing in Uncountable to answer questions more precisely. Instead of asking you to restate what you are looking at, the Help Bot can inspect the entity on screen and pull relevant values directly from the page, including information contained in attached PDFs.
This is especially useful when you are validating data or troubleshooting in the moment. For example, if you are viewing a Safety Data Sheet, you can ask:
- “What is the melting point of this material?”
- “What is the flash point?”
- “Which materials is it incompatible with?”
The Help Bot will answer using the content on the page you have open, so you can stay in your workflow while you confirm details and move to the next step.
To learn more, refer to Gen AI: Uncountable Help Bot.
Uncountable Help Bot: New Data Analysis/QC/RCA Features
The Help Bot now has access to new tools to support data analysis, quality control, and root-cause analysis workflows.
- Sampling and inspection: You can now use the Help Bot to pull a random or stratified sample of recipes from a project or recipe set. Stratification can use experiment tags, metadata, output values, created time, and more. This makes it easier to review representative slices of large datasets.
Example: “Can you sample the experiments in this project and explain why entrained air is higher than normal in a few of them?”
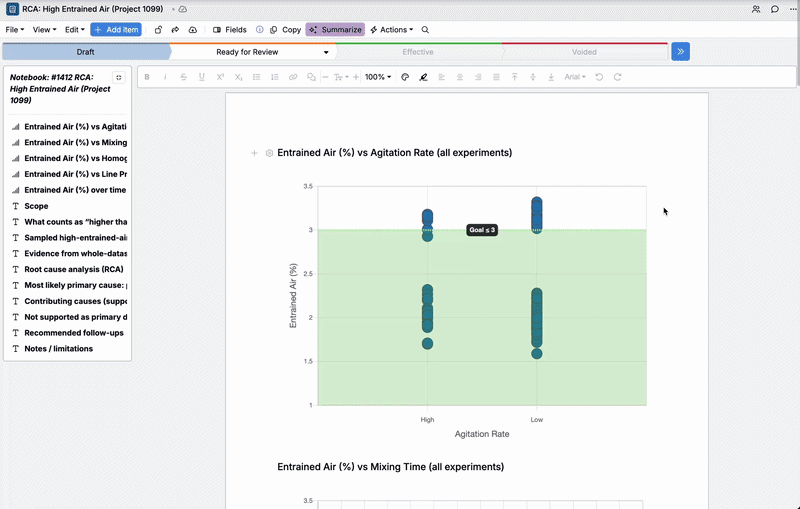
- Notebook creation + graphs: The Help Bot can now create notebooks, add content, and generate graphs that illustrate relationships in your data. When a notebook is created, the Help Bot will provide a link to it within the chat.
Example: “Produce a notebook report, conducting an RCA. Include graphs illustrating relationships over the whole dataset as evidence.”
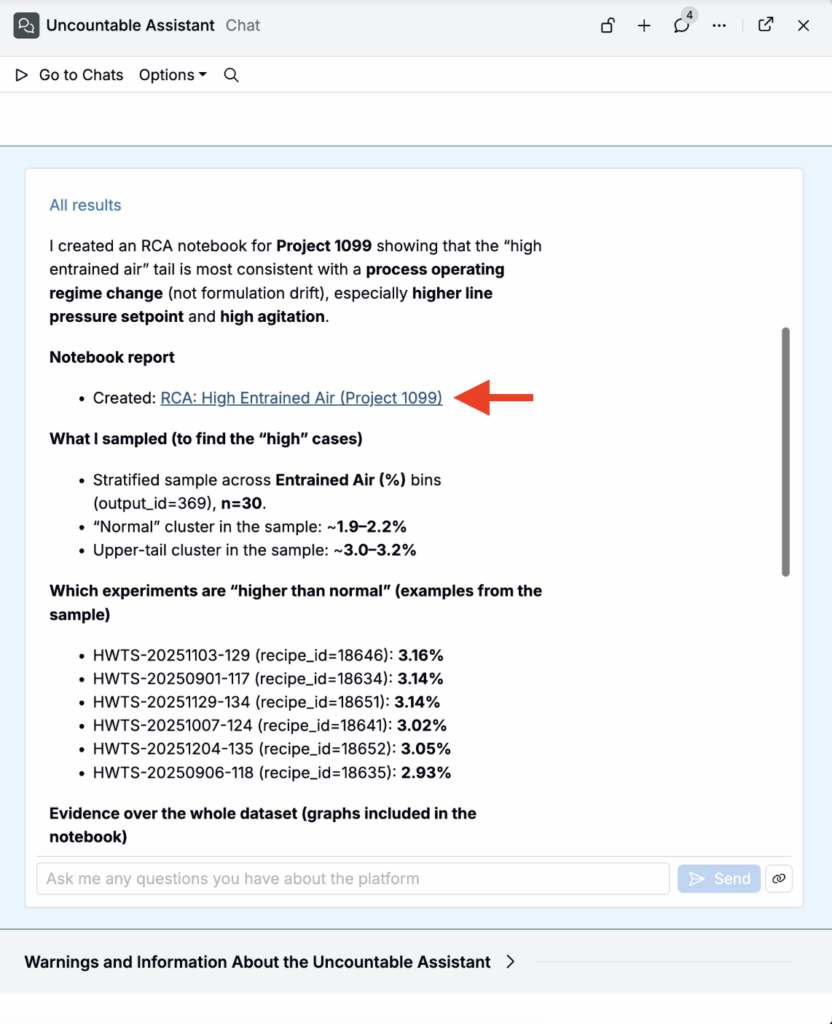
These features were added because teams increasingly use the Help Bot as part of day-to-day technical work, not just for quick questions. Sampling, inspection, and lightweight analysis are common steps in QC and RCA, and previously they required manual filtering, exporting, and repeated context switching.
With these tools, the Help Bot can help teams move faster from “something looks off” to a concrete, reviewable set of evidence. It makes it easier to look at representative data, capture findings in a notebook, and share graphs and outputs with others.
To learn more, refer to Gen AI: Uncountable Help Bot.
New Recipe View Customization Options
Experiment recipes in Uncountable now include new customization options to help teams reduce visual noise and keep attention on the most important part of the workflow.
On the Recipe view of your experiments, you can now:
- Hide the File menu bar (View > Header Bar).
- To add it back, click the arrow on the far right side of the Actions toolbar.
- Hide the actions bar (View > Action Bar).
- Focus on select workflow steps
- Click into the step name and select Workflow Step Actions > Focus on Workflow Step.
- To unfocus, click the 👁️ icon in the step header.
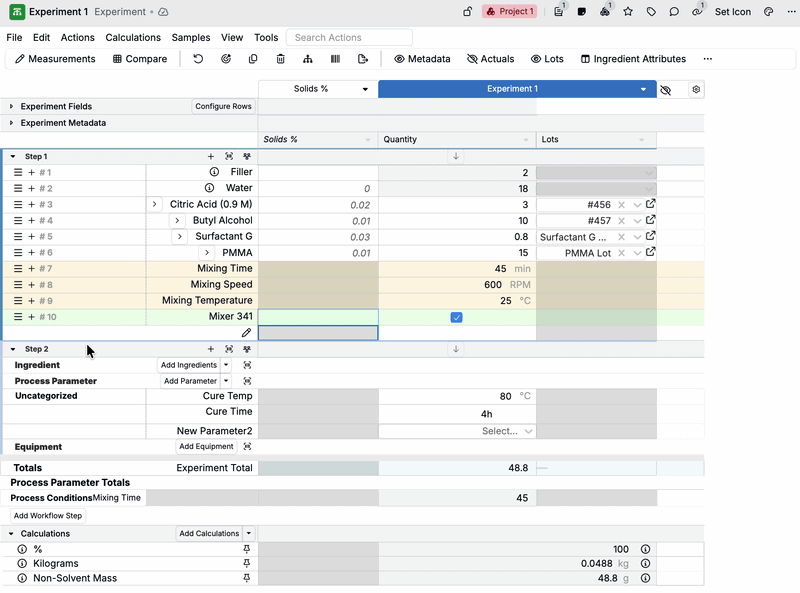
This change offers faster scanning and a cleaner, more purpose-built task views for operators and technicians. It also provides better support for dashboard-style layouts where you want the table to be the primary interface.
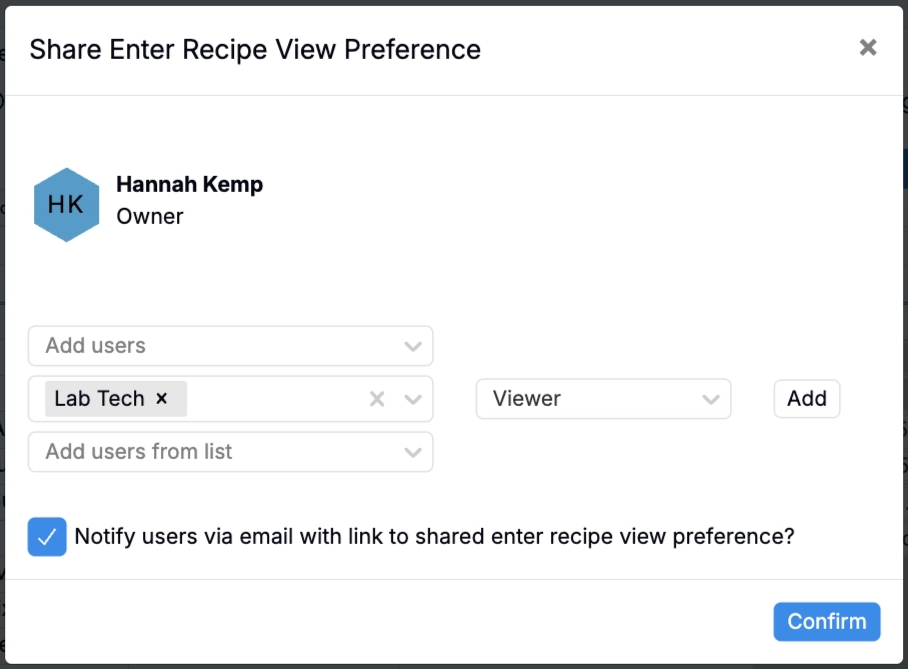
Sharing View Preferences
We’ve updated our View Preferences sharing settings to give teams more control over who can access a preference and who can edit it.
This helps solve a common collaboration issue: teams want a consistent, “recommended” view for a workflow, but different roles (operators, reviewers, admins) often need different layouts. Now, you can share a View Preference broadly while limiting edit access to a smaller set of owners.
- Assign Viewer to people who should be able to load the preference but not change it.
- Assign Editor to people who should be able to load and edit the preference.
To share a View Preference:
- Open the View Preferences modal.
- On the preference you want to share, click … > Share.
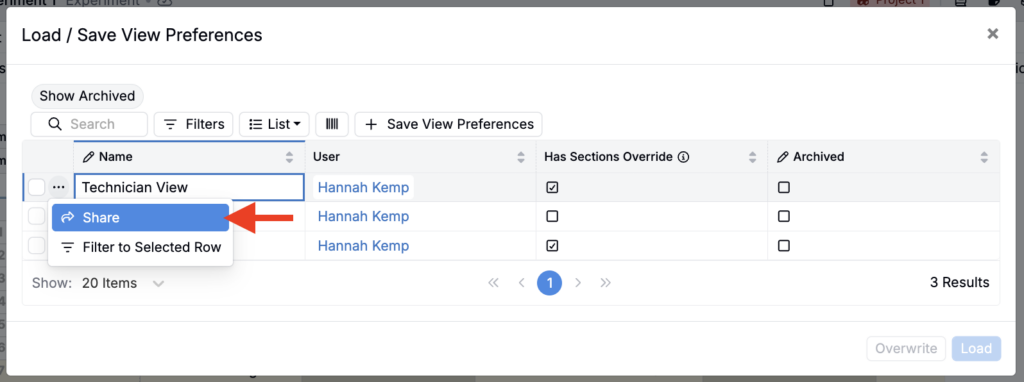
- Select users or user groups.
- Choose an access level (Viewer or Editor).
- Click Add.
Update to Spec Permissions
Uncountable has updated how specs permissions work to improve performance and make access more consistent. With this change:
- Each material family now has its own spec definition.
- All specs created within a material family will be associated with that material family’s spec definition.
- A user can view a spec only if they have Read access to the spec’s material family–specific definition (either directly or via a user group).
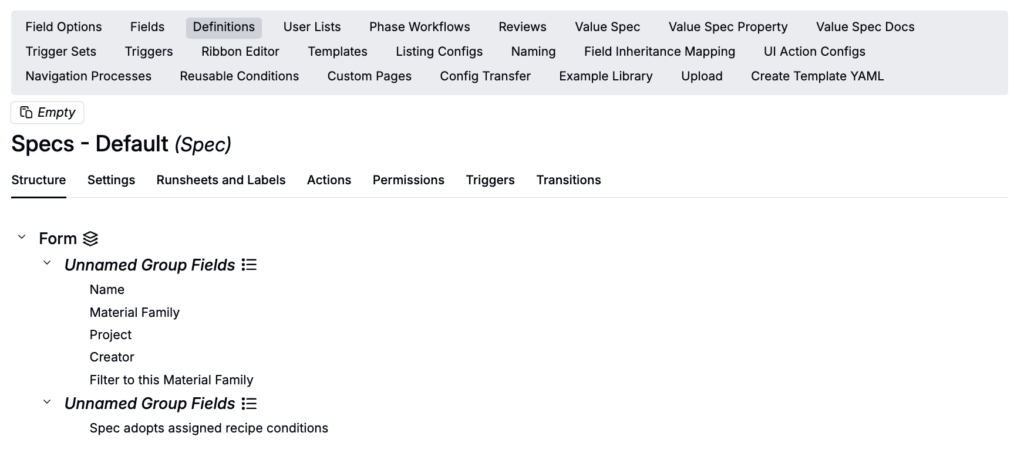
Previously, spec visibility was derived from multiple permission scopes (e.g. project and material family access). This new permissions model standardizes spec visibility by aligning access with permissions on the spec definition.
To learn more, refer to Update to Spec Permissions.