Structured listings in Uncountable include support for pivot groups, or set of columns that are generated from a single field. Each column represents one value in that field.
Pivot groups are especially helpful when your goal is to compare data across a set of experiments, samples, lab requests, or other objects. For example, they can answer at a glance questions such as:
- “What do results look like per lab?”
- “What is the value per test sample?”
- “Which outputs are recorded per condition?”
How to create a pivot group
You create a pivot group from an existing column in a structured listing.
- Open the listing you want to edit (e.g. Lab Requests).
- Go to List > Set Columns.
- In the modal, add the column you want to pivot from. This is usually a column that references a related set of items, such as experiments on a lab request, ingredients used in a recipe, or outputs recorded.
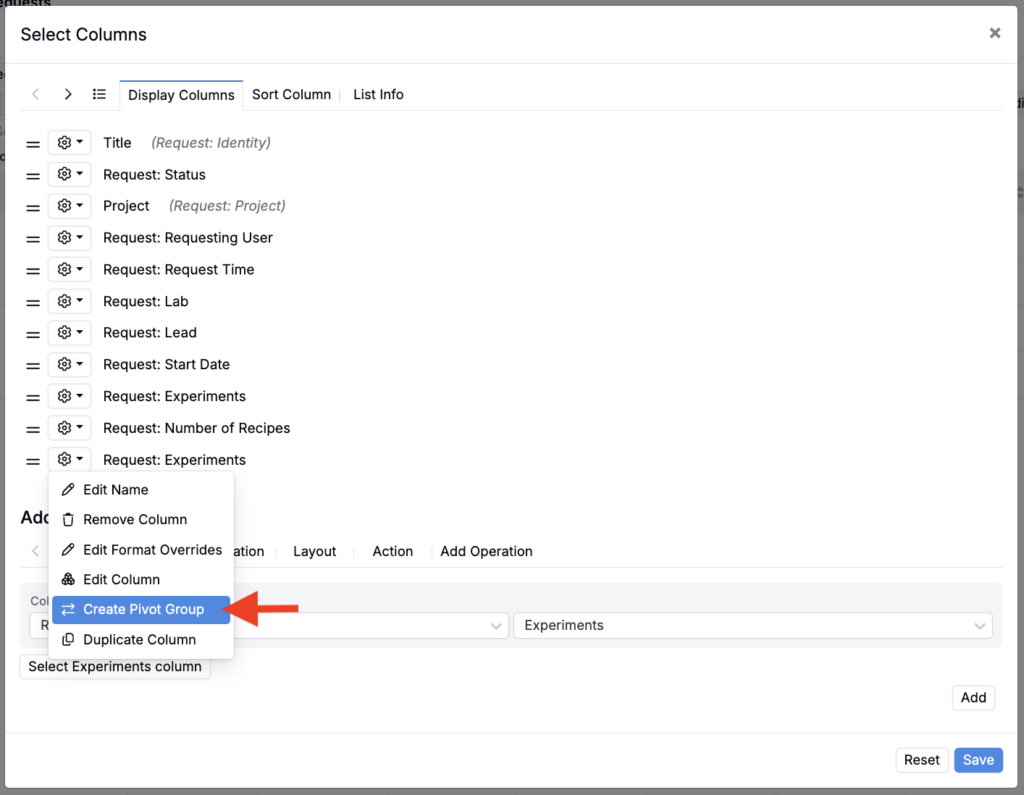
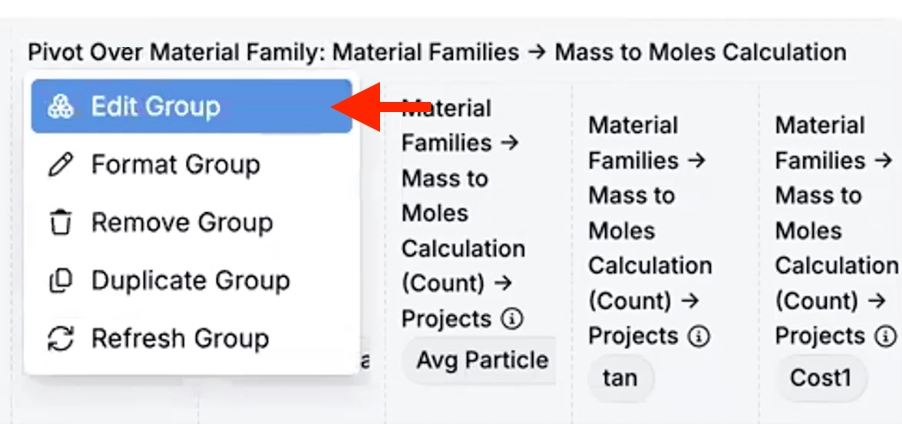
- In the table header for that column, open the column menu and choose Create Pivot Group.
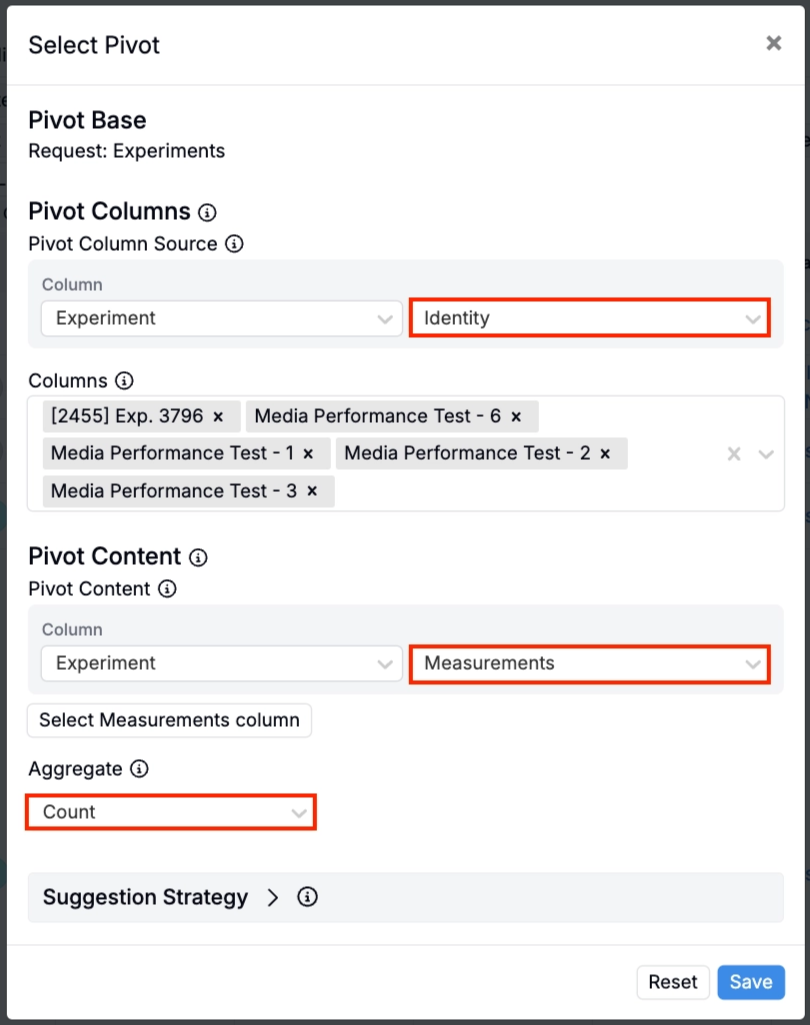
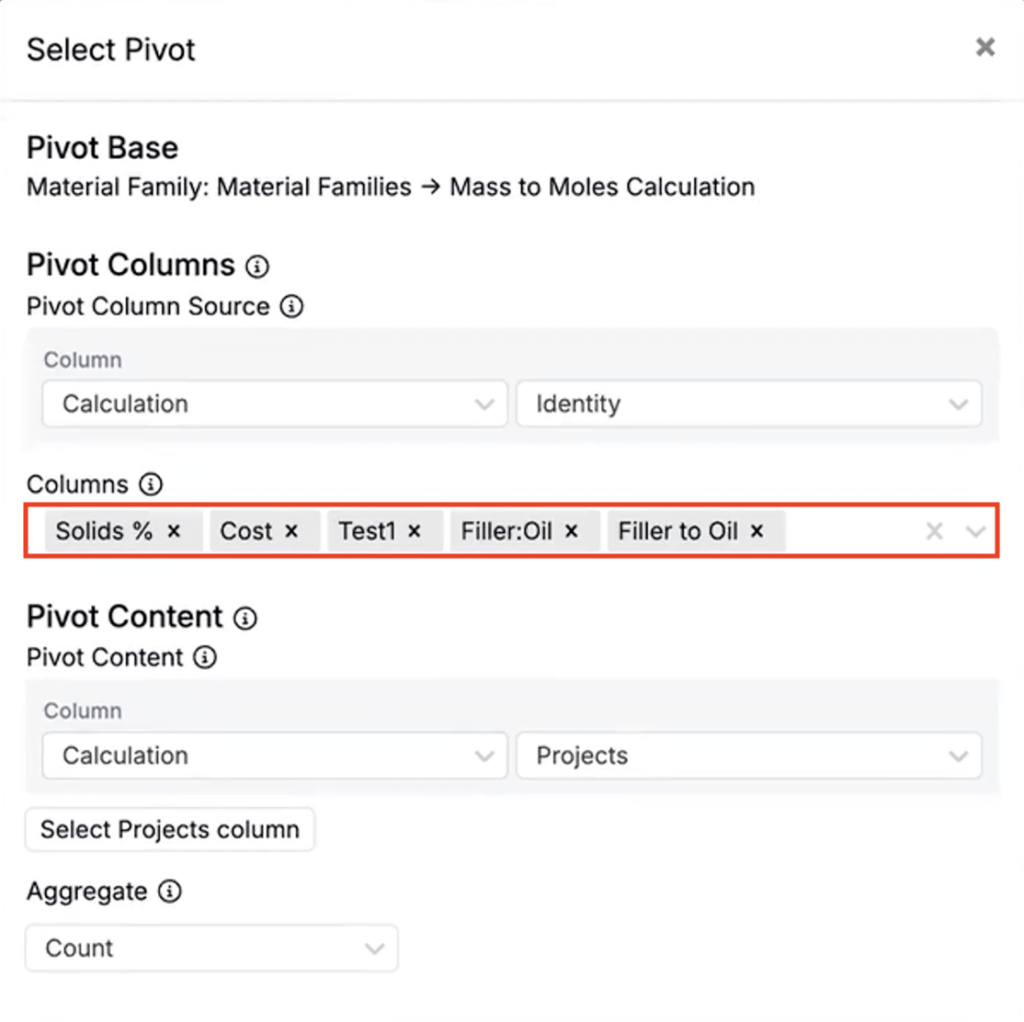
- Use the Pivot Column Source fields to choose what to pivot on (e.g. the Experiment Identity, to have experiment names as the column headers). This is the field whose values will become the column headers
- Columns will be automatically selected. Add and remove columns as desired.
- Use the Pivot Content fields to choose what each pivot column should show inside the table.
- Use the Aggregate field field to specify how to cases where the column contains multiple values (Collect, Collect Distinct, Count, Count Distinct, First, Unique Value).
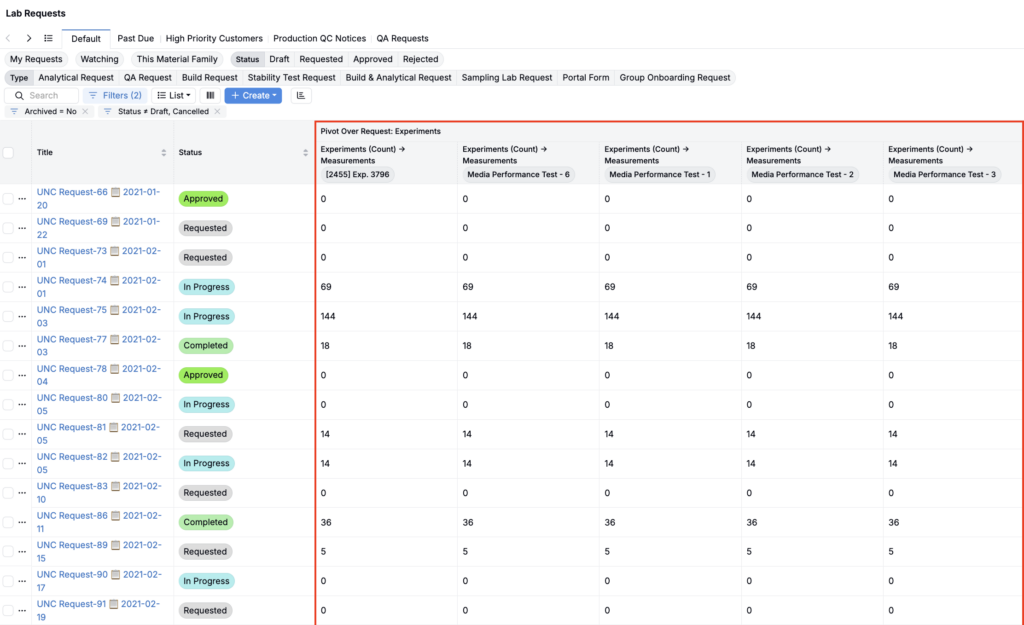
After saving, you will see a new group of columns in your listing, one for each selected value.
Pivot group tips
- Start small: pick just a few values first, validate the view, then expand.
- Name your columns clearly: pivot columns are most useful when the headers are immediately understandable.
- Use pivot groups to reduce filter switching: if you find yourself repeatedly filtering to the same values to compare them, a pivot group is often the better view.
Suggestion strategies
When your pivot group is based on a transitive aggregate, you can use Suggestion Strategies to automatically choose and update the pivot columns.
Suggestion strategies help you:
- Limit which values become pivot columns by adding filters.
- Control the order of the pivot columns by adding a sort (column + direction).
For example, if your pivot group creates one column per test sample, new test samples can be added as new pivot columns after you refresh, without rebuilding the pivot group.
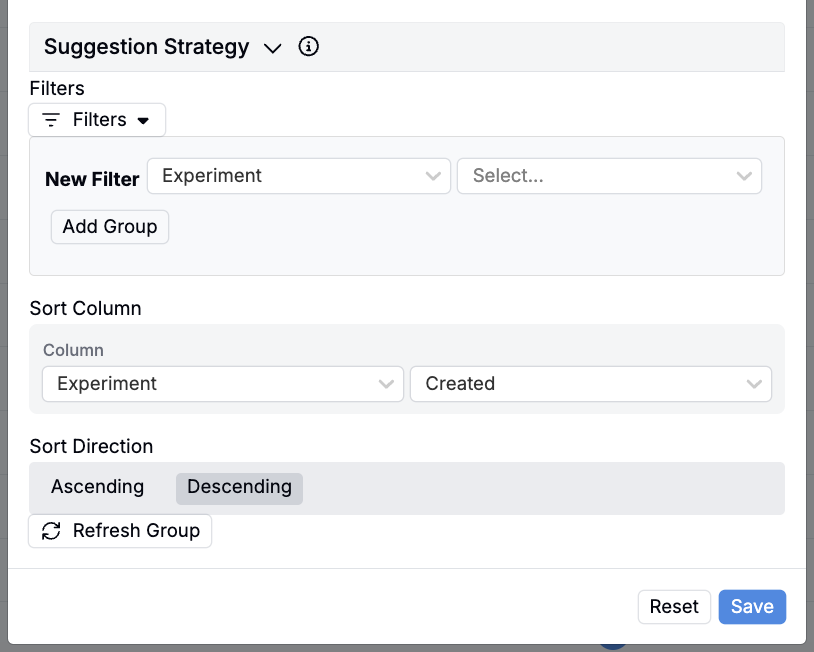
To update pivot group columns using suggestion strategies:
- Edit the pivot group.
- In Suggestion Strategies, set any filters and (optionally) a sort.
- Click Refresh Group.
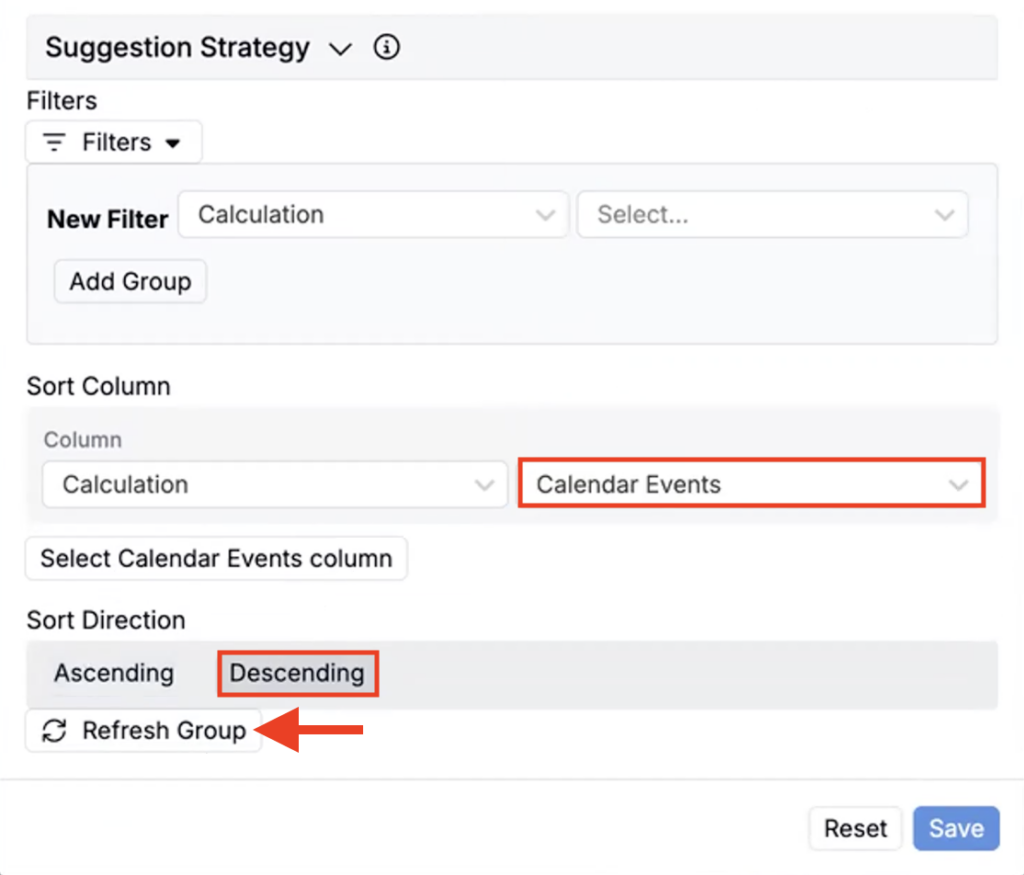
- Review the suggested columns in the Columns section.
- Click Save to apply the updated set of pivot columns.