In Uncountable, Notebooks are built from individual items (or cells), which are modular blocks that display text, data, plots, comparisons, and more. You can add, rearrange, and edit these items to create reports, summaries, dashboards, or analysis pages.
Adding an Item
To add an item to a Notebook:
- Open a Notebook page.
- Click the Add Item button in the top toolbar or the gray + icon on the canvas.
- From the dropdown menu, select the item type you want to insert.
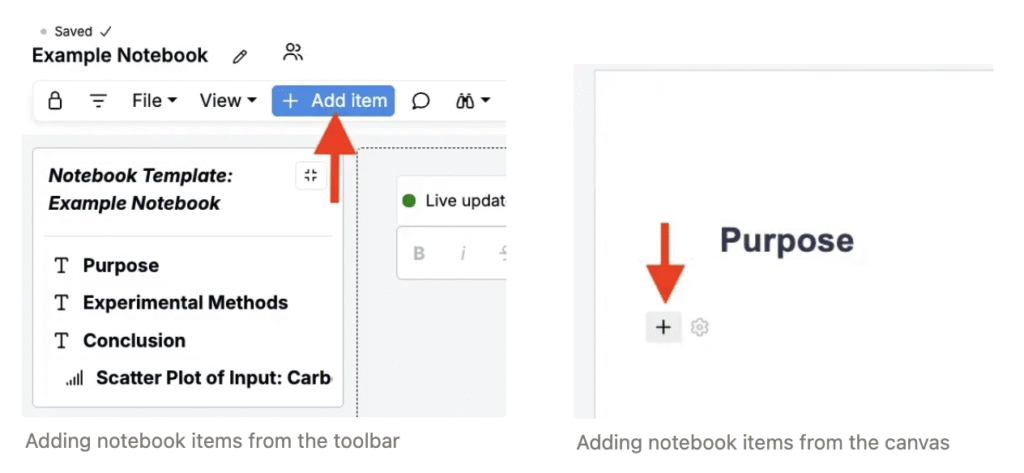
Each inserted item appears as a cell. You can click and drag to move cells, resize or delete them, and edit their contents in place.
Supported Item Types
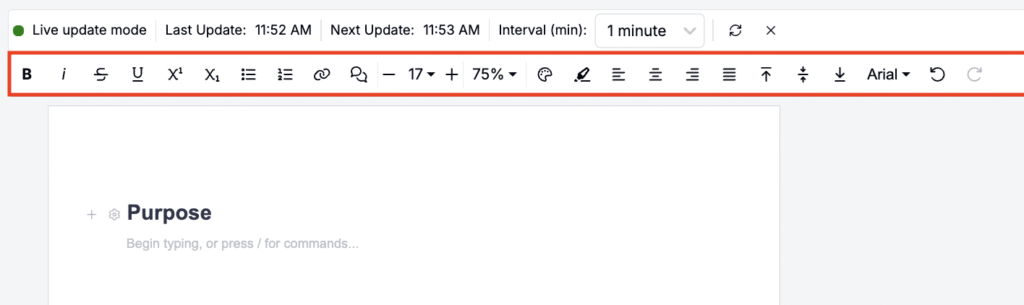
Text
Insert text blocks to add section headers, notes, commentary, or instructions. Use the toolbar at the top of the page to format text (bold, italic, underline), change color, add links, or leave comments.
Custom Table
Create lightweight tables to summarize information manually. Add or remove rows and columns using the + Row and + Column buttons, and align content left, center, or right.
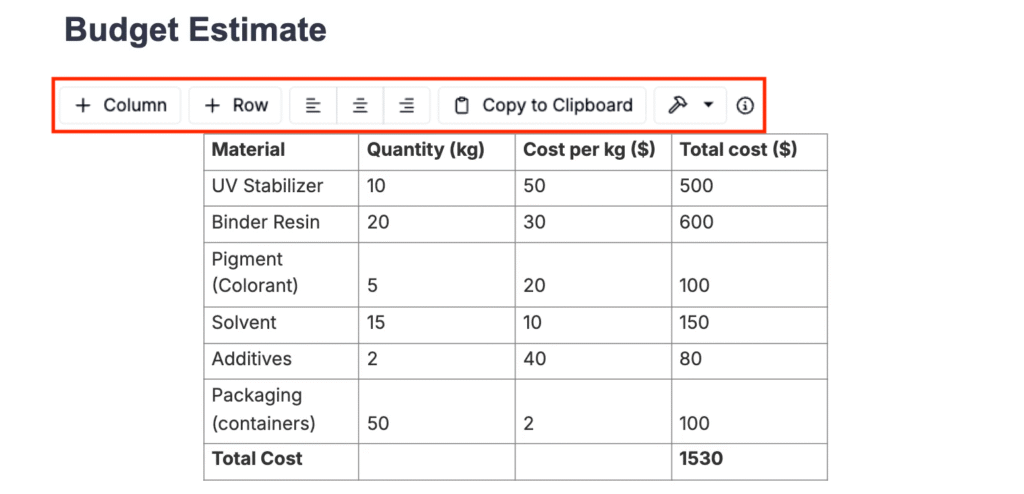
See Table Builder for a detailed walkthrough.
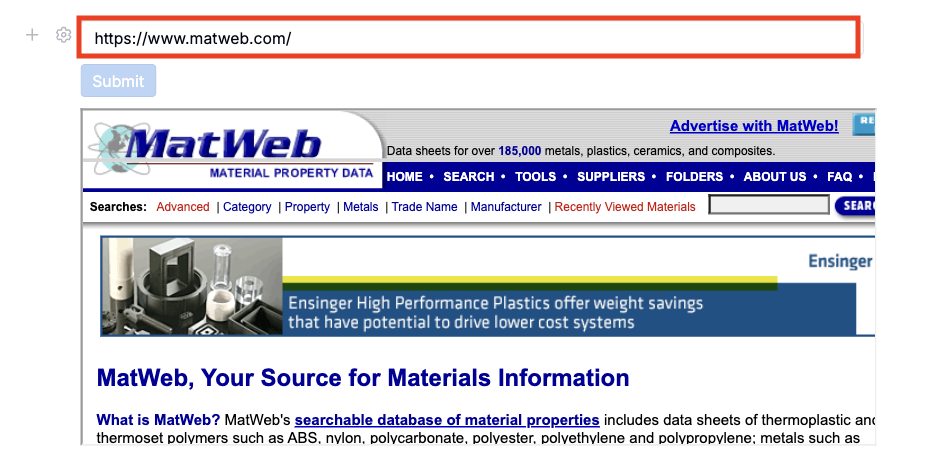
Embedded Website
Embed a website link directly into your Notebook for quick reference or live data displays.
To add a site:
- Select Embedded Website from the Add Item menu.
- Paste the full URL into the modal and click Add.
An interactive preview of the site appears in the Notebook. Embedded websites are useful for dashboards, internal tools, and documentation links.
Structured List
Display data dynamically from your workspace by inserting a Structured List.
- Select the entity type (e.g., experiments, ingredients, batches).
- Choose the listing type:
- Standard Listing – A configurable list view that can be searched and filtered.
- Aggregated Listing – A summarized view used for analysis or chart generation. Learn more.
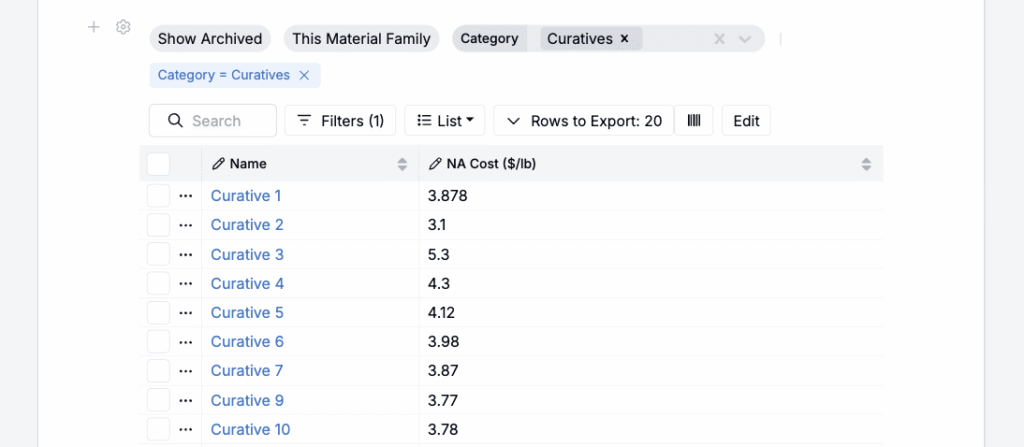
Once added to your notebook, users can:
- Add/remove columns columns by selecting List > Set Columns.
- Add filters by selecting the Filters button.
- Search the listing using the Search bar.
Experiment Comparison
By default, adding an Experiment Comparison cell will insert a Compare table with the 10 most recent experiments within the project.
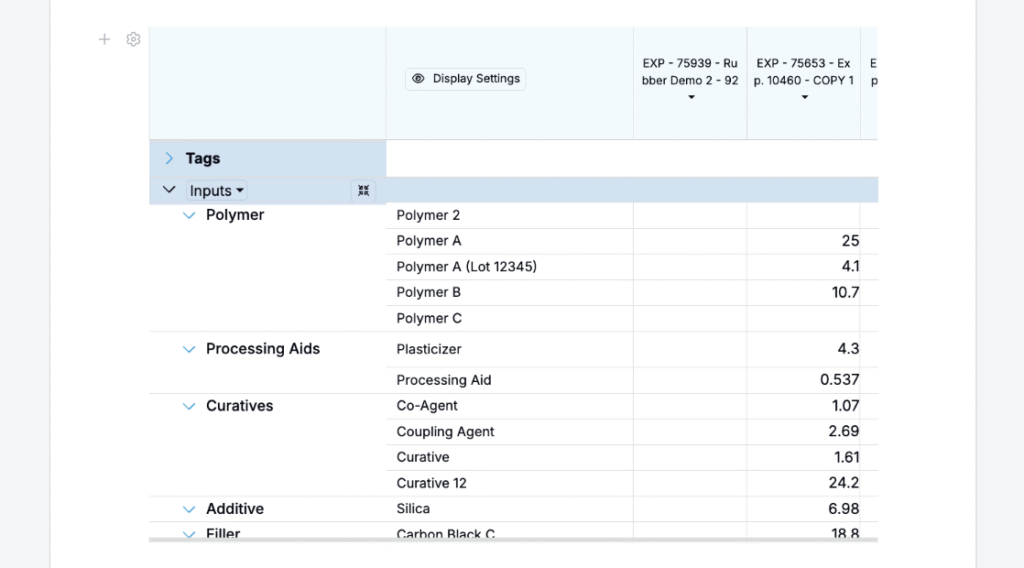
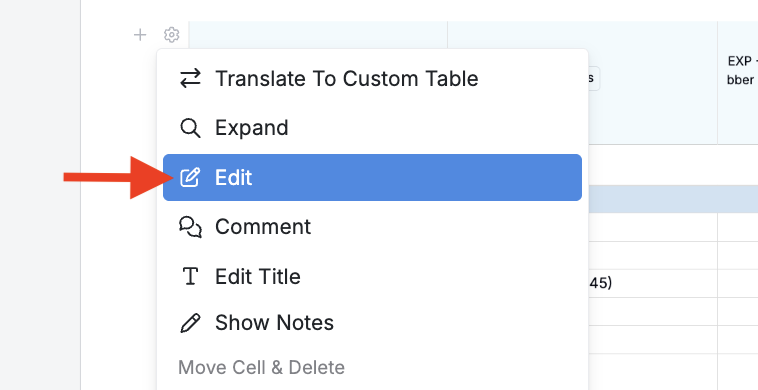
To edit the table, click ⚙️ > Edit.
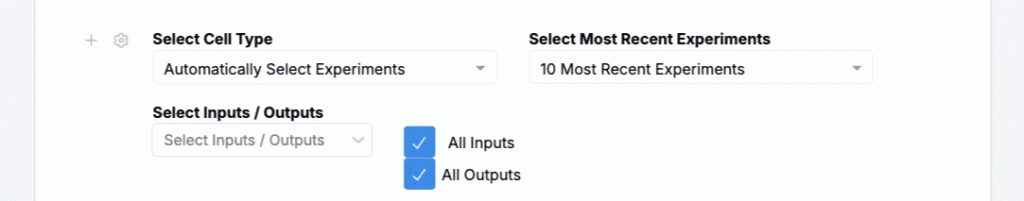
Settings include:
- Select Cell Type
- Automatically Select Experiments: Displays the most recent 5, 10, or 25 experiments.
- Manually Select Experiments: Choose experiments from a dropdown.
- Infer Experiments with Value-Spec: Dynamically generate comparisons using value specifications.
- Select Most Recent Recent Experiments — Select whether to include the 5, 10, or 25 most recent experiments
- Select Inputs/Outputs — Manually select which inputs or outputs to include or use the checkboxes to include all inputs and outputs from the selected experiments.
Signature Block
Add a Signature Block to record approvals or verifications directly within a Notebook.
To insert a signature block:
- Select Signature Block from the Add Item menu.
- Click Sign to open the sign modal.
- Add your digital signature or create a new one if you haven’t set one up before.
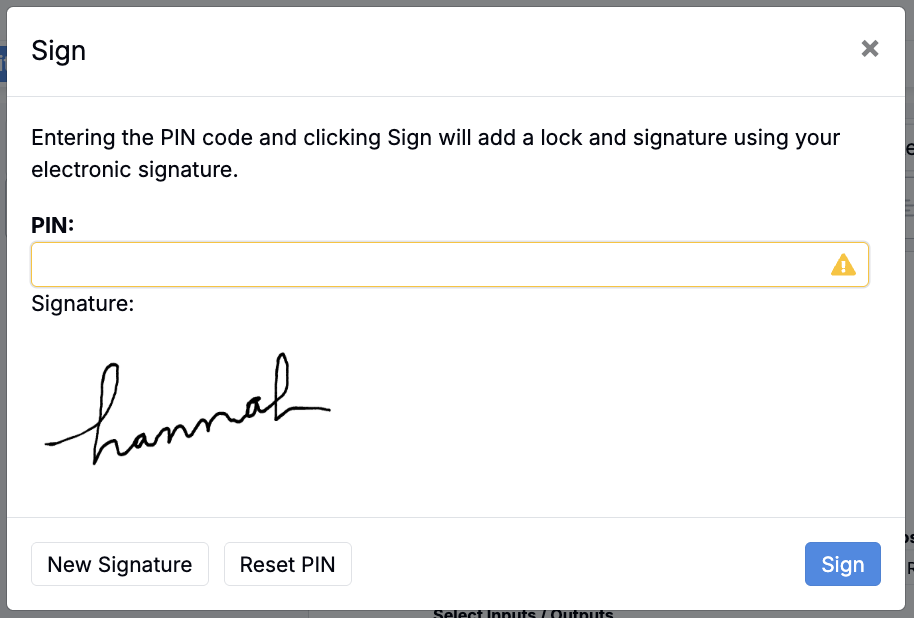
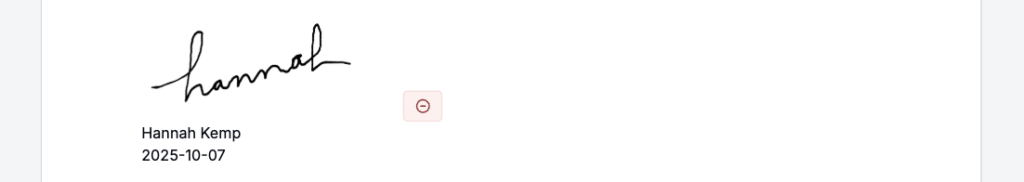
Once signed, the block displays the signer’s name, timestamp, and signature image.
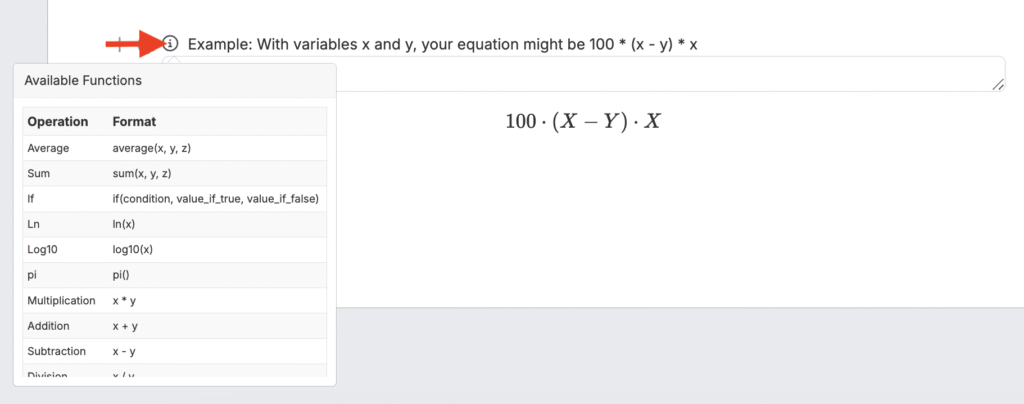
Equation
Add an equation cell to calculate or display formulas. Type your equation directly into the editor; a preview will render below.
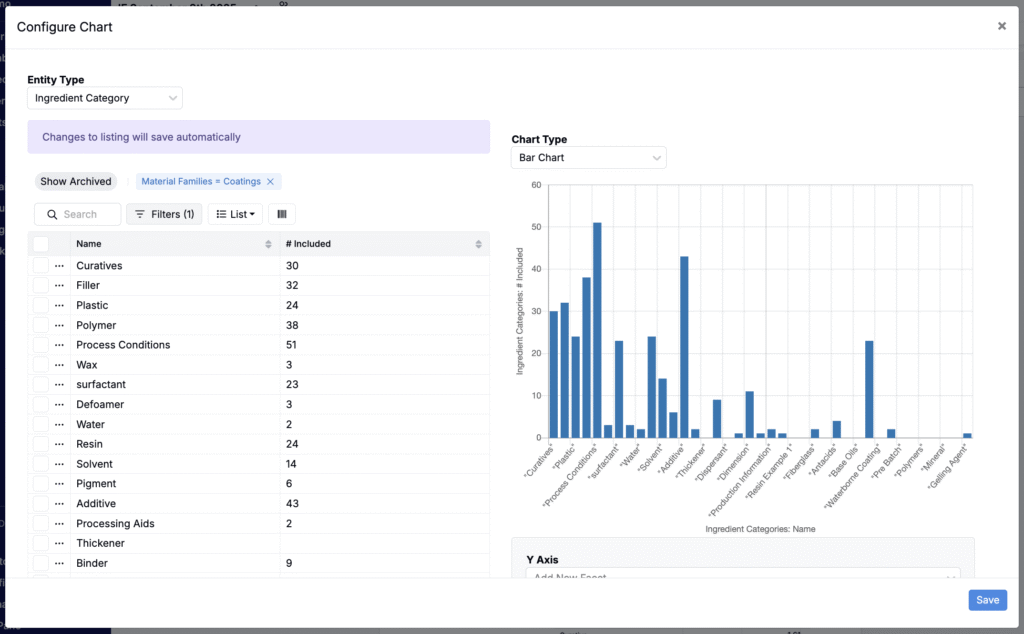
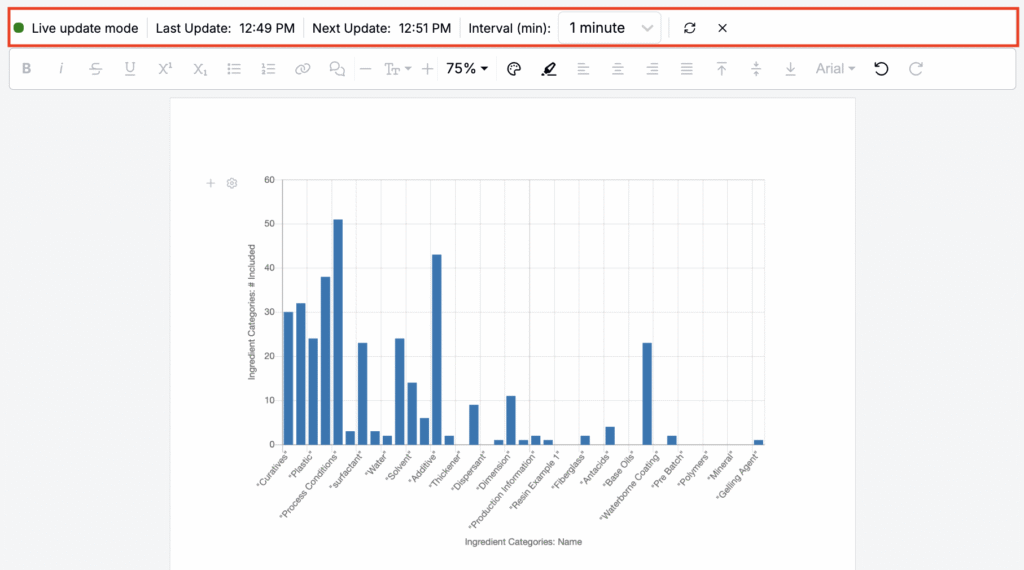
Chart
Visualize grouped or aggregated data.
- Select Chart from the Add Item menu.
- Click Edit Chart Configuration to define your data source (experiments, equipment, etc.).
- Choose grouping and aggregation columns, then select your chart type (bar, line, pie, or radar).
- Configure axes and groupings, then click Save to display your chart.
Once added, the chart is embedded directly in your Notebook. Charts are dynamic, meaning that when Live Update Mode (View > Toggle Live Update Mode) is enabled, any changes to the project data are automatically reflected in the visualization.
Filter Control
Add filter controls to make data visualizations interactive. When adding a Filter Control cell, you will first select what entity type you want to filter (e.g. Experiments). After adding, click Filters to add custom filters to your notebook.
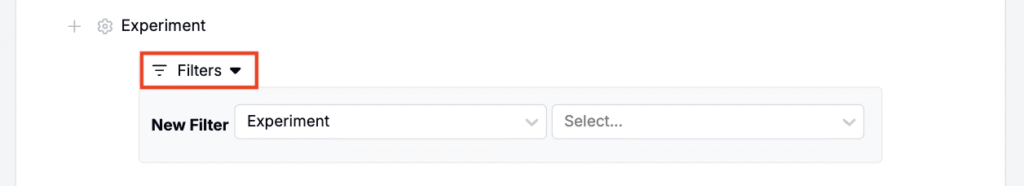
Filter Control cells are typically used for dashboard-style notebooks, where plots change dynamically based on the filters added.
To learn more, refer Dashboard Notebooks.
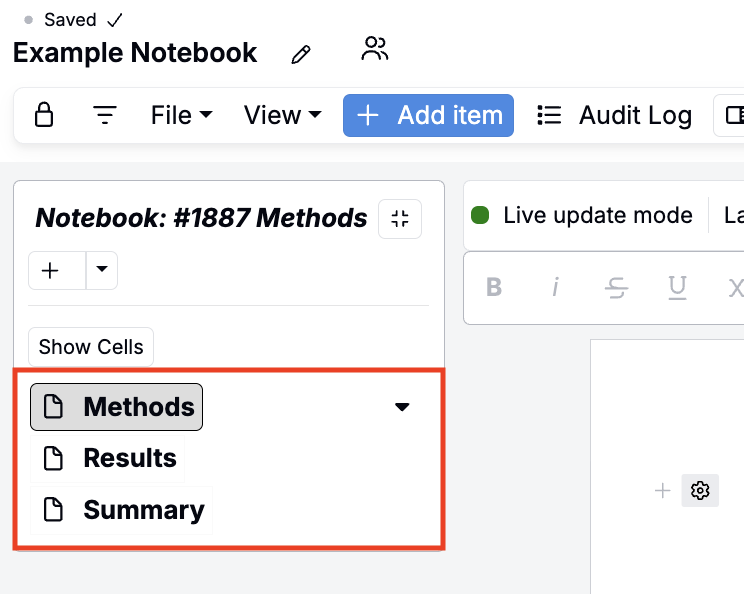
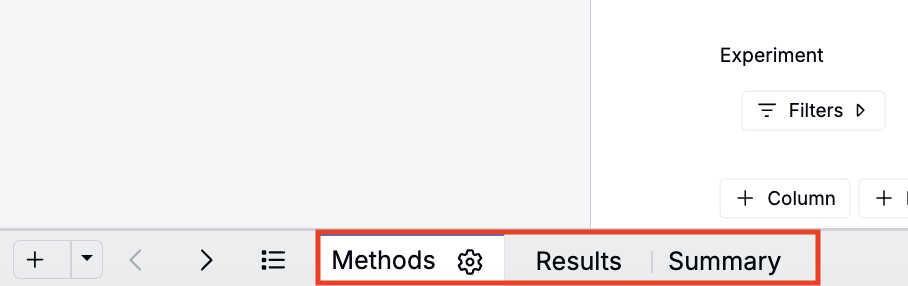
Page
Add additional pages within the same notebook to organize content by topic or workflow stage (e.g., Methods, Results, Summary). Pages appear in the sidebar and page tab bar at the bottom of the notebook.
Correlation Matrix
Insert a Correlation Matrix to visualize relationships between selected inputs and outputs. Click the pencil icon to open the matrix editor, select variables to include, and define correlations by clicking directly into the matrix.
To learn more, refer to View Correlations.
Chemical Structure
Embed Uncountable’s Chemical Search feature within your Notebook for quick molecule lookups or imports.
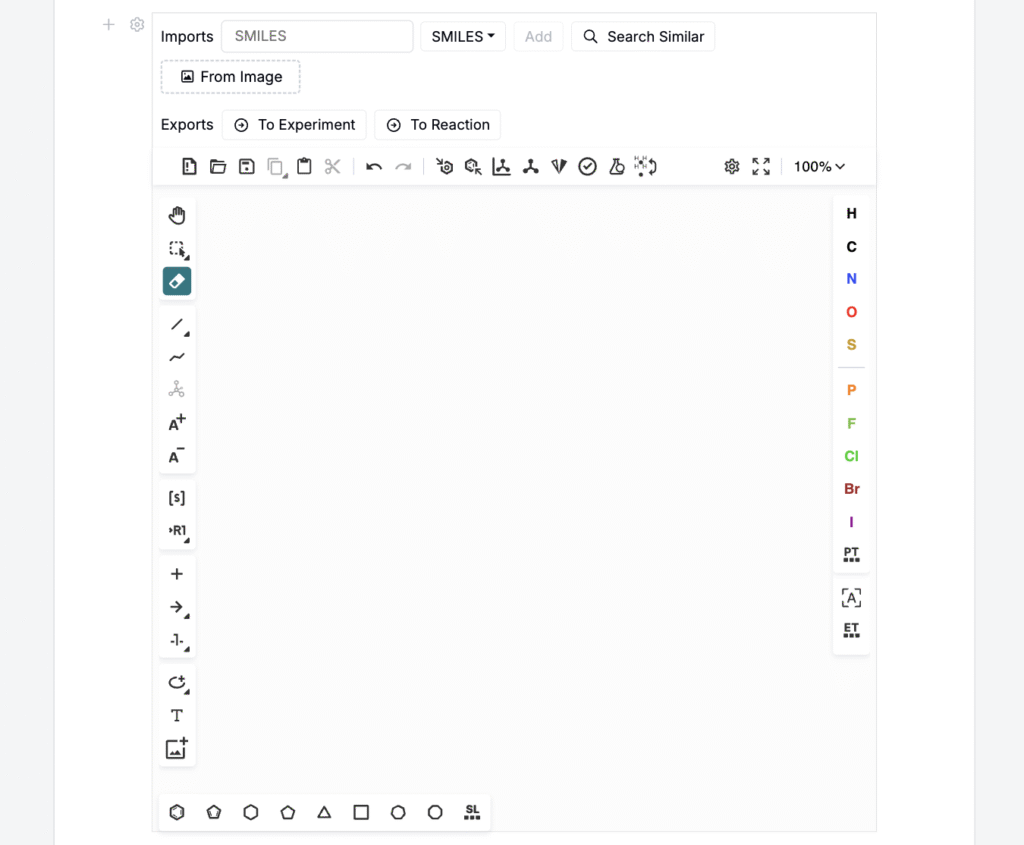
See Chemical Search for more details.
Add File
Upload and embed files, such as images, directly. Drag and drop files into the modal or click to browse.
Microsoft Office Files
Create new or embed existing Word, Excel, or PowerPoint files directly within your Notebook. These files open in Microsoft 365 Online for editing, and once saved, remain embedded in the Notebook for view-only access and easy reference.
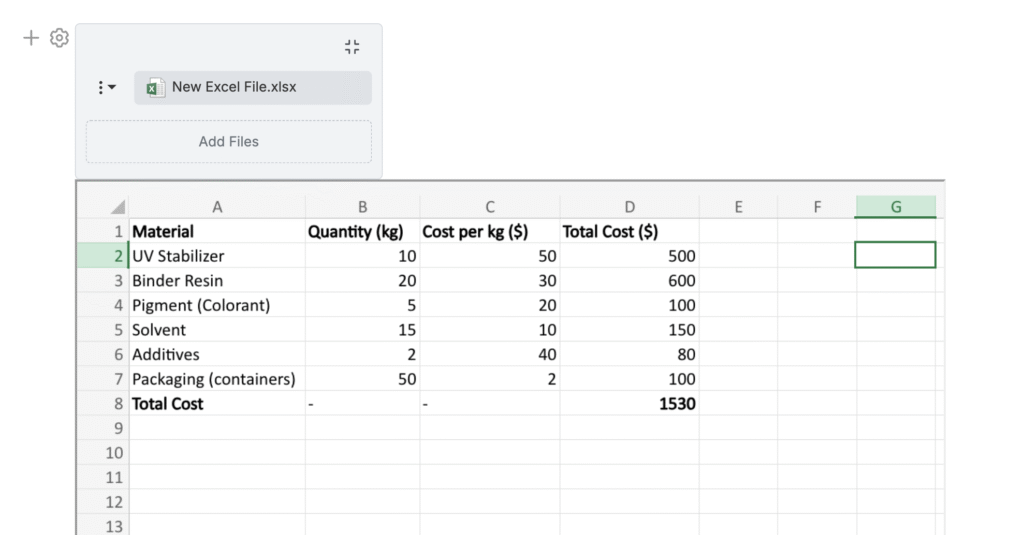
Note: Requires Office 365 integration and is not enabled by default in all environments. Uncountable users should contact their account manager for access.
New Experiment
Create experiments directly from your Notebook. In the modal, name the experiments, assign a workflow, and select a variant.
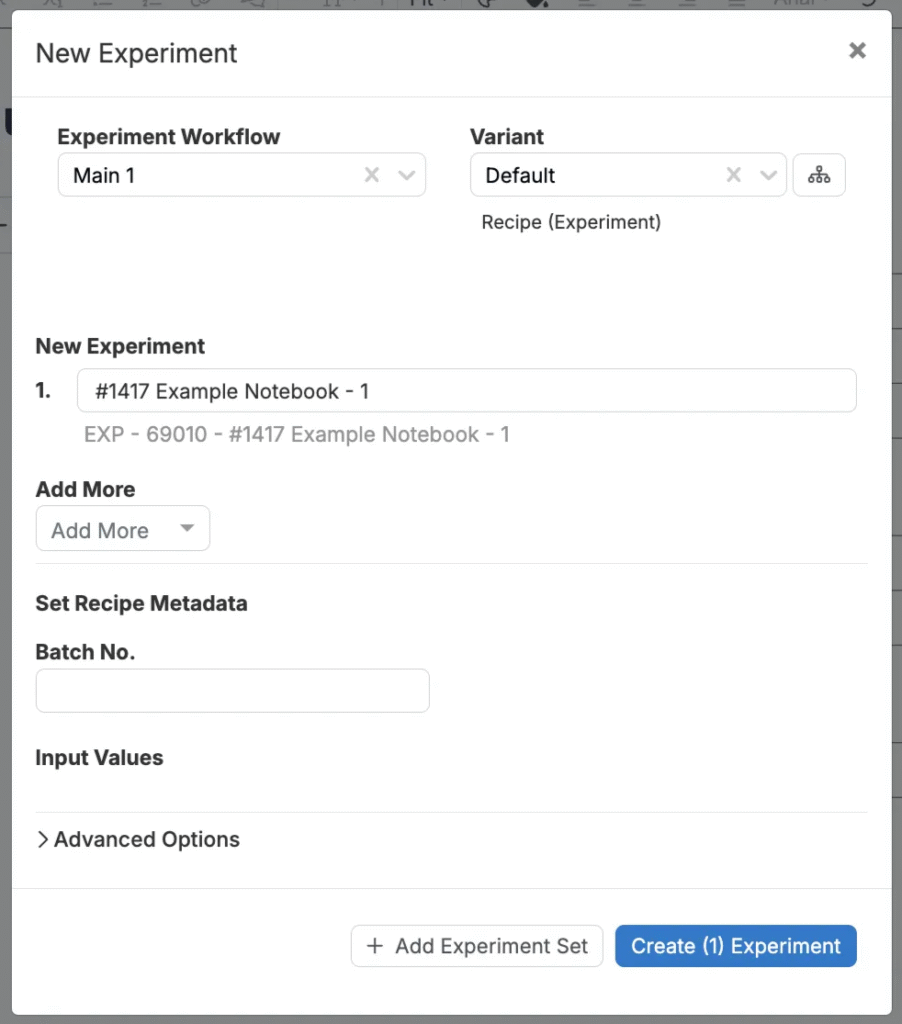
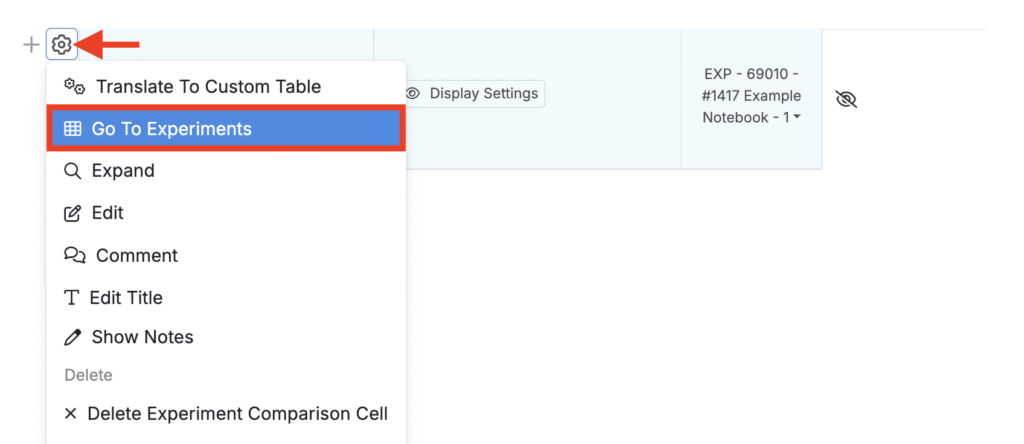
After creation, Uncountable automatically adds an experiment comparison cell for the new record. To edit experiment recipe and measurements, click ⚙️ > Go to Experiments.
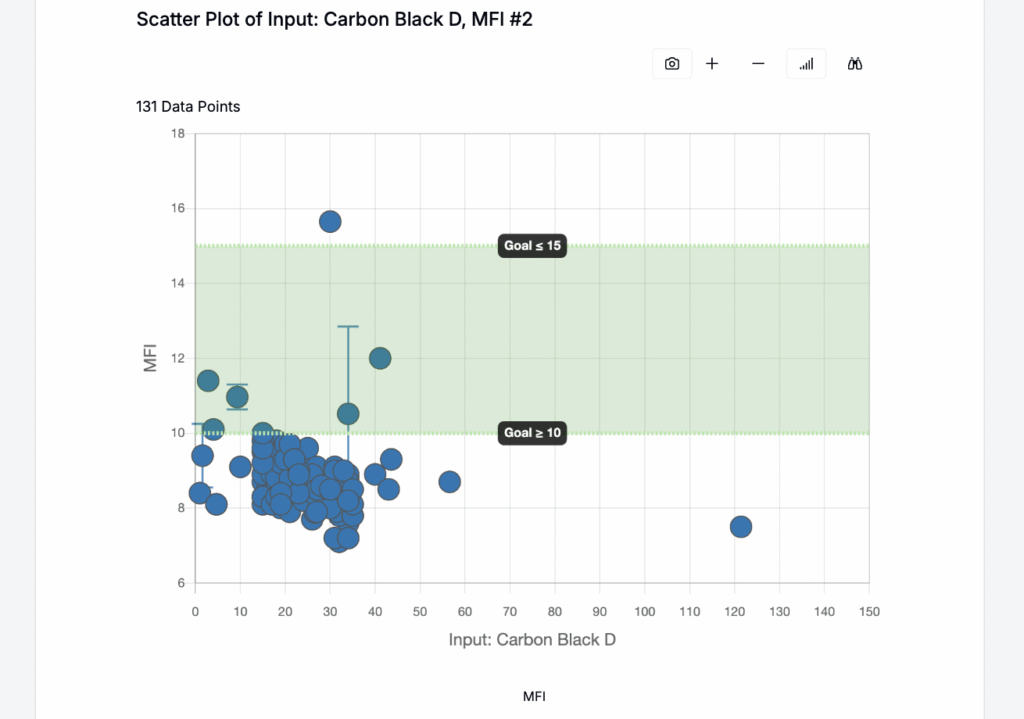
Visualize Plots
You can also load saved visualize plots directly into your Notebook. In the modal, select an Explore Data save and click Load.
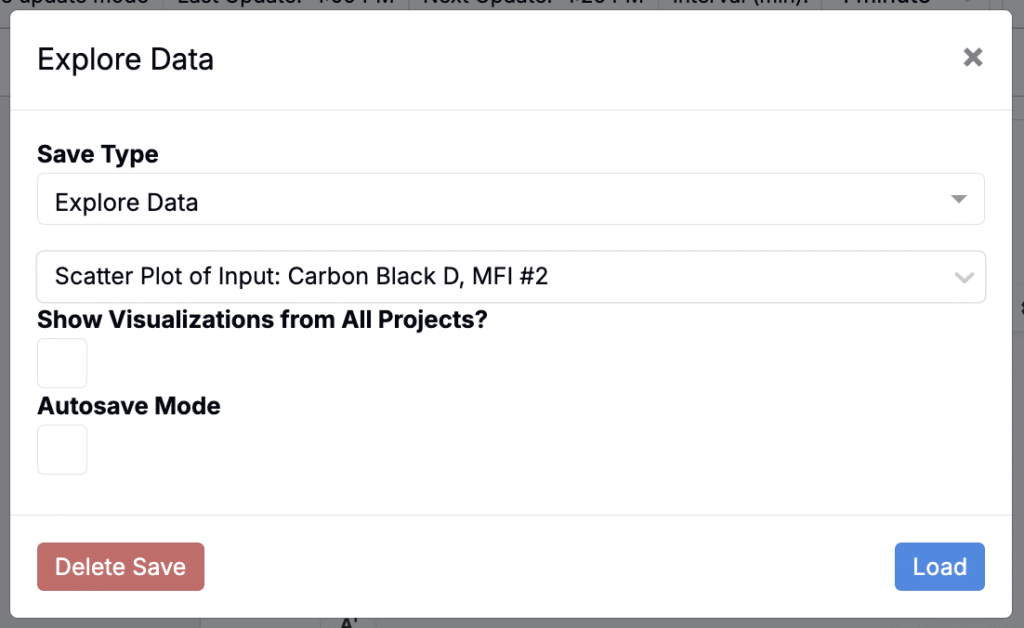
The selected plot is embedded in the Notebook and automatically scoped to the Notebook’s project. To include plots saved across multiple projects, enable Show Visualizations from All Projects in the modal before loading.
Editing and Rearranging Items
- Move cells by dragging their handles.
- Resize cells by adjusting borders.
- Edit inline by clicking within a cell.
- Delete via the cell menu.
All changes are saved automatically.