The Project Dashboard is the central workspace for managing a project in Uncountable. It provides quick access to experiments, settings, and related project pages.
To access your active project’s dashboard, select Dashboard from the navigation bar. You can also access a project’s dashboard by selecting it from the Select Projects or Project List page.

Key Features
On the Project Dashboard, users can:
- Create new experiments
- View and update project metadata and settings
- Search, filter, and sort experiments
- Select and preview experiments
- Jump directly to the Recipe, Measurements, Compare, or Visualize views
- Navigate between associated project pages and experiment views
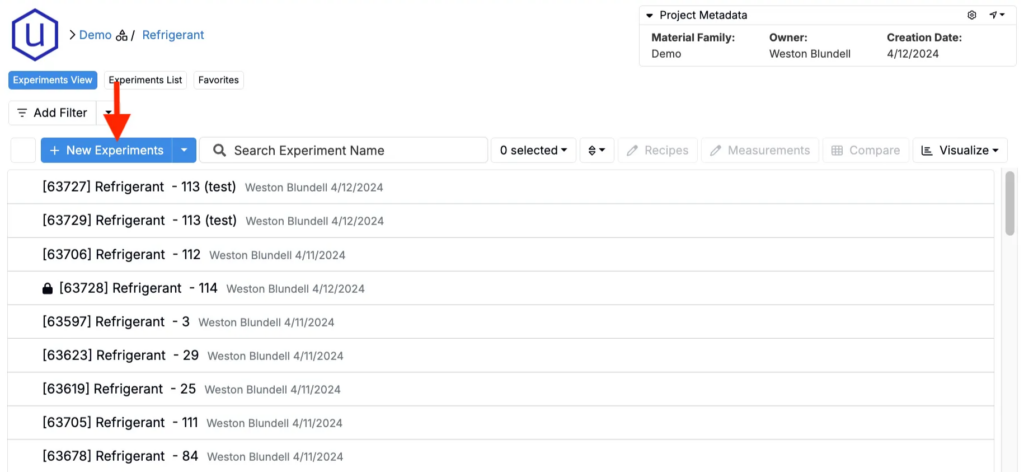
Creating New Experiments
To create a new experiment within the project, click the blue + New Experiments button at the top of the dashboard and fill out the required fields in the modal.
To learn more, refer to Creating New Experiments.
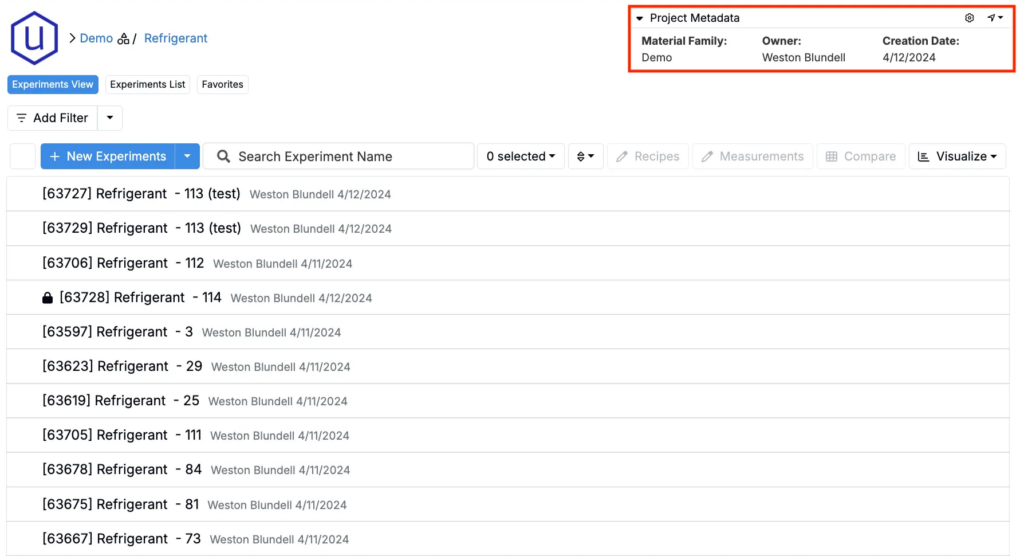
Viewing and Editing Project Metadata
In the top right corner of the dashboard, users can view the project’s metadata fields. By default, this section includes:
- Material Family
- Project Owner
- Creation Date
To learn more, including how to display additional fields in creation modal or configure metadata settings, refer to Project Definition & Metadata Fields.
Viewing and Editing Project Settings
To edit metadata values or other project-level settings, click the ⚙️ icon in the top right corner.
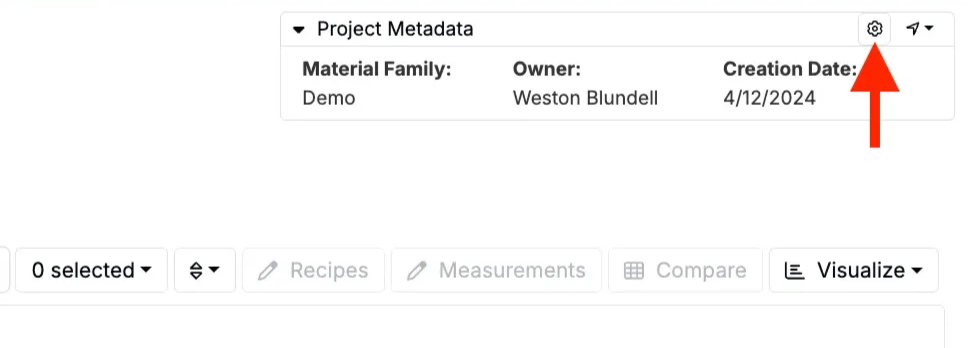
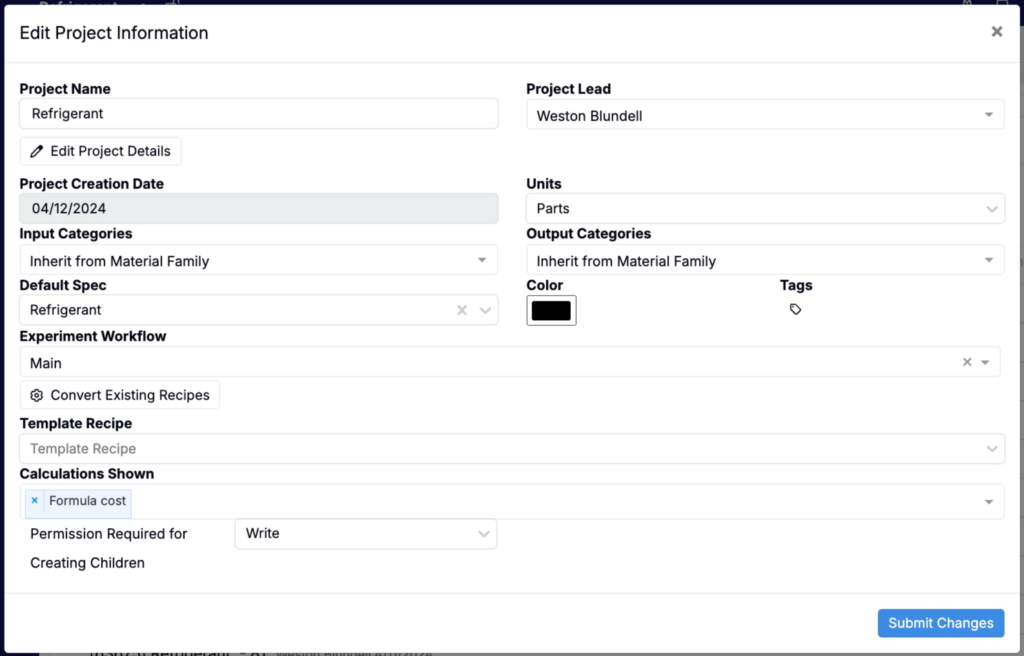
Within the Project Information modal, users can update the following settings:
- Project Name – Edit the name of the project
- Project Lead – Assign a new project lead. This user will automatically receive Write access to all experiments in the project
- Units – Set default units (e.g., parts, percent, lbs/gal)
- Input Category Behavior – Choose whether input categories are project-specific or inherited from the material family
- Output Category Behavior – Choose whether output categories are project-specific or inherited from the material family
- Default Spec – Set the default spec for the project
- Experiment Workflow – Select a default workflow for experiments created in the project
- Color – Assign a folder color for visual identification on the Select Project page
- Tags – Apply tags to group and organize the project
- Template Recipe – Choose an existing recipe to use as a template for new experiments
- Calculations Shown – Select which recipe calculations should appear by default in the Calculations section of each experiment
- Permissions Required for Creating Children – Specify the minimum permission level (Read or Write) needed to create child projects under this one
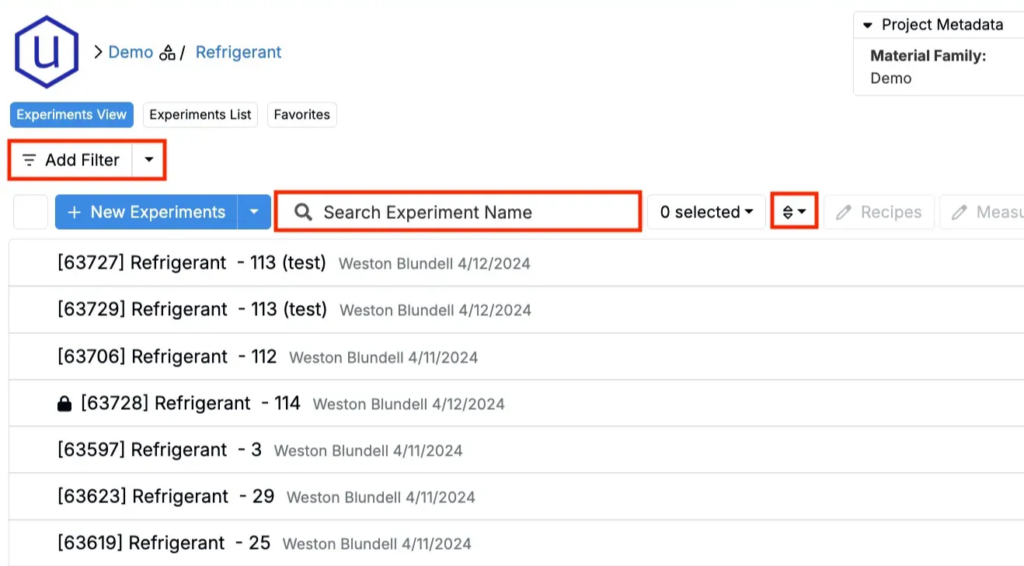
Searching, Filtering, and Sorting Experiments
Use the Search bar to find experiments by name. To refine your view:
- Click Add Filter to search by metadata, ingredients, tags, measurements, creators, or dates.
- Use the Sort icon to sort experiments by name, date created, date edited, or custom order. By default, experiments are sorted from latest created to oldest created, top to bottom.
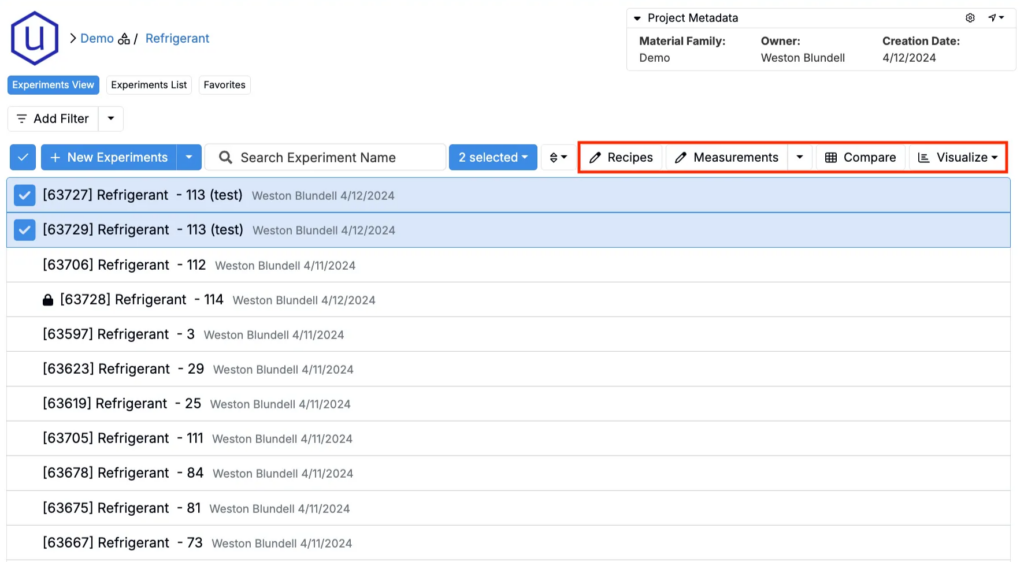
Selecting and Previewing Experiments
Selecting an experiment from the dashboard opens a preview side panel that displays high-level recipe information, including metadata, inputs, and outputs. If a spec is defined, output values will be highlighted in green or red to indicate whether they fall within the specified range.
If multiple experiments are selected, the side panel will show details for the most recently selected experiment only.
From the top toolbar, you can also quickly navigate to the Recipe, Measurements, Compare, or Visualize (Explore Data) views for all selected experiments.
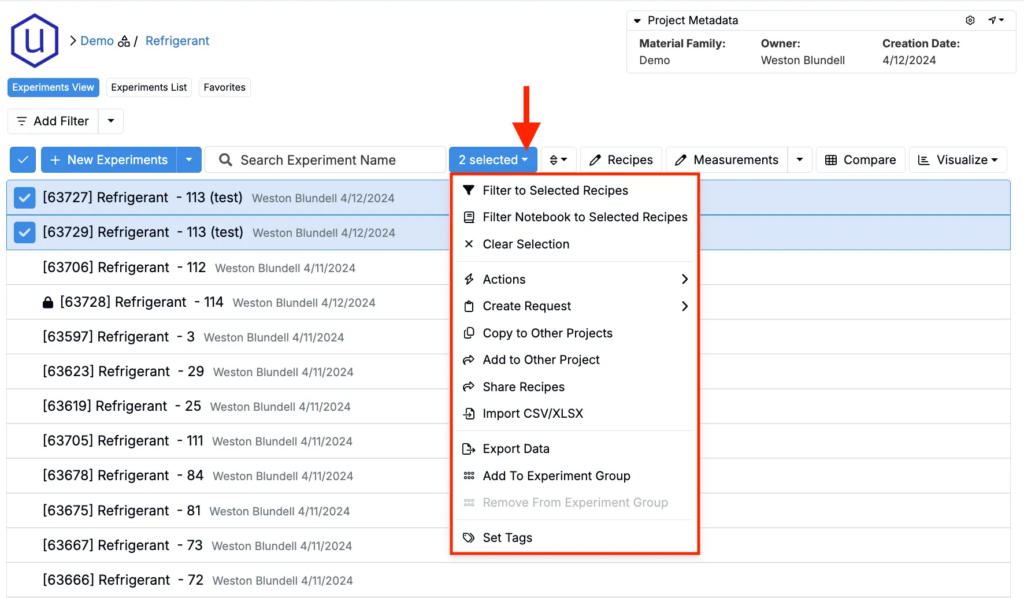
Bulk Actions for Selected Experiments
Once you’ve selected one or more experiments, use the selection menu next to the search bar to take bulk actions:
- Filter to Selected Recipes – Apply a filter on the dashboard to include only the selected experiments
- Filter Notebooks to Selected Recipes – Open a specific notebook with a filter applied for the selected experiments
- Create Requests – Generate a new lab request using the selected experiments
- Copy or Move to Other Projects – Duplicate or transfer selected experiments to another project
- Share Recipes – Share selected experiments with other users. When sharing, you can also choose each user’s level of access
- Export Data – Export data for all, selected, or filtered experiments—including project data, measurement conditions, inputs, and project usage
- Add to Experiment Group – Add the selected experiments to an existing or new experiment group
- Set Tags – Apply or update experiment tags for the selected experiments
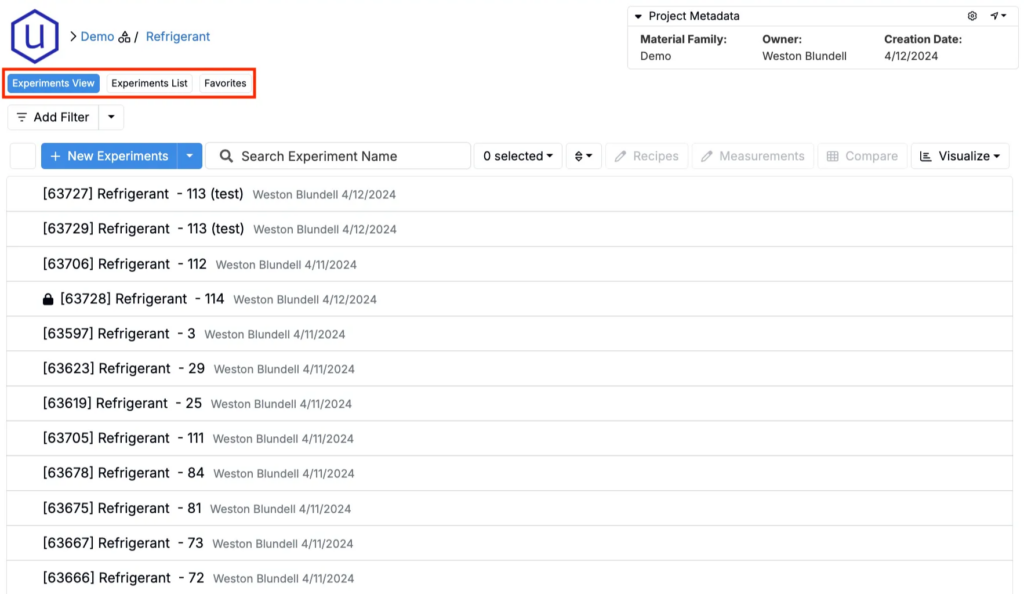
Switching Between Views
The Project Dashboard supports three views, which users can toggle between by clicking the buttons above the dashboard:
- Experiments View (default) – Dashboard-style interface showing experiments in the current project
- Experiment List View – Configurable listing table style view of experiments across all projects and material families.
- Favorites — Quickly access all of your most-used projects and platform pages from every project dashboard view. Learn more
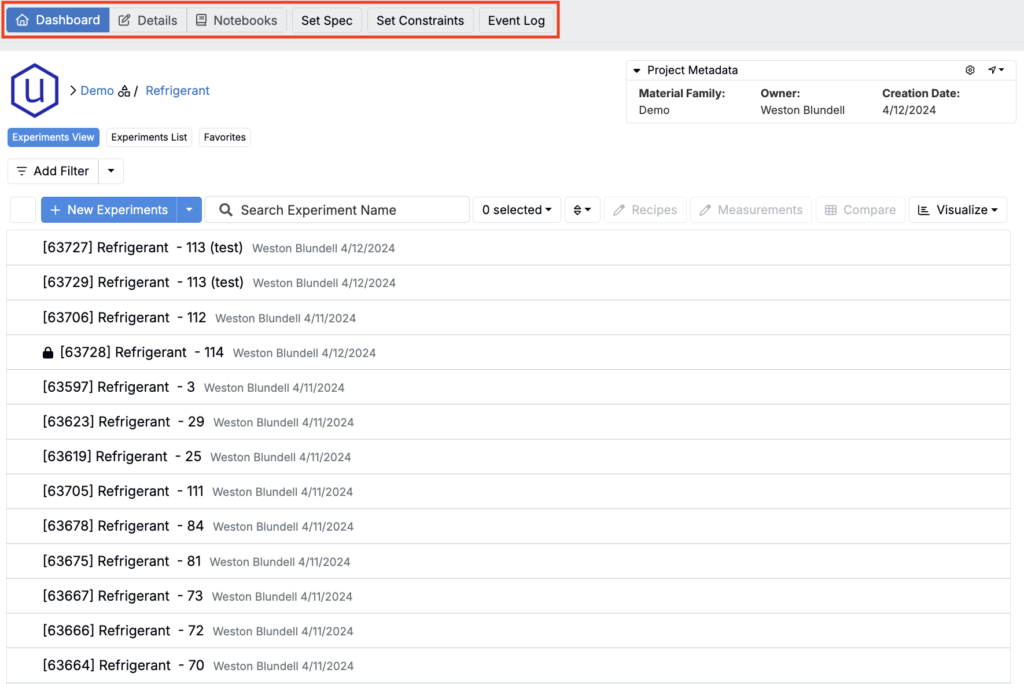
Accessing Project Pages
At the top of the Project Dashboard, you’ll find quick-access links to other pages associated with the current project:
- Dashboard – The main view of the project and all contained experiments
- Details – Displays all project fields added to the project definition in Form Admin
- Notebooks – Lists all notebooks associated with the current project
- Set Spec – Opens the Spec page, where you can define or edit project specifications.
- Set Constraints – Opens the Constraints page, where you can define constraints for the project.
- Event Log – Opens the Event Log modal, which shows a complete history of changes to the project—who made them, what changed, and when.