Uploader UI Improvements
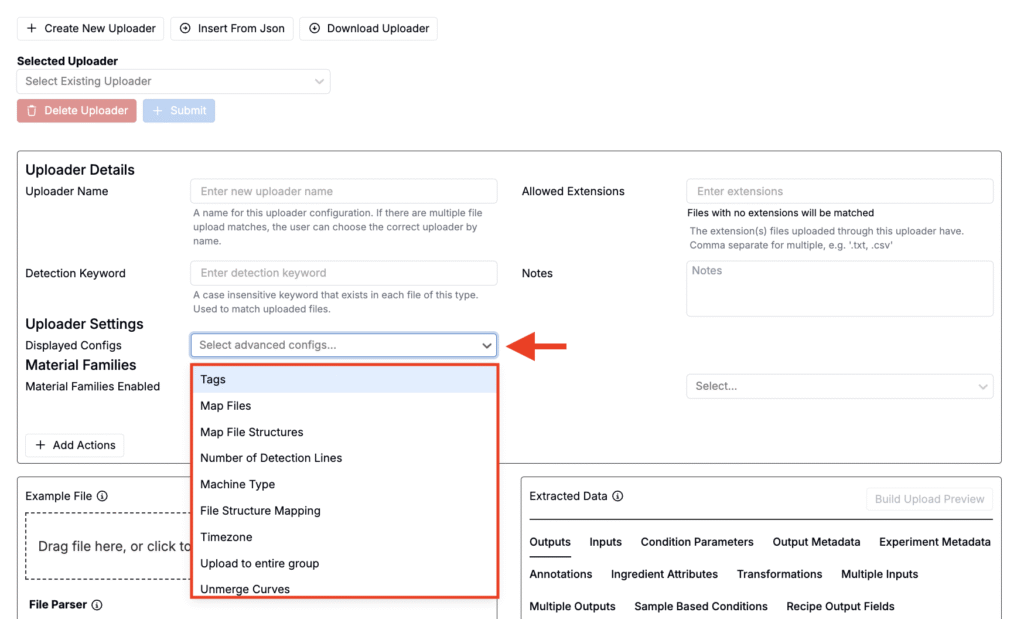
We’ve updated the top section of the uploader to use standard form field styling, improving consistency with the rest of the platform and making fields easier to interact with.
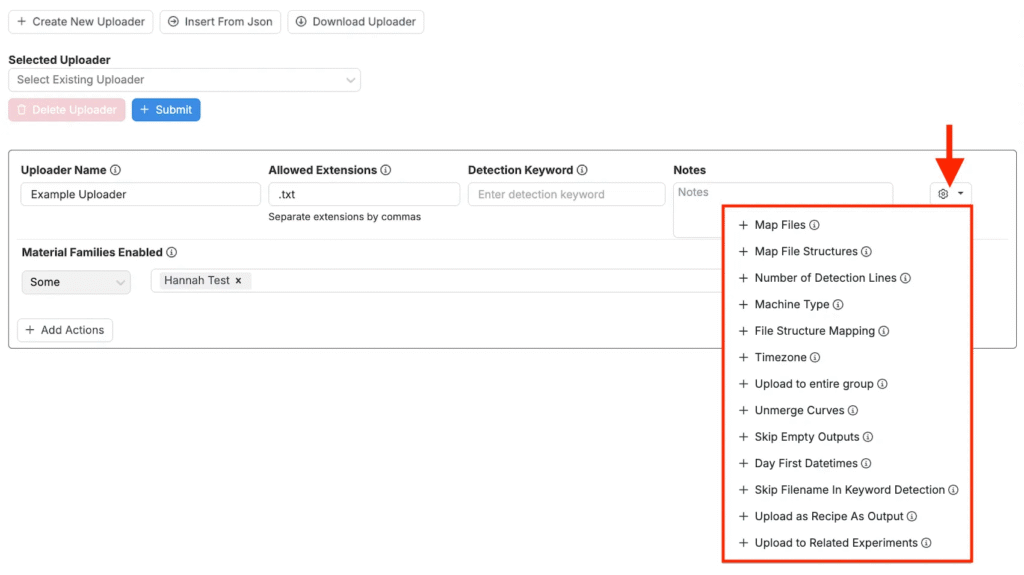
Advanced settings that were previously hidden behind a ⚙️ icon have been moved into a multi-select Displayed Configs menu, making them easier to discover and configure. Use the field to select uploader settings to include as fields for configuration.
Together, these changes make uploader configuration clearer, more reliable, and easier to manage.
Expanded Insert From JSON Support for Uploaders
The Insert From JSON workflow has been significantly expanded, making it easier to move uploaders between schemas and environments. Previously, JSON insert worked reliably only for outputs. It now supports inputs, outputs, output metadata, condition parameters, experiment metadata, and ingredient attributes.
When inserting from JSON:
- Missing outputs and condition parameters are automatically created if they don’t exist in the target schema.
- Inputs, metadata, experiment metadata, and ingredient attributes are matched by name to existing entities in the target schema when possible.
These improvements reduce manual rework when copying uploaders to new schemas and make schema transitions faster and less error-prone.
How to use:
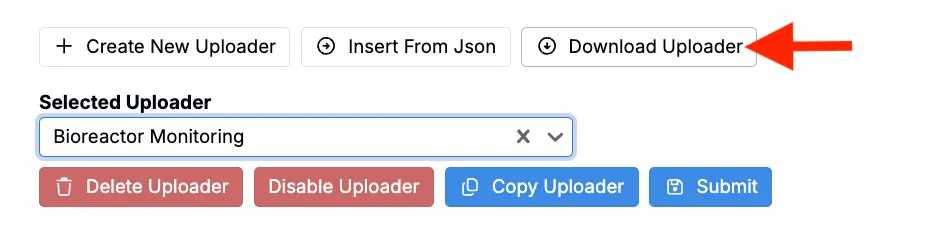
- On an uploader you want to copy, click the Download Uploader option.
- On the new uploader, select Insert From JSON.
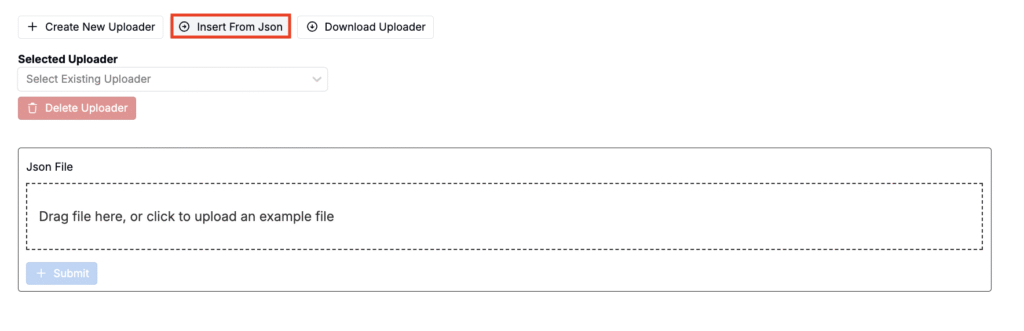
- Upload a previously downloaded JSON file and submit.
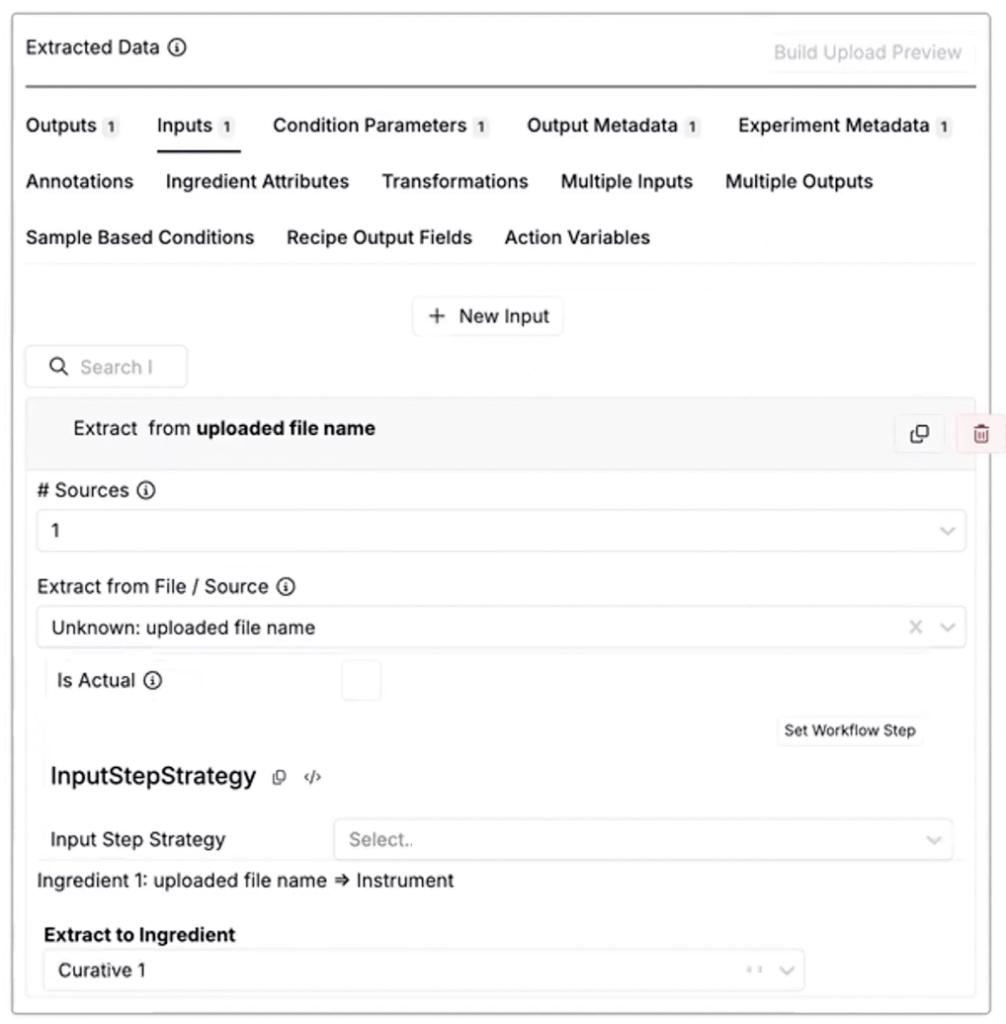
- On the new uploader, use the Extracted Data section to review the automatically created mappings.
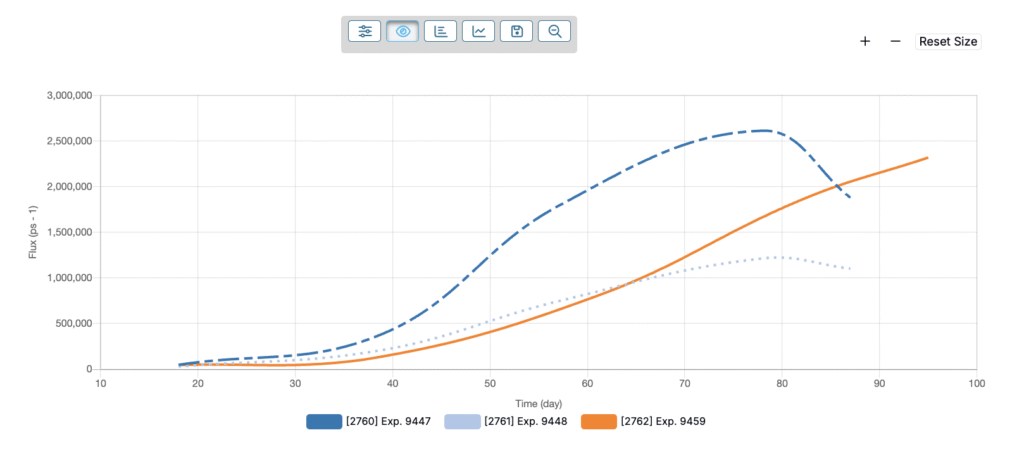
View Curve: Line Styling
View Curve visualizations now let you customize individual line styles (dashed, dotted, solid) to improve visual separation. Styled lines make overlapping or similarly colored datasets easier to read and compare across long time windows.
This is especially useful for multi-instrument runs, before-and-after method changes, and A/B formulation trials where multiple output series are plotted together. The result is faster trend detection and clearer presentations in notebooks and exports.
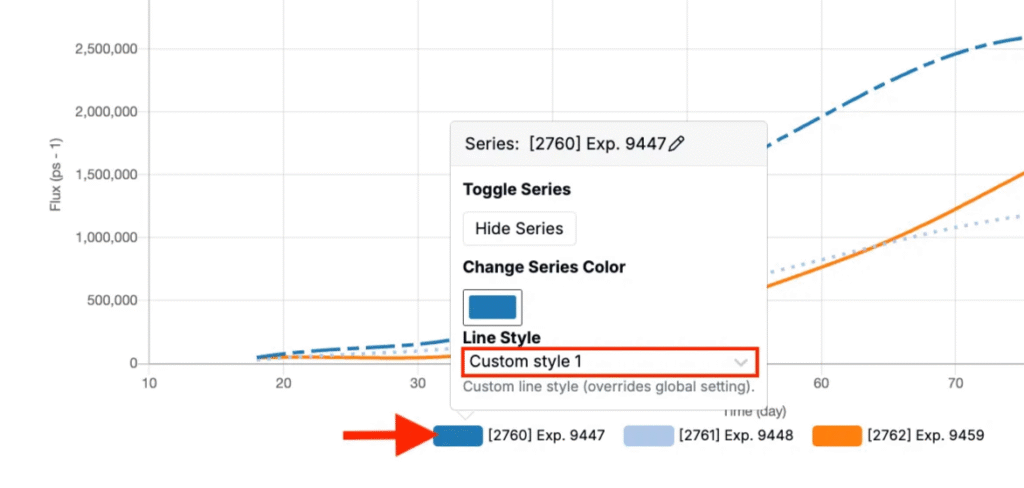
How to use:
- Access View Curve and create or load a curve visualization.
- In the legend, click on any curve.
- In the popover, use the Line Style field to select a custom line style.
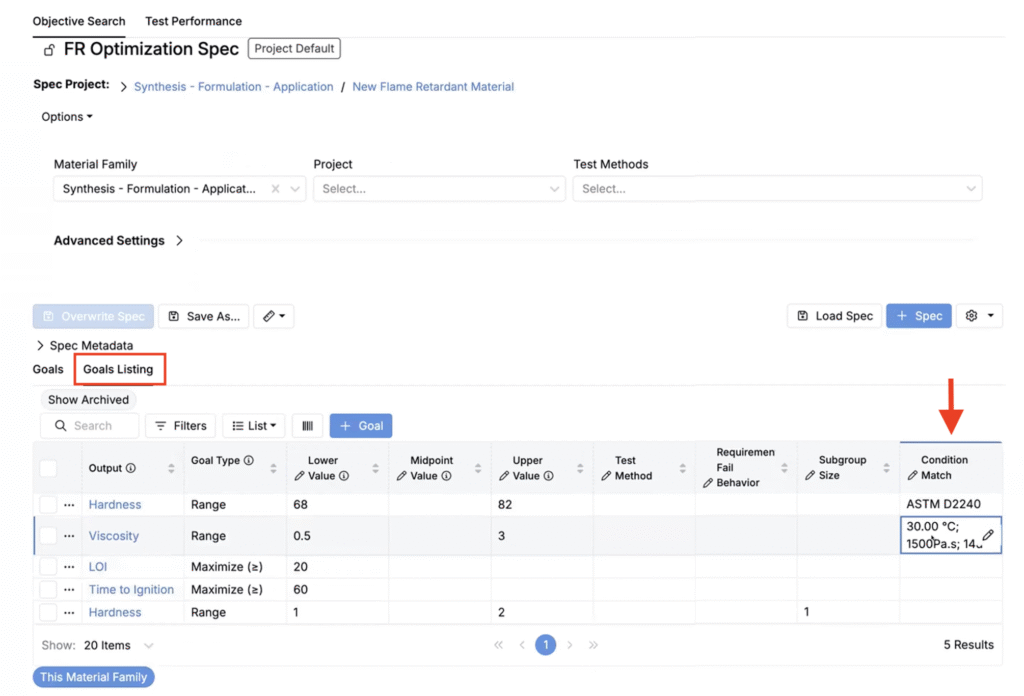
Editable Condition Matches in Goals Listings
Objective Search now supports inline editing of condition matches in the Goals listing, so teams can easily review and update match logic. You can display a Condition Match column and edit individual goal matches inline to keep definitions current as criteria evolve.
This makes it easier to manage goal conditions and reduces context switching, especially when those conditions change over time.
How to use:
- Open the Objective Search tool and load a spec.
- Go to the Goals Listing tab.
- Add a Condition Match column to the table (List > Set Columns).
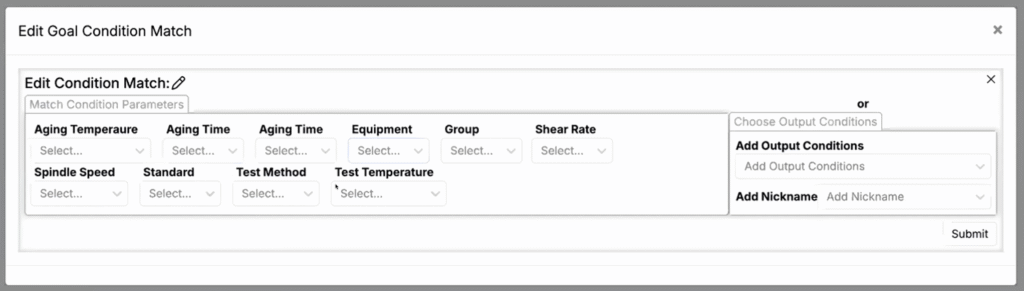
- In that column, click Edit for any goal to add or modify condition matching.
- In the modal, select and add your condition parameters, then submit.
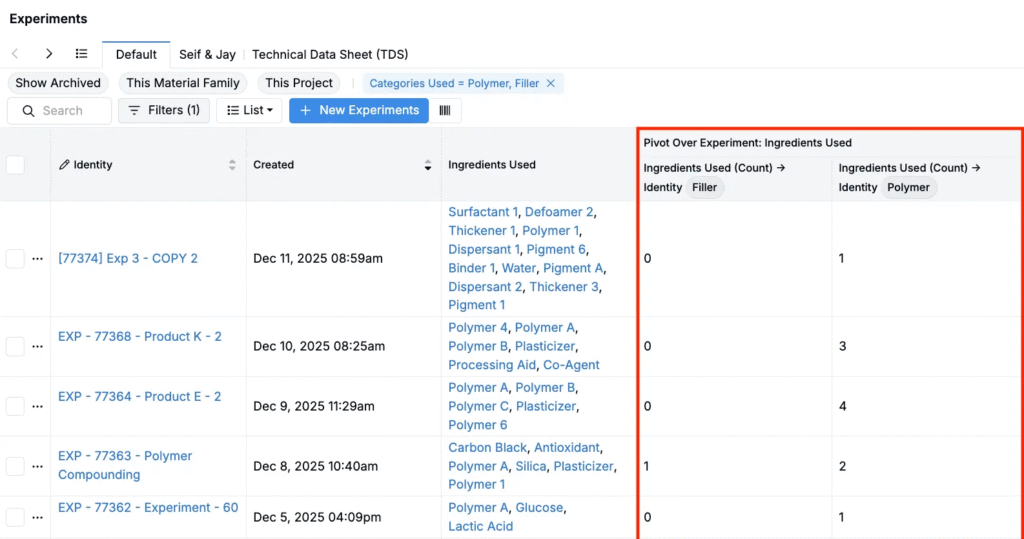
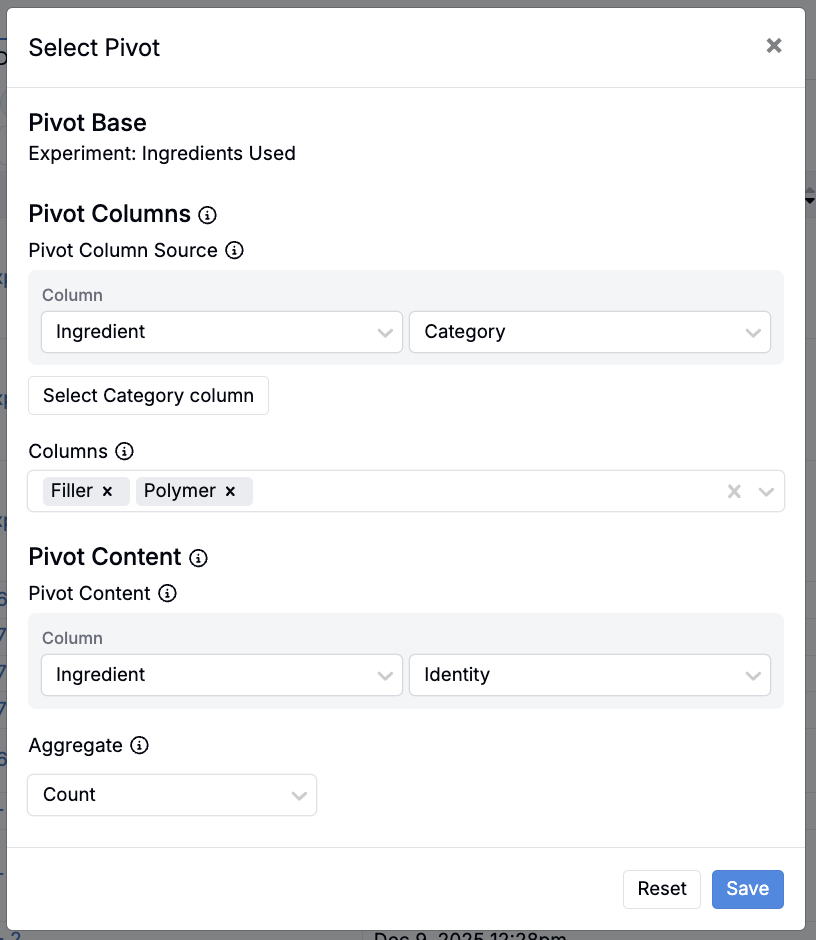
Pivot Columns on Listings
Listings can now create pivot columns from categorical fields, allowing you to break one column into multiple category-specific columns. Each generated column displays a metric, such as a count, restricted to that category.
This update gives users more control over how data is represented in listings and makes it easier to expose complex category structures that previously required deeper inspection.
For example, an experiment listing with an Ingredients Used column can now be transformed into a listing with clear, side-by-side counts for the number of ingredients within select ingredient category, enabling faster comparison across experiments and clearer visibility into how entities are composed.
How to use:
- In a listing, select a column backed by a categorical type (e.g. Ingredients Used).
- Right click on the column header and select Create Pivot Group.
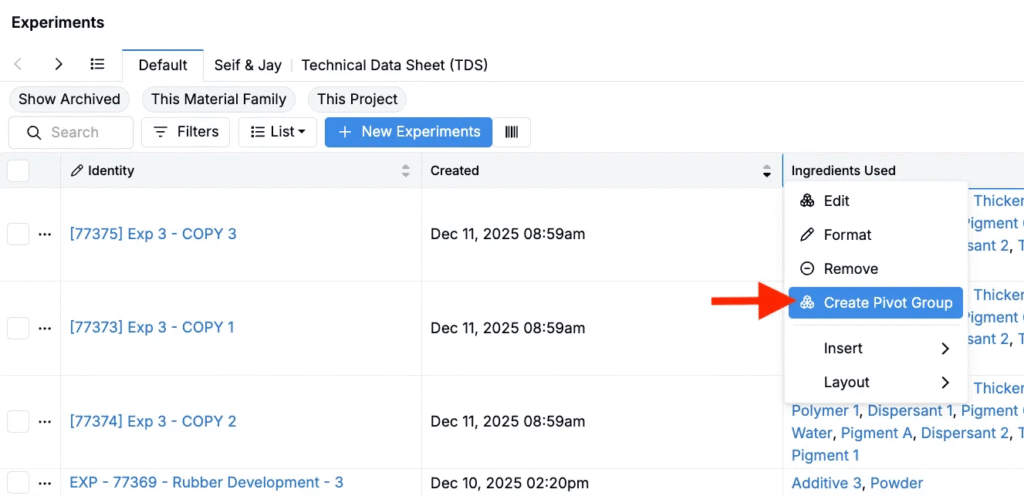
- Set the Pivot Column Source (e.g. Ingredient Category), select the categories to include, and configure the Pivot Content and aggregate (e.g. Ingredient Identity → Count).
- Click Save.
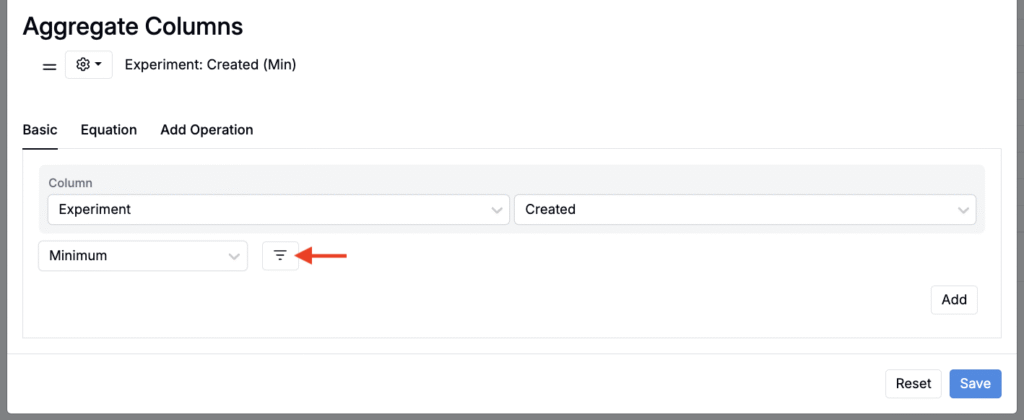
Filters on Aggregate Columns
Users can now apply filters on aggregate columns. This expands the analytical power of aggregated listings and enables filtering on group-level metrics such as averages, counts, or outlier status.
This is especially beneficial for identifying outlier-heavy groups, filtering batches by statistical results, or analyzing grouped experiment summaries.
How to use:
- Access any aggregated listing.
- Within the Select Columns modal (List > Set Columns)
- Add an aggregated listing column.
- Click the Filters icon and add a filter.
- Click Save.
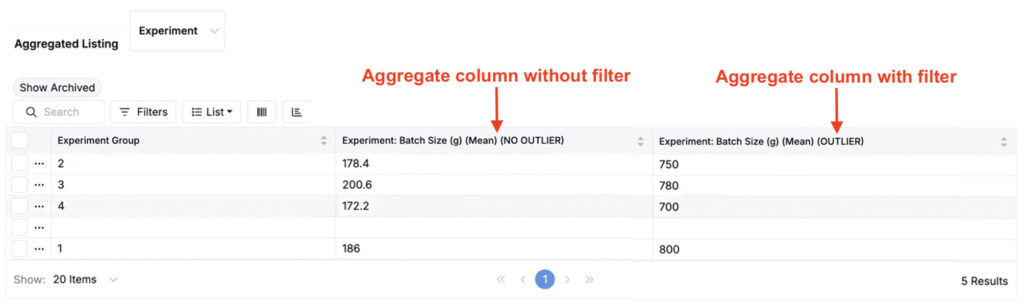
Example:
Use filtered aggregate columns to compare experiment results with and without outliers. Add a grouping column for the entity you want to summarize (e.g. Experiment Group), then add aggregate columns that calculate a metric (e.g. Batch Size) both including outliers and excluding them.
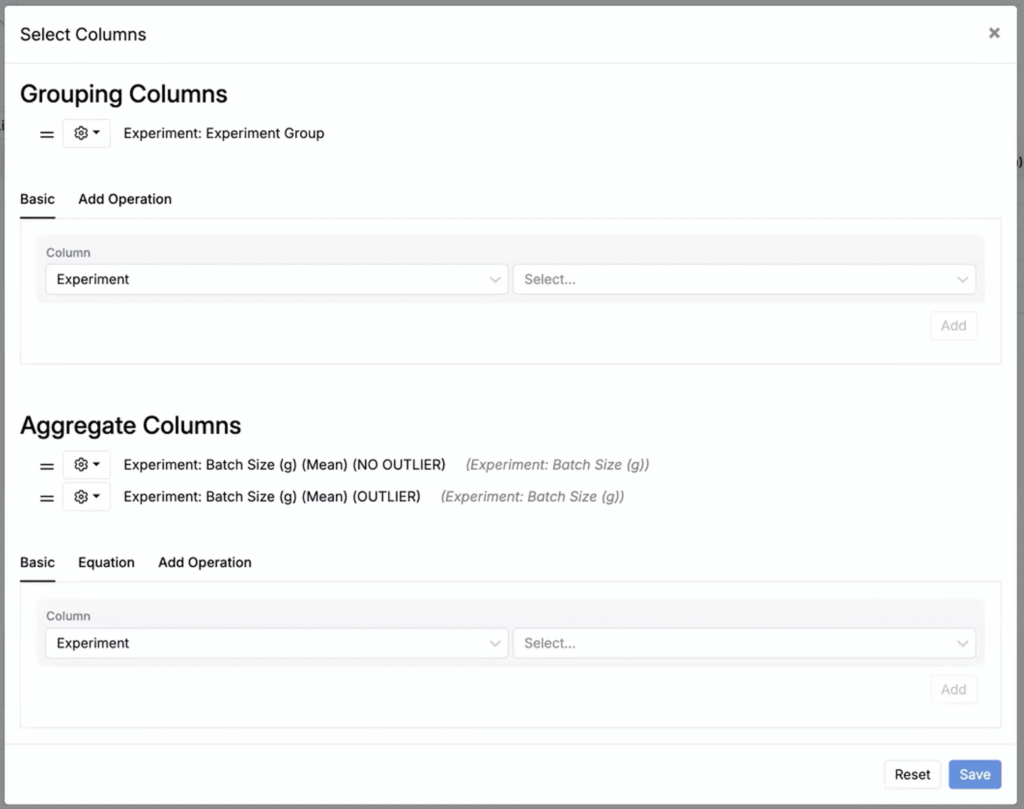
From there, add an “Is Outlier = True” filter to the aggregate column including outliers. The result is a clear, grouped view that helps you quickly identify where outliers are influencing the data.
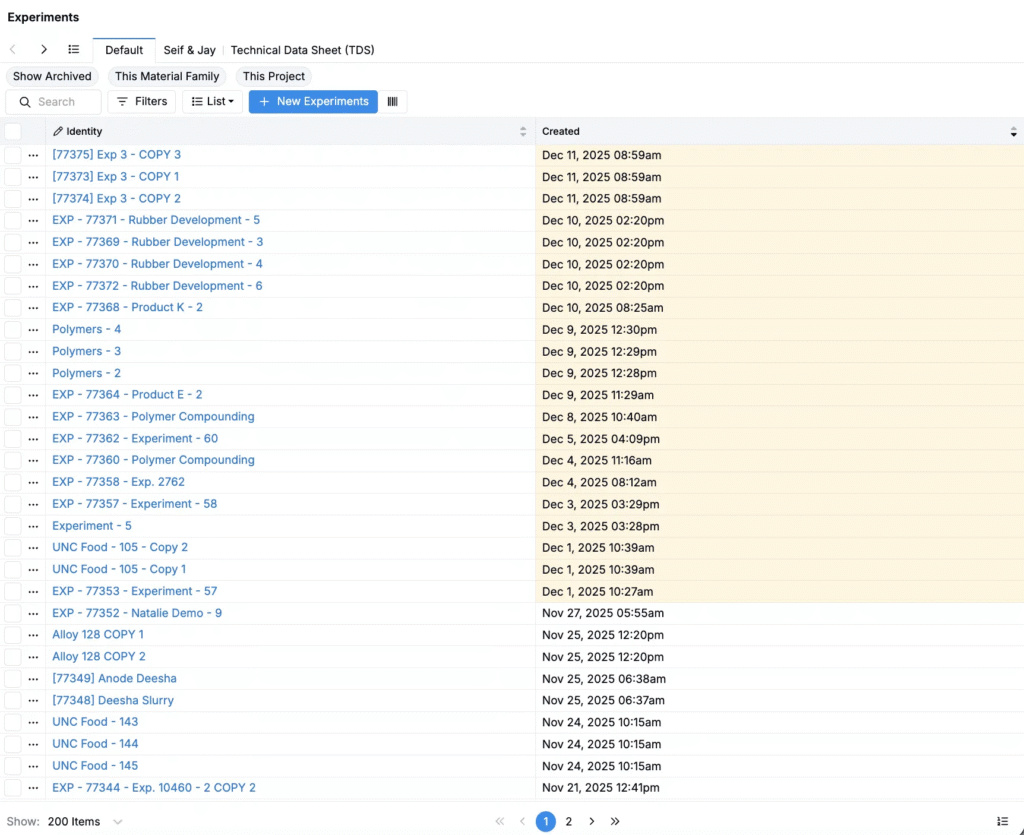
Date-Based Conditional Decorations in Listings
Users can now apply date-range-based decorations to date columns on listings. Highlighting entries based on deadlines, test dates, or reporting periods helps teams quickly identify items that require attention.
Use colors to distinguish upcoming, due, and out-of-window items. Teams can publish shared defaults on dashboards or you can customize your own personal listing views as desired.
How to use:
- On any date column within a listing, right-click and select Format.
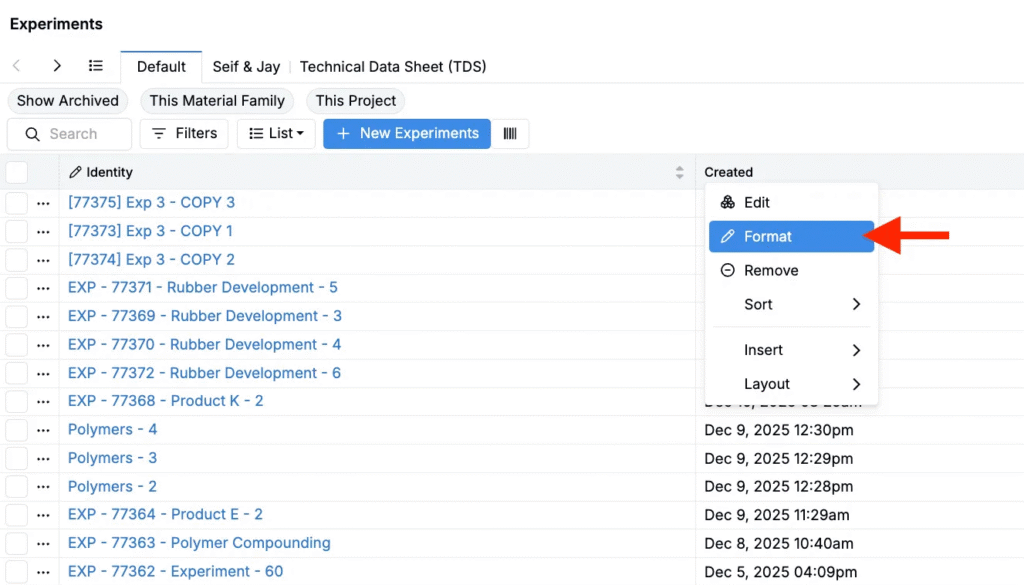
- In the modal, add a Conditional Decoration.
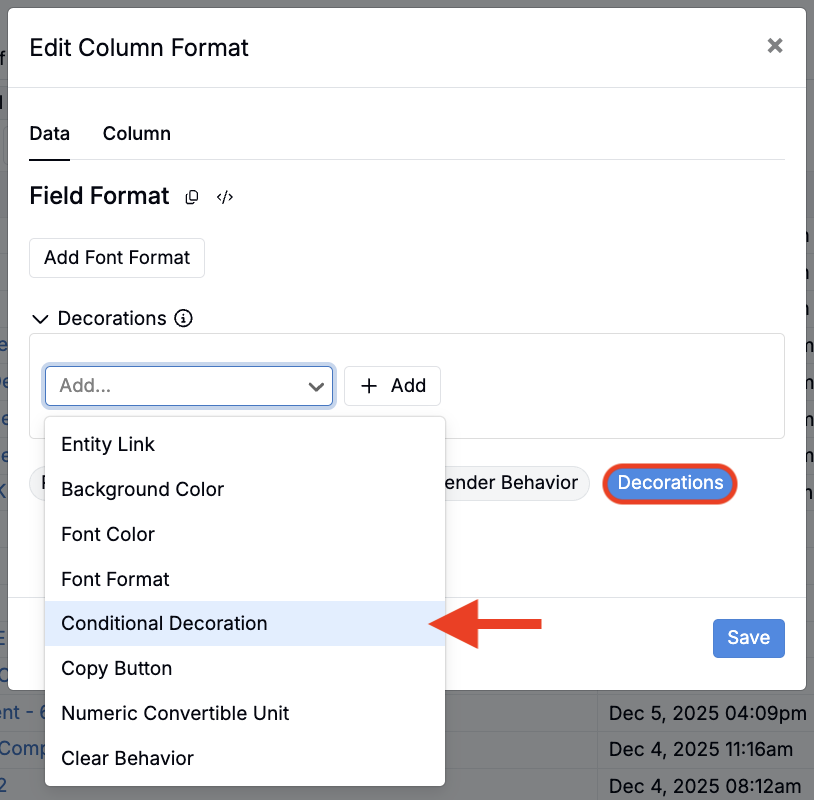
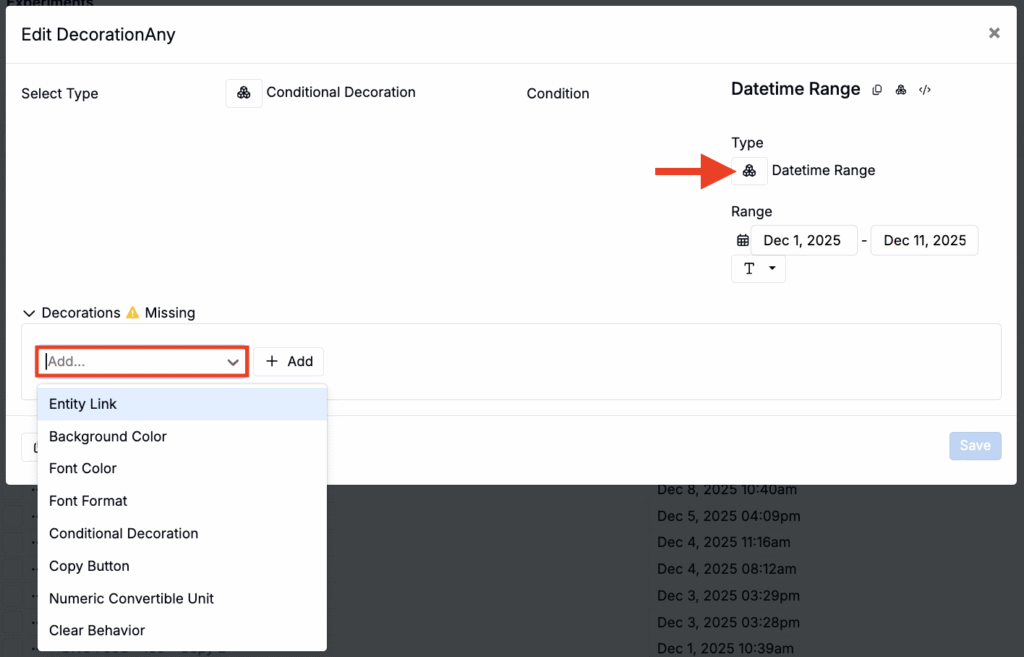
- Set type to Datetime Range and select a range.
- Under Decorations, select the decoration type (e.g. Background Color).
- Click Save.
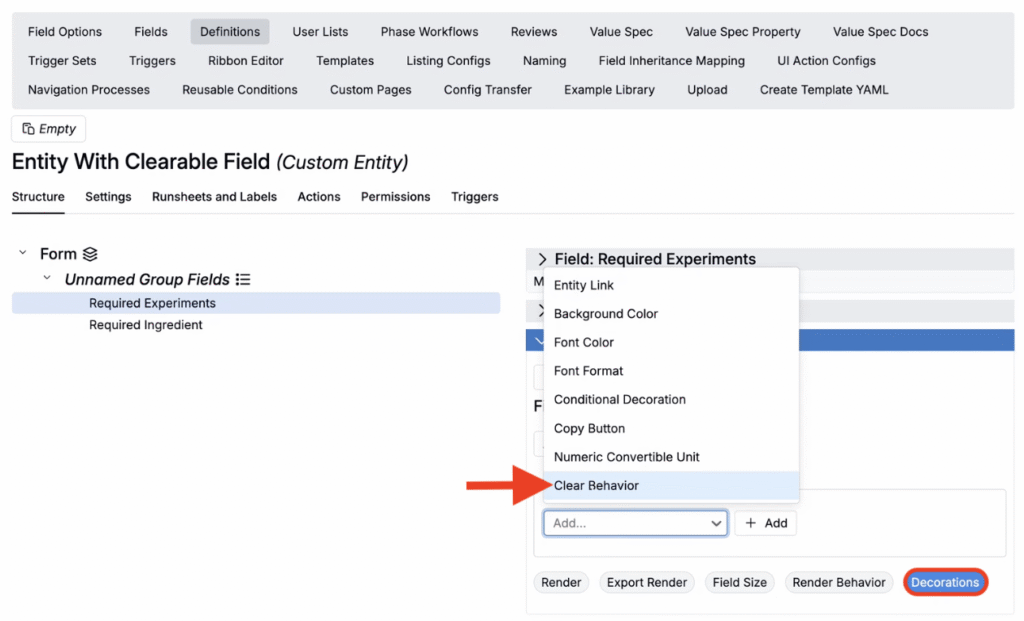
‘Clear Behavior’ Decoration on Select Fields
A new Clear Behavior decoration prevents selected form fields from being fully cleared while keeping them editable. It supports both single‑ and multi‑select fields. For multi‑selects, users can remove items until at least one remains.
This update helps avoid accidental data loss and lock‑outs in workflows where visibility or permissions depend on a field having a value (e.g. required lab, approver, or status fields).
How to use:
- Open a form definition in Form Admin.
- Select the target field (single‑ or multi‑select).
- Under Format Override, click Decorations.
- Add a Clear Behavior decoration.
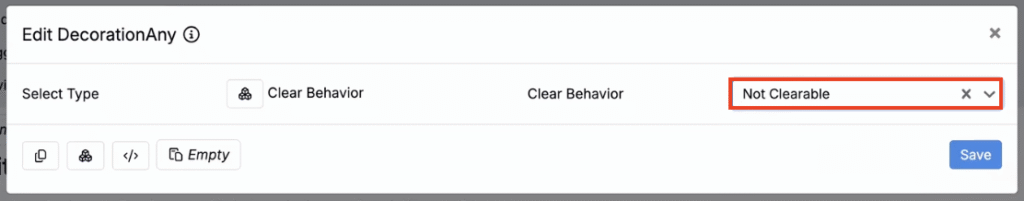
- In the modal, select the behavior (Clearable, Not Clearable, Standard).
- Save the definition.
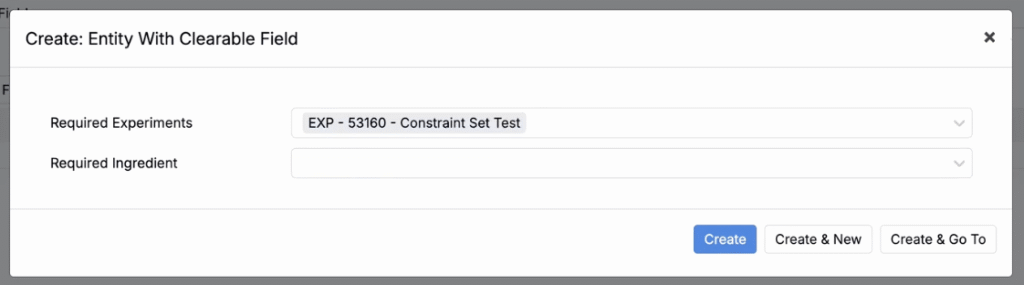
Once this behavior is applied, users can’t fully clear the field on any form created from that definition. A value can only be removed if another value is selected in its place.
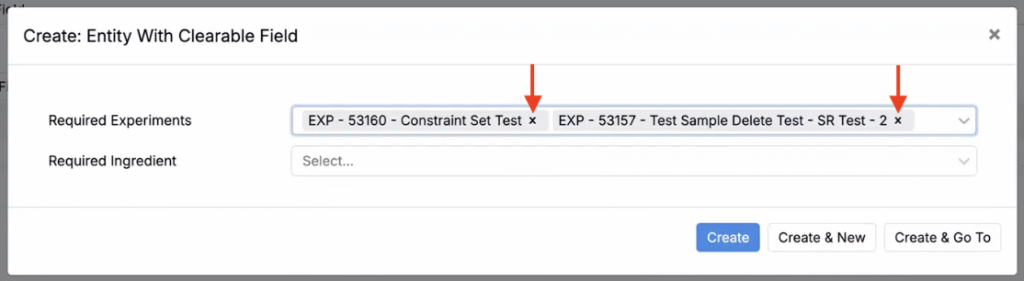
In the example below, the single remaining value in a multi-select field cannot be removed because the clear (X) icon is hidden. When the field has multiple values, the clear icons reappear, allowing users to remove items as long as at least one value remains.
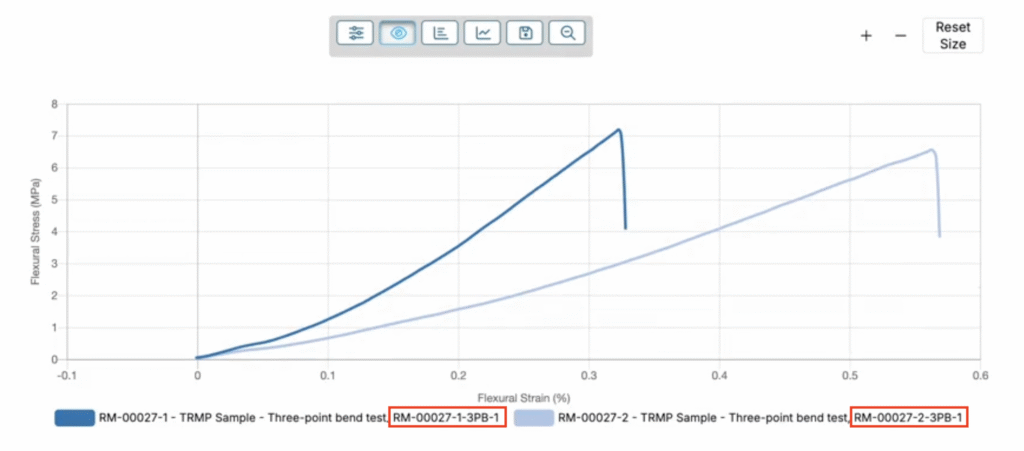
View Curves: Label By for Legend Entries
When visualizing curve data on the View Curves page, you can now add extra context to each curve’s legend using a new Label By option.
This gives additional context to curves and makes multi‑series comparisons easier to scan. Add labels to your curve to display information such as batch IDs, substrates, or test conditions so reviewers can quickly understand which curve corresponds to which data.
How to use:
- Create or load a visualization in View Curves (Visualize > View Curves).
- At the top of the page, use the new Label By field to select an input, output, or metadata field.
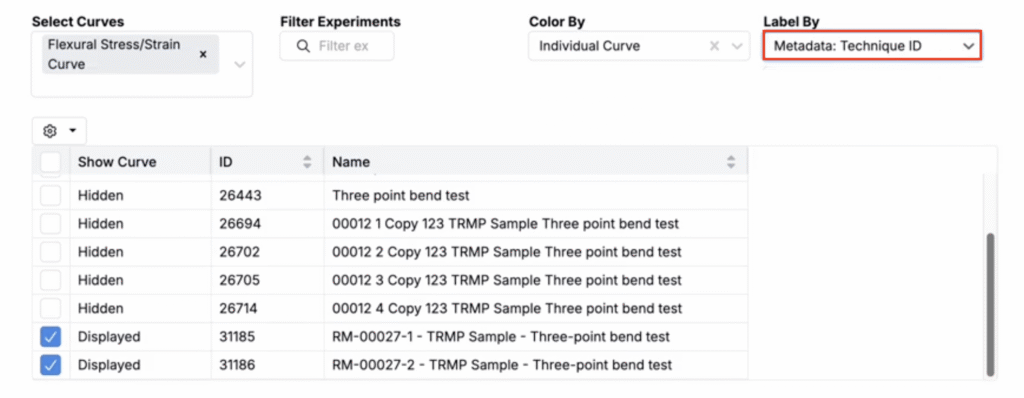
- The selected value will be appended to each legend entry alongside the experiment name.
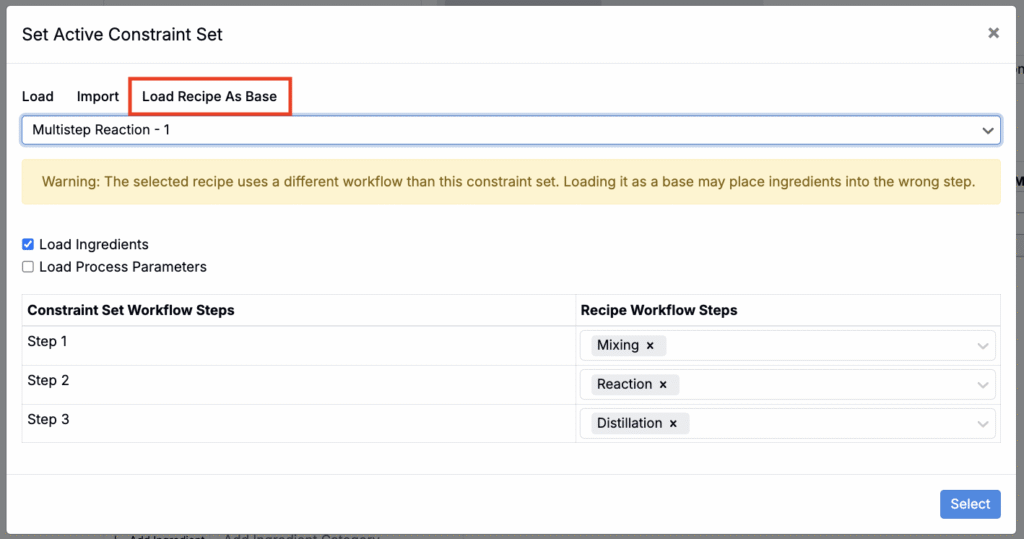
Load Constraints: Map Steps Across Different Workflows
When creating a constraint set on the Constraints page, you can load a recipe as a base to prefill inputs. Now, if the loaded recipe uses a different workflow, you can map constraint workflow steps to the recipe’s steps before applying.
Teams frequently reuse constraints from reference recipes in other workflows. By adding step mapping, Uncountable users can speed migrations and comparisons across workflows.
How to use
- Open the Constraints set for your project (Calculate > Set Constraints).
- Click Load Constraints.
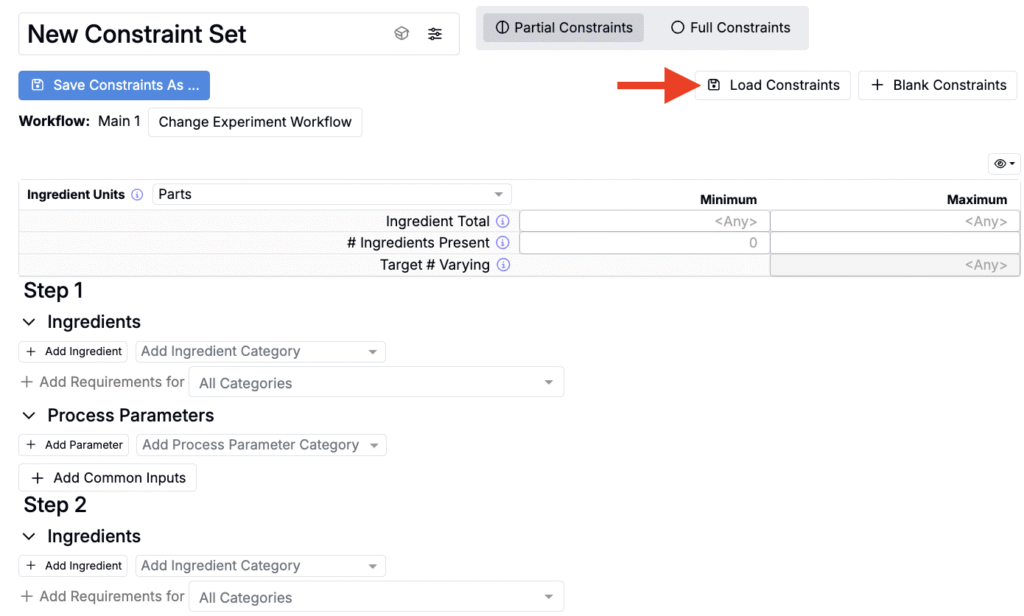
- In the modal, select the Load Recipe as Base tab.
- Select a recipe.
- Review and adjust step mappings.
- Click Select.
Auto‑Dispose Inventory
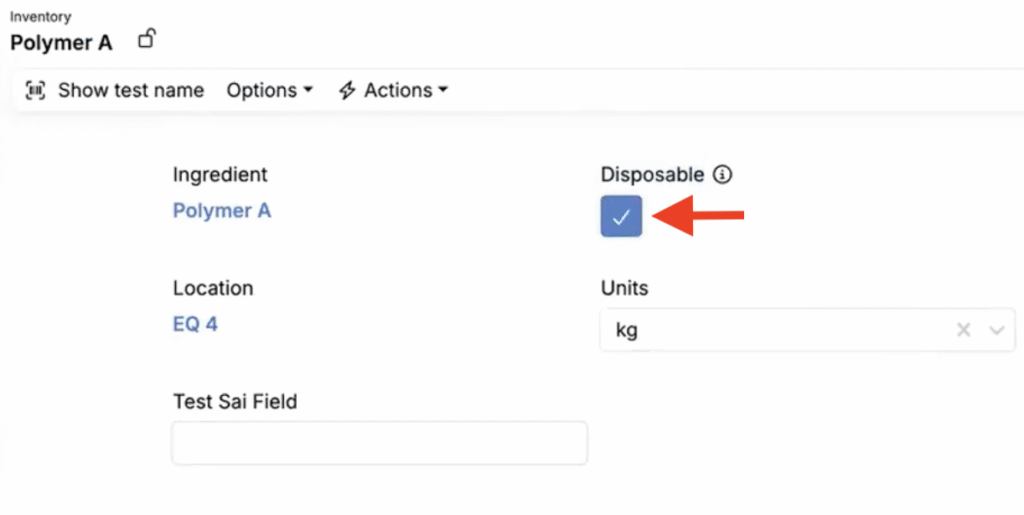
We’ve recently added a Disposable flag to inventory items that, when enabled, automatically prompts users to dispose of the item once quantity reaches 0 (or below). This behavior is enforced consistently when decrementing, moving, or splitting inventory lots.
The goal is to prevent ‘ghost’ stock from lingering and to standardize disposal handling without relying on manual cleanup.
How to use:
- In your inventory item, set the Disposable field to true.
- Reduce quantity via any supported action (decrement from Recipe, Move, or Split).
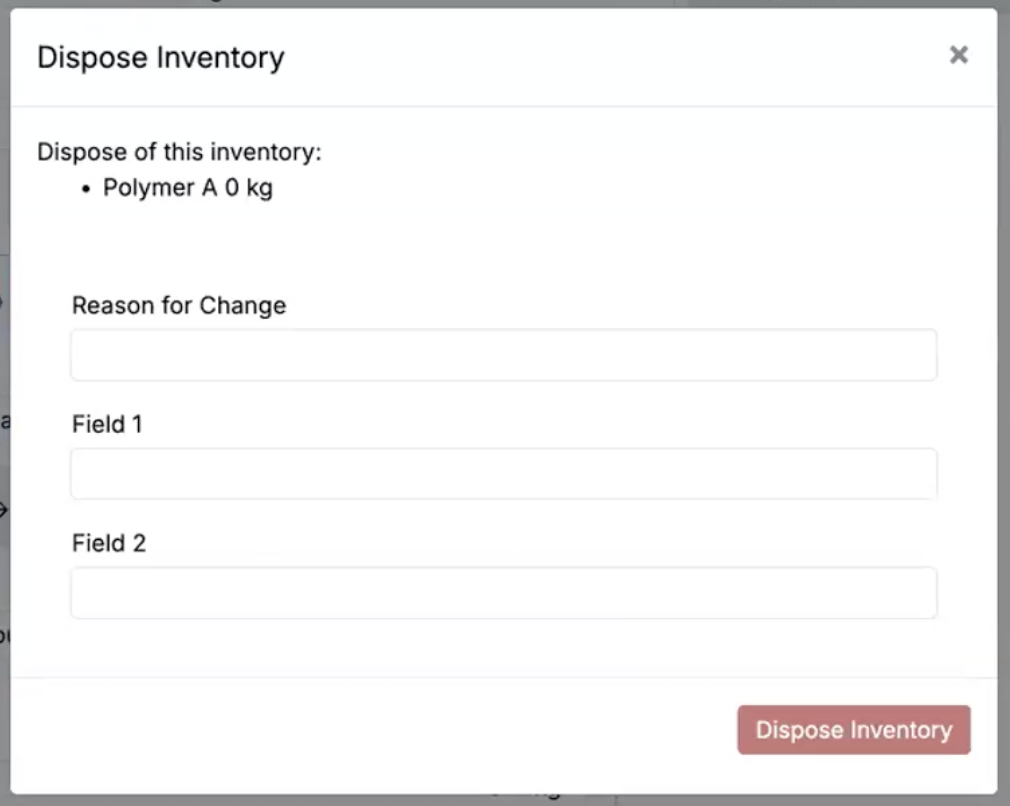
- When the net quantity reaches 0 or less, a Dispose Inventory modal appears to confirm the operation and capture context.
- Submit to finalize the disposal and update records accordingly.
Aggregated Listings: Count Distinct Time Periods
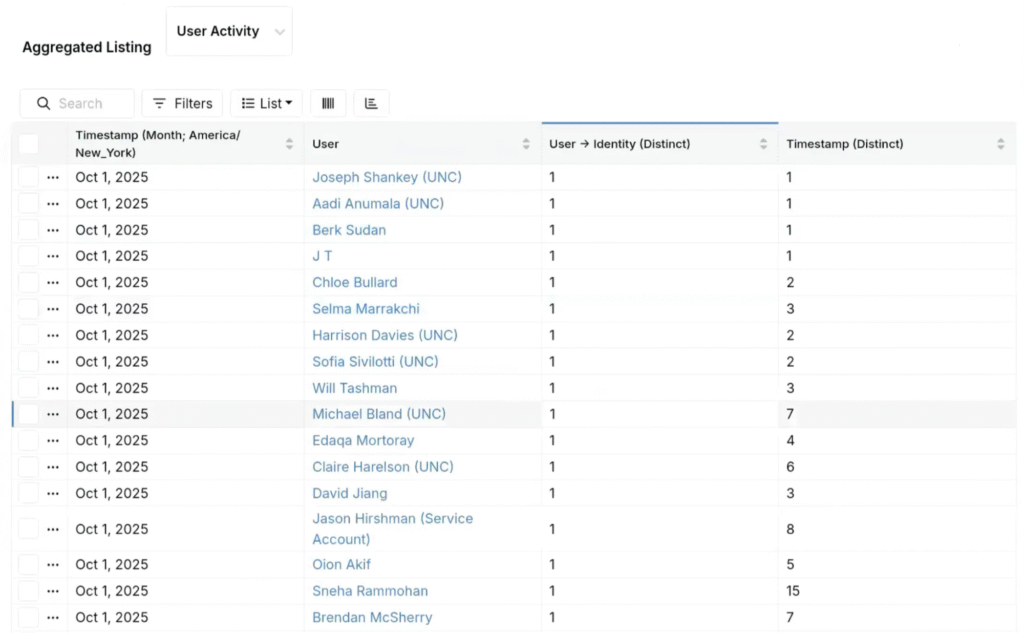
Aggregated listings can now compute distinct counts over calendar periods for any datetime column. This is useful for KPIs like “active days per user per month” or “unique months with submissions.”
This update enables period-aware distinct counts inline in listings, eliminating extra steps. It streamlines activity and utilization reporting and supports cohort-style summaries by user, project, equipment, or line.
How to use:
- Open or create an aggregated listing that includes at least one datetime column.
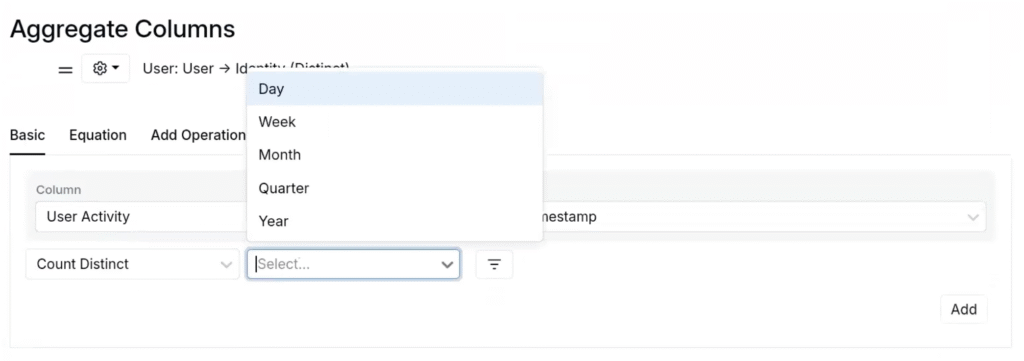
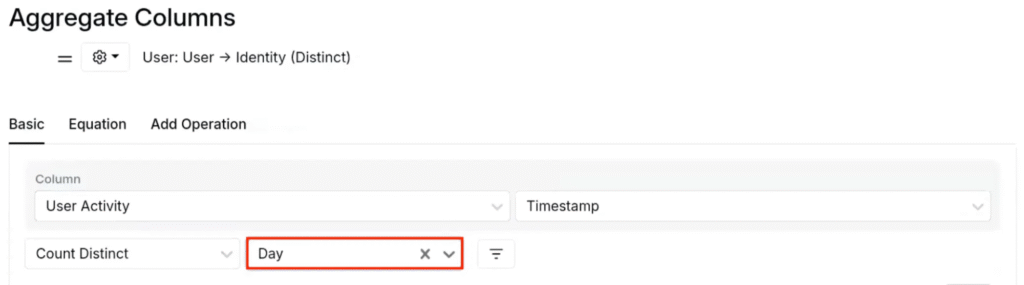
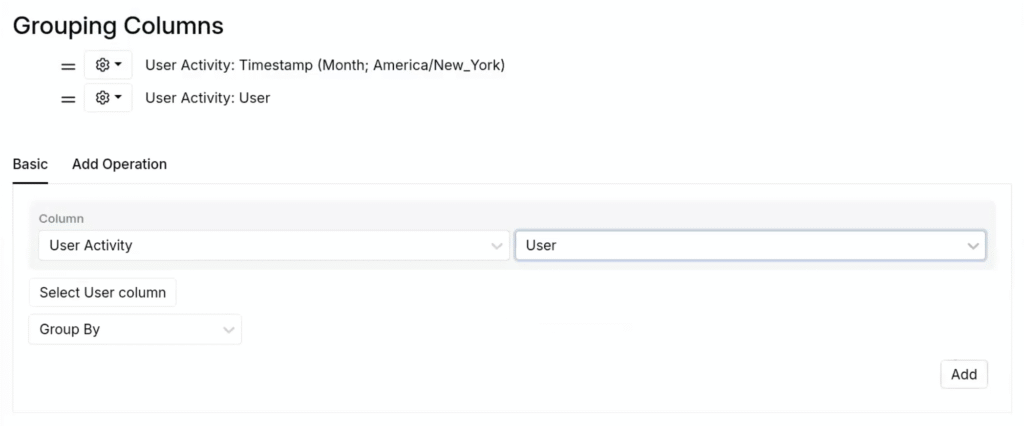
- In the configuration modal (List > Set Columns), choose Count Distinct for the datetime aggregate column.
- Select a period granularity: Day, Week, Month, Quarter, or Year.
- Optionally add grouping columns for user, project, equipment, or other dimensions to produce per-entity period counts.
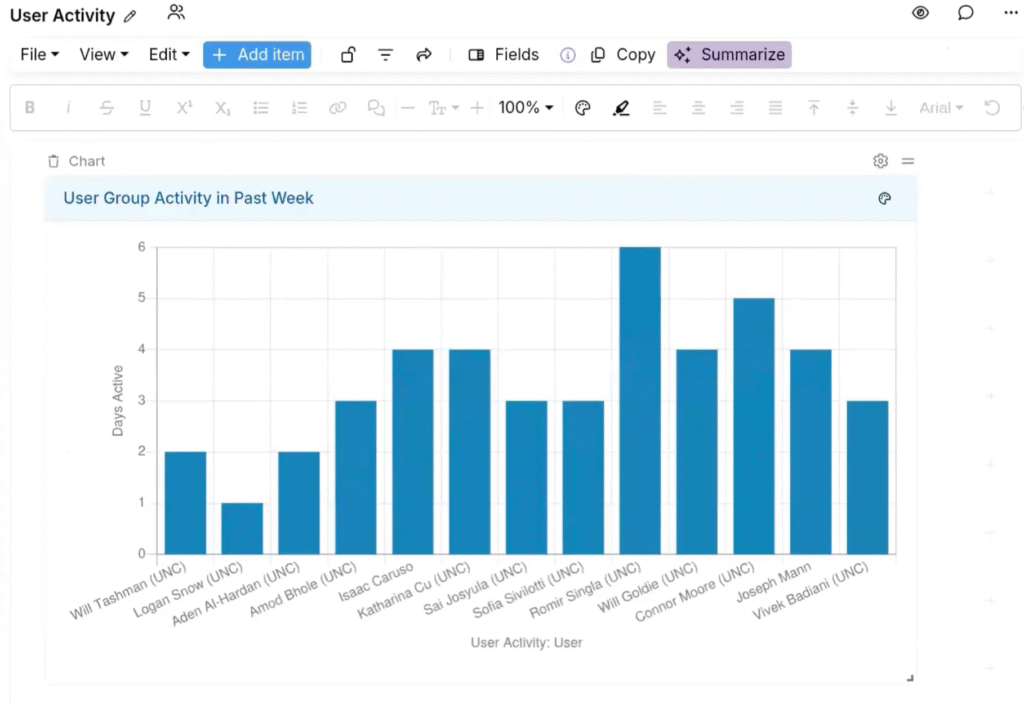
- Save and reuse the listing in notebooks or charts to visualize activity over time.
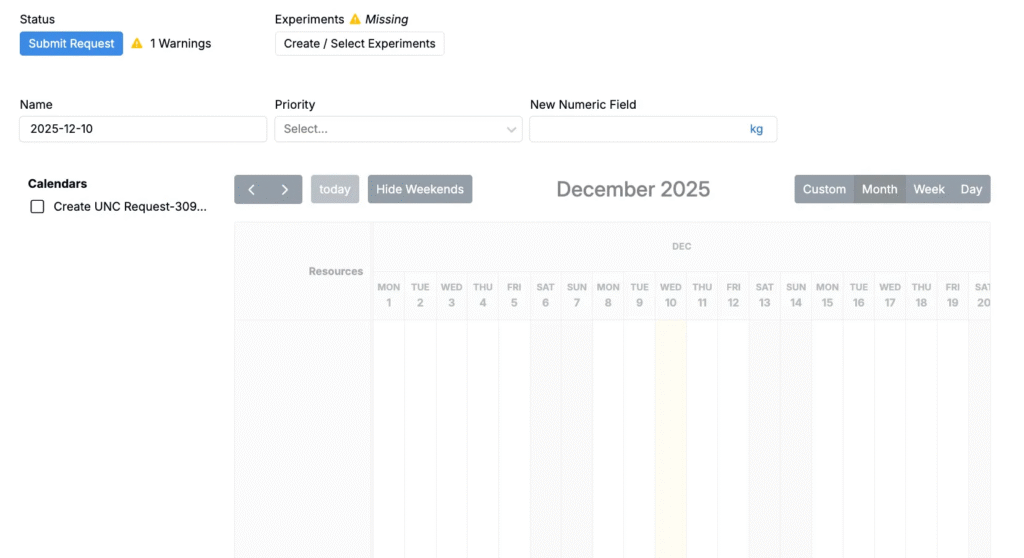
Lab Requests: Resource Timeline View
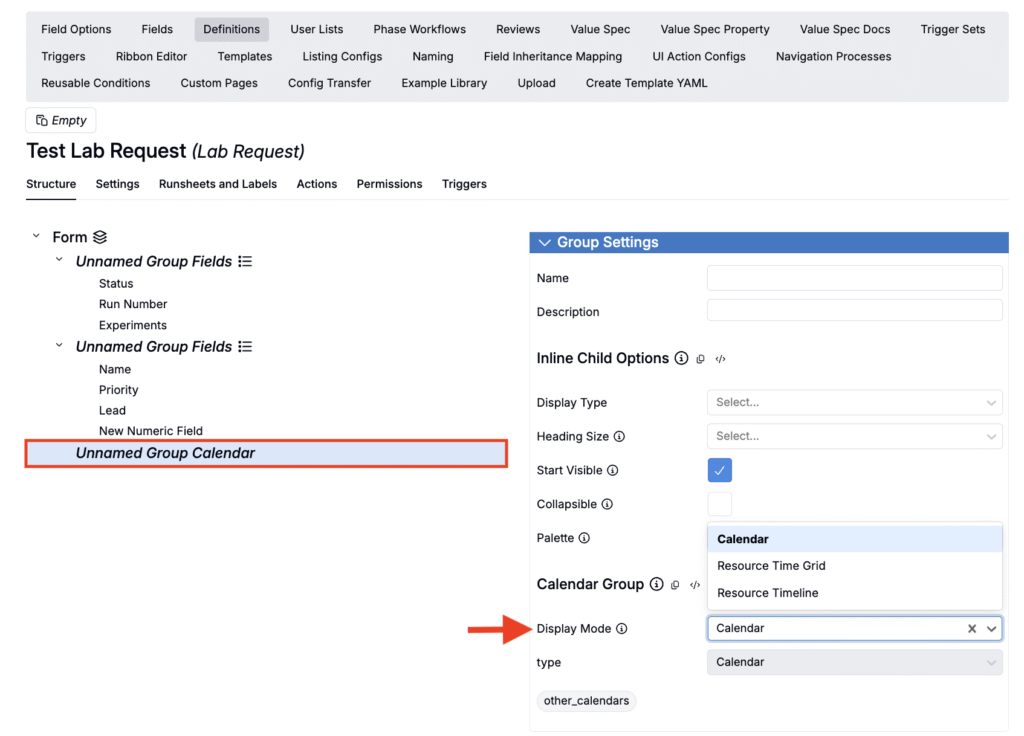
Lab requests now support multiple schedule visualization display modes: Calendar, Resource Timeline, and Timeline Grid.
Resource Timeline calendars make it easier to balance equipment load, avoid overbooking, and spot idle capacity across modules. Add a resource timeline calendar to your request definition to improve lab planning, shift handoffs, and prevent scheduling conflicts.
How to use:
- Access the lab request definition on Form Admin.
- Add or edit a Calendar group.
- In the Display Mode field, select from the available options.
- Once set, any new request generated using that definition will include the selected calendar type.
Configure Columns by Workflow Step
On the recipe view of experiments, you can now display different columns (attributes, calculations, recipe step fields) based on workflow step. Previously, all columns appeared across all steps, even when certain ones were relevant only to specific stages of a process.
This update simplifies the recipe view by reducing the total number of columns that must be displayed. It will be useful for any workflow where data requirements differ from step to step.
How to use:
- On the recipe view of experiments, open the Workflow Step Columns Sidepanel (Search Actions > “Workflow Step Columns Sidepanel”).
- Under Global Columns, assign each attribute column to the workflow step where it should appear (e.g. display the attribute column pH for Step One and MW for Step 3).
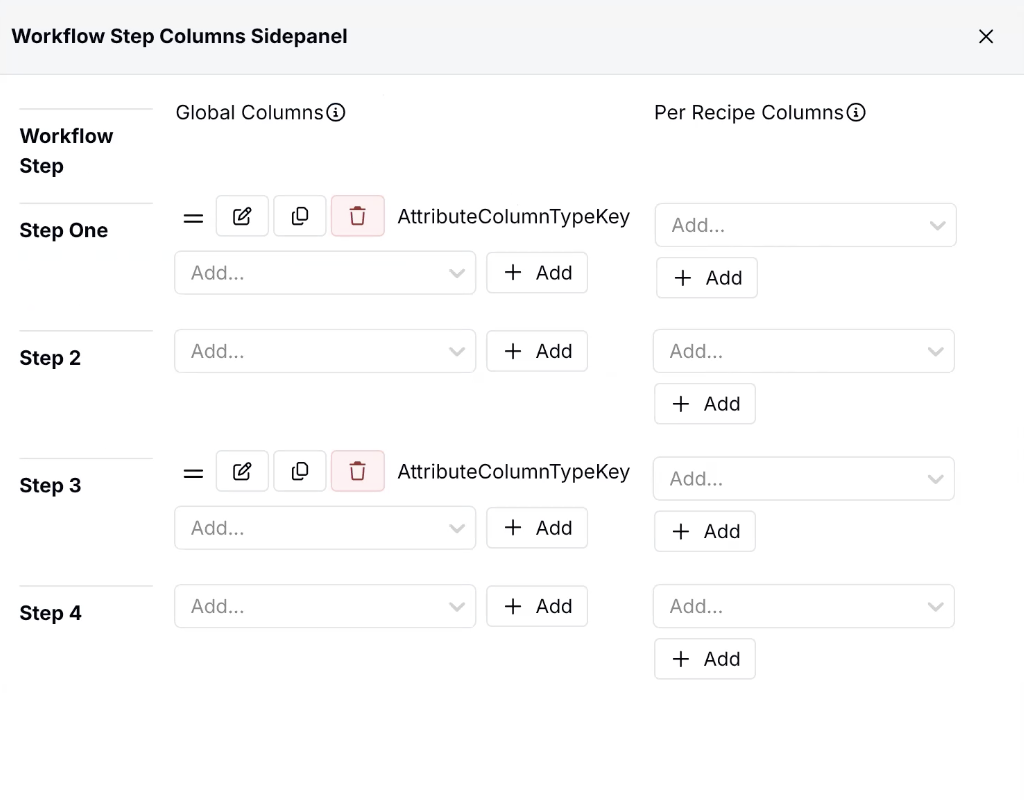
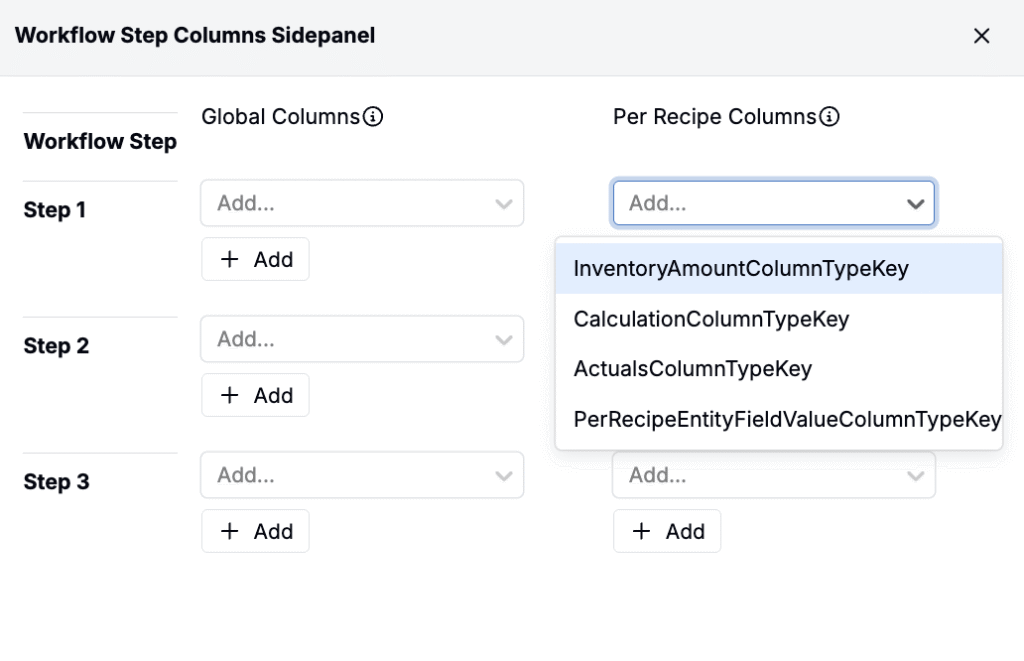
- Under Per Recipe Columns, you can also include Inventory Amounts, Column Calculations, Actuals, and Entity Field columns specific to each recipe.
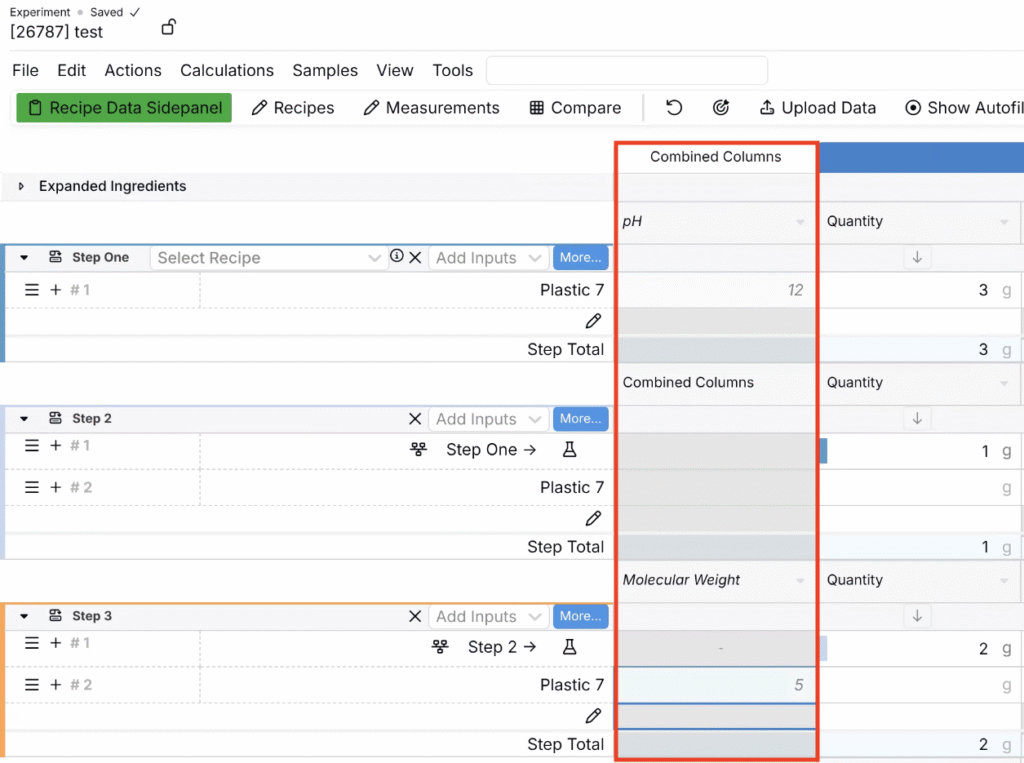
- Once you’ve selected the attribute columns, they’ll automatically appear in a single combined column, with each step showing only its relevant attributes.
- Note: For each workflow step, the relevant attribute appears as a header within the combined column. For steps without an assigned attribute, the header reads “Combined Columns”.
Edit Reaction Tables Directly Through ChemDrawer
Notebook Reaction Table cells now support editing using ChemDrawer. After modifications are made on the reaction diagram, the system displays a summary of additions, removals, and structural updates. Once reviewed, you can then apply those changes to the reaction table.
This method offers an alternative to editing the Reaction Table manually and will benefit teams who regularly update reaction definitions or adjust stoichiometries and structures.
How to use:
- Open a Reaction Table and select Edit Drawing.
- Update the reaction in ChemDrawer.
- Click Update.
- In the Review Reaction Table Changes modal, review all updates and click Apply Changes.
- Once applied, the Reaction Table will update to reflect your changes.
Quick Add Molecule in Reaction Tables
A quick add row has been added to the Notebook Reaction Table cells, allowing users to type molecules directly into a blank row to search and insert them. This reduces the number of clicks needed to add reactants, products, catalysts, or solvents.
This improvement accelerates reaction formulation and supports workflows where structures are defined on the fly.
How to use:
- Locate the default empty row at the bottom of each section of the Reaction Table.
- Begin typing a molecule name or identifier.
- Select a result to insert it into the table.
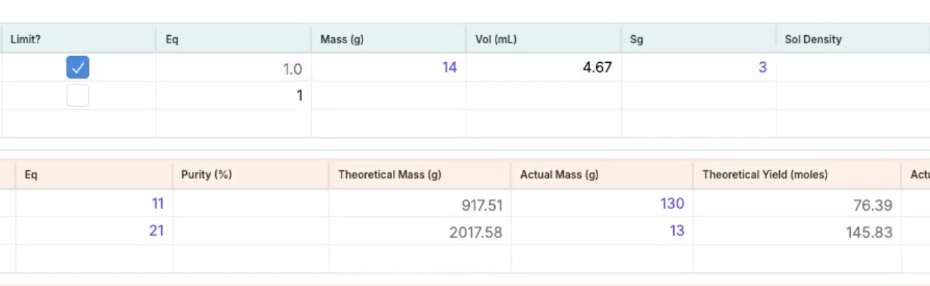
Distinguish User-Entered vs. Calculated Values in Reaction Tables
On the Reaction Table, user-entered values now appear in purple, while system-calculated values appear in black. This distinction clarifies which measurements were entered directly and which were derived from stoichiometric rules or property relationships.
This update improves auditability of reaction inputs, particularly for workflows involving mass/volume conversions, specific gravity calculations, or back-calculated quantities.
Undo Support in ChemDrawer
ChemDrawer also now includes an Undo and Redo function for structural edits. This change is intended to reduce rework and accidental loss of progress during drawing.
How to use:
- Open a drawing in ChemDrawer.
- Use the Undo button to revert the most recent change.
- Use the Redo button to reapply the most recent undone change.
Multi-Condition Parameter Support on a Single Axis in Visualizations
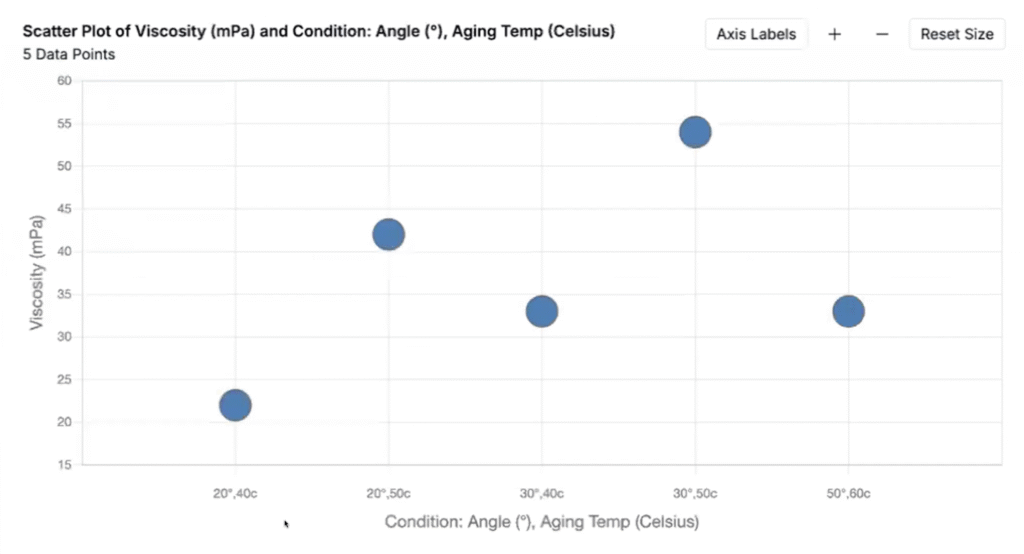
Explore Data visualizations now support placing multiple condition parameters on a single axis. When more than one condition parameter is selected, the platform automatically generates a combined categorical axis representing each unique parameter combination.
This enhancement is intended for datasets where outputs are measured under multi-variable test conditions, such as viscosity measured across different angles and temperatures, curing behavior measured under temperature and humidity, or performance metrics evaluated across multiple chamber settings. Previously, these combinations could only be visualized separately; now they can be grouped and compared within a single chart.
Note that only data points with values for all selected condition parameters are included in the plot.
How to use:
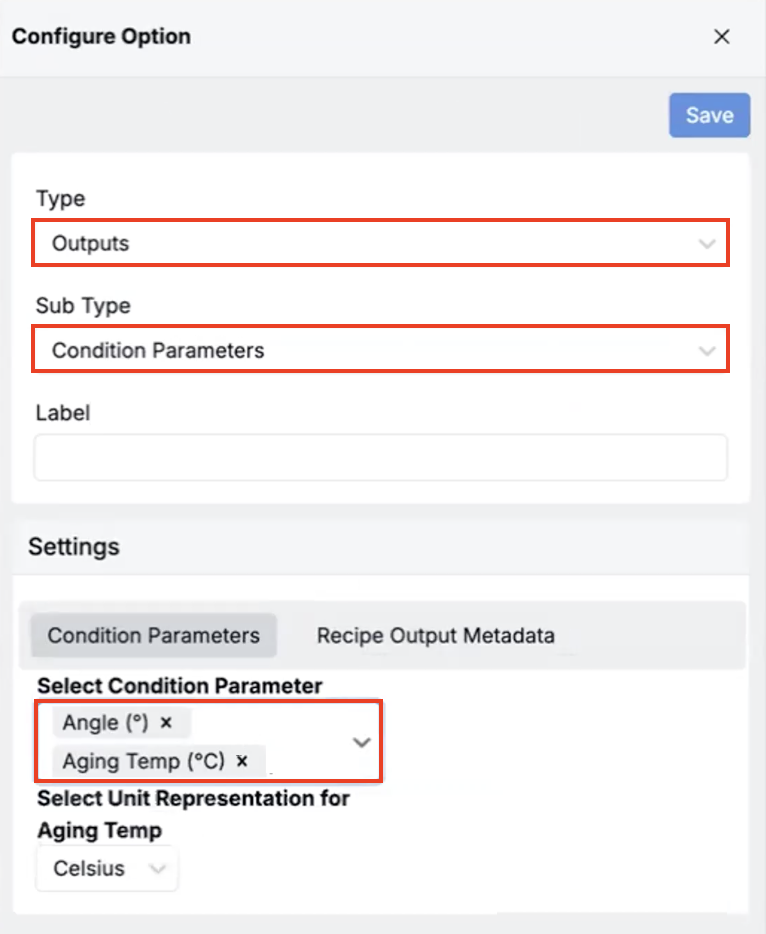
- In Explore Data, open the Options side panel.
- Add a new output and set Type to Output and Sub Type to Condition Parameter.
- In the Select Condition Parameter field, select parameter combinations using the multi-select control.
- Click Save. The option can now be assigned to an axis
Disable Create Buttons on Notebook-Embedded Listings
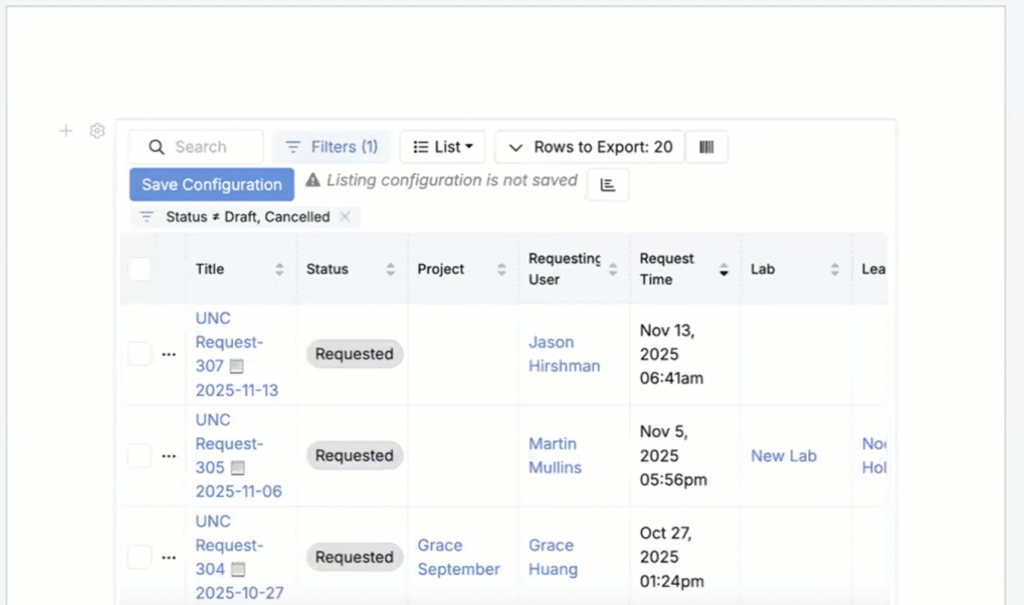
You can now disable the Create button when embedding structured listing cells in notebooks or dashboards. For example, you might add a structured listing cell to display equipment and its status without allowing users to create new equipment from that view.
This update ensures users follow predefined creation pathways instead and simplifies the structured listing cell.
How to use:
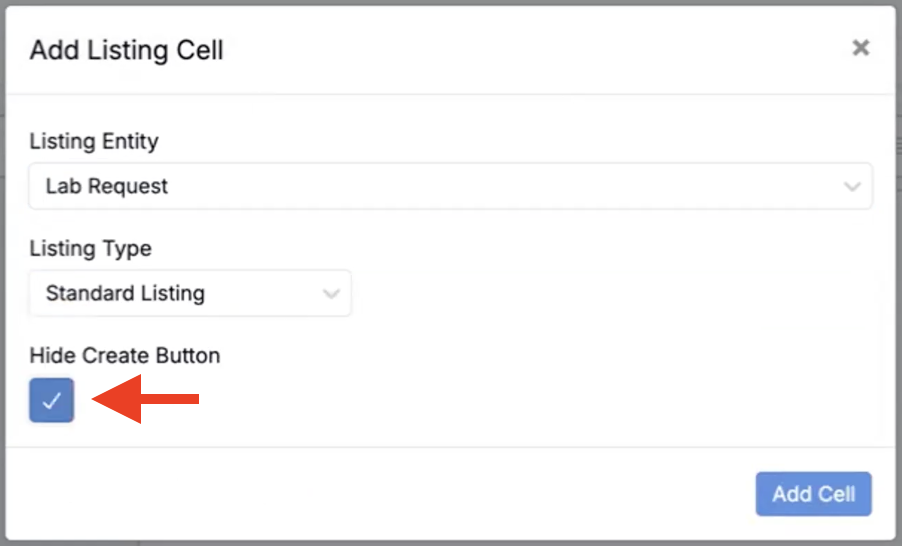
- On a notebook or dashboard, add a Structured Listing cell.
- In the modal, enable Hide Create Button.
- Add the listing to a notebook.
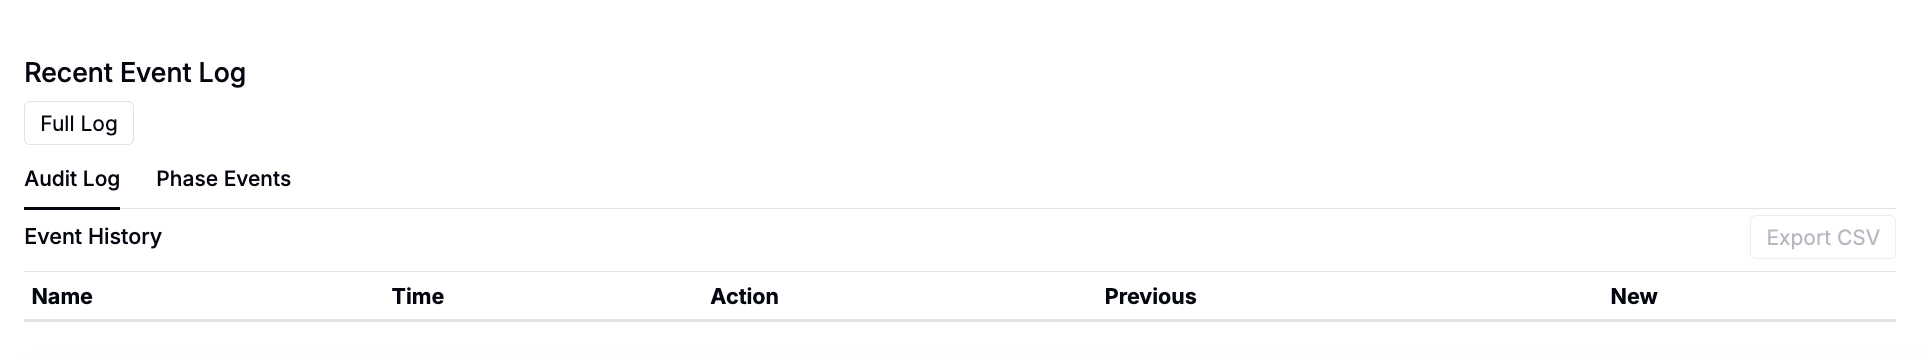
Hide Recent Event Log on Approvals
Approval definitions now include a configuration option to hide the default Recent Event Log section. This update provides greater control over the layout and information displayed on different approval forms.
How to use:
- Navigate to the Definitions tab in Form Admin.
- Search for and select the relevant Approval definition.
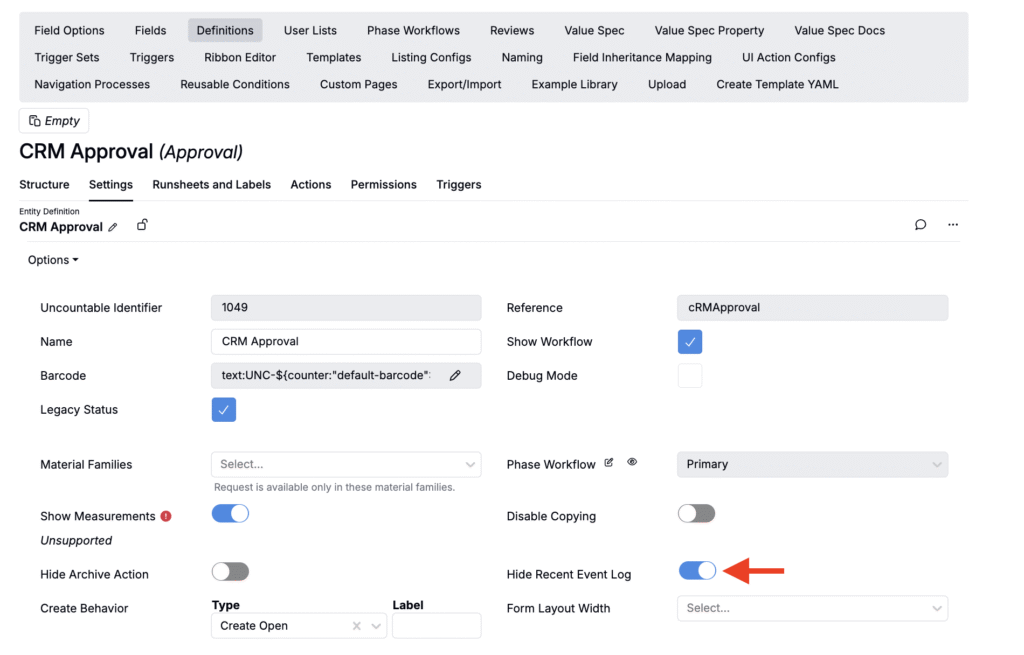
- Within the Settings tab of the definition, toggle on Hide Recent Event Log.
- All approval forms created from this definition will no longer display the event log.
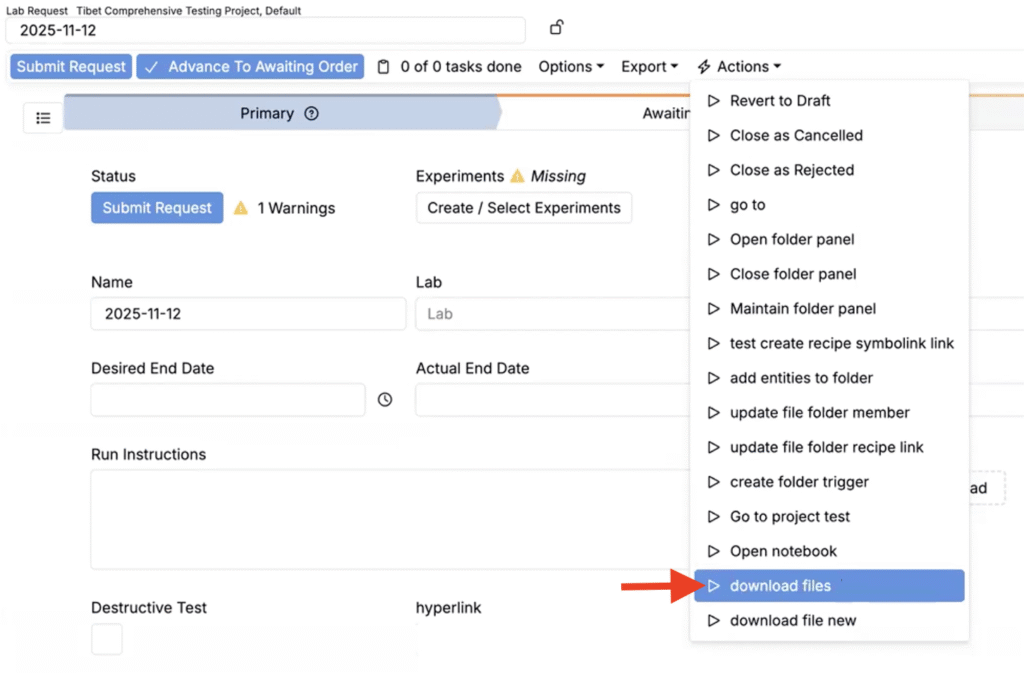
New File Download Trigger
A new file download trigger action is now available, allowing admins to expose a direct file download button on entity pages. Once triggered, a preview of the file will automatically open. From that preview, users can download it directly.
This trigger is designed for scenarios where users frequently need to access standardized documents (e.g. templates, safety sheets, COAs). By linking a trigger directly to a definition, teams can ensure that the correct file is always accessible in the same place where related work is being performed.
Note that the trigger currently only supports downloading one file per trigger.
How to use:
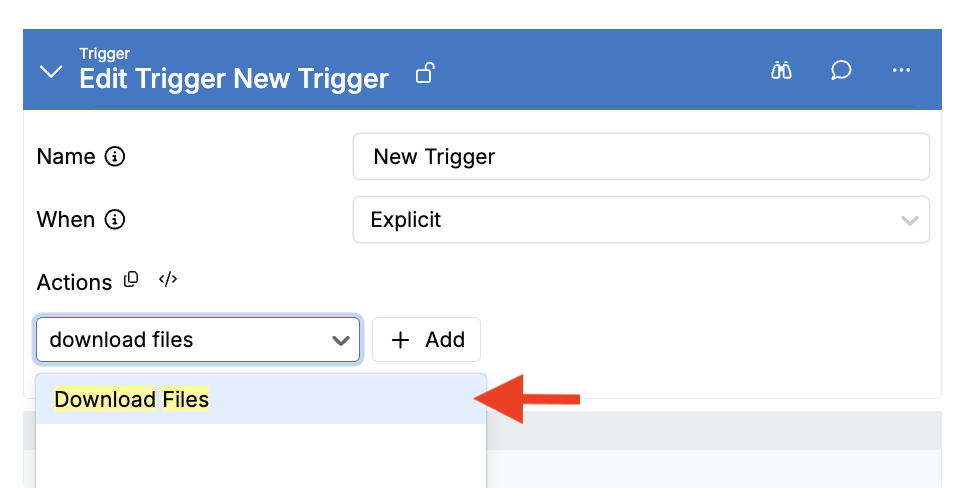
- Add a new trigger to a trigger set by clicking Add Trigger.
- Name the trigger and set When to Explicit.
- Add a Download File trigger action using the Add field.
- In the modal, use the File Folder Member field to select a file.
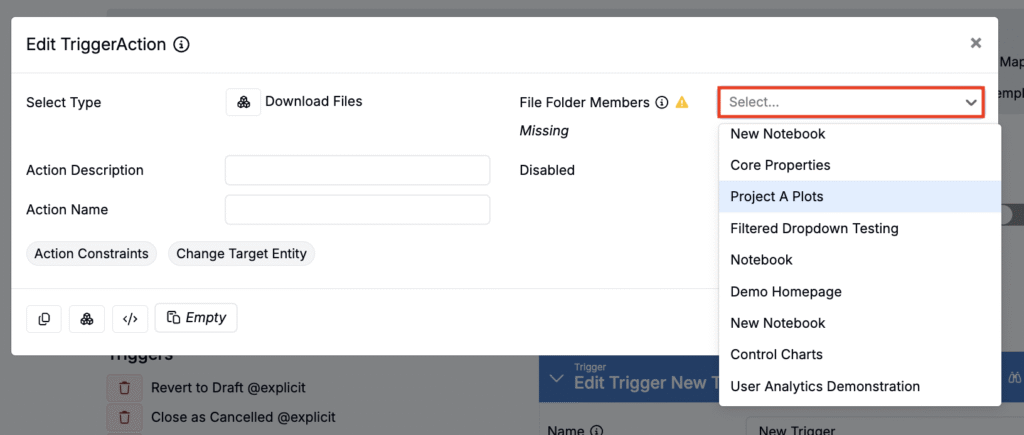
- The trigger can now be added to any definition, allowing users to download the selected file directly from the entity page.
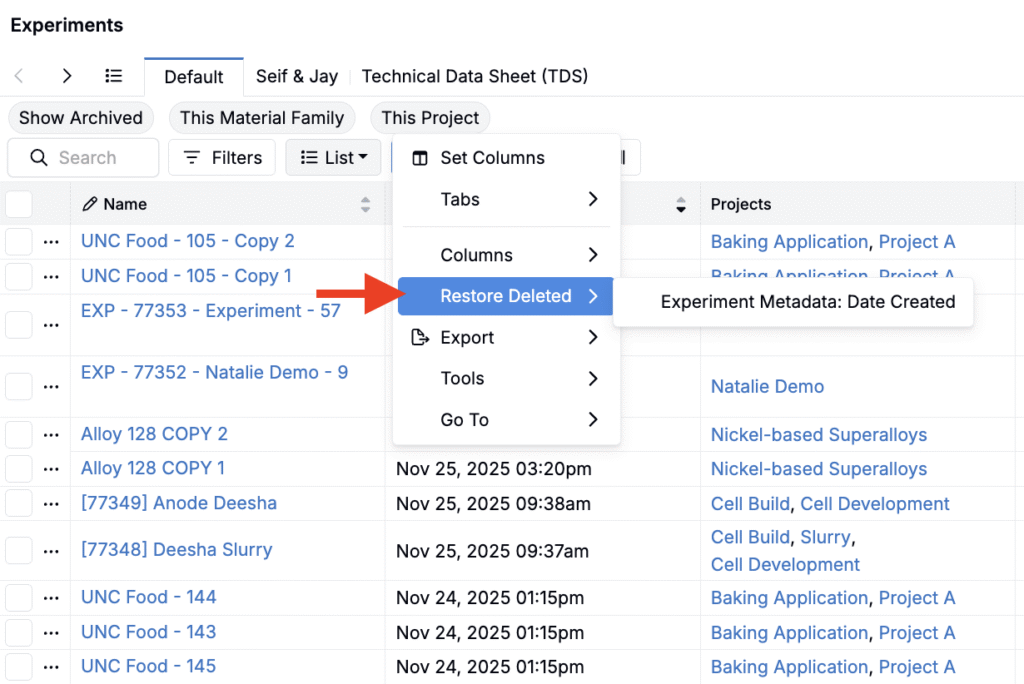
Restore Deleted Columns in Listings
Listings now include a Restore Deleted option that recovers columns removed by mistake. Restored columns retain their configuration and styling, helping maintain curated listing views during editing.
Note that restores persist for the current browser tab or window session, including on refresh. If you open the same listing in a new tab or window, the deleted-state history does not carry over and the deleted elements will reset.
How to use:
- Open a listing.
- Click List > Restore Deleted.
- Select a column to restore.
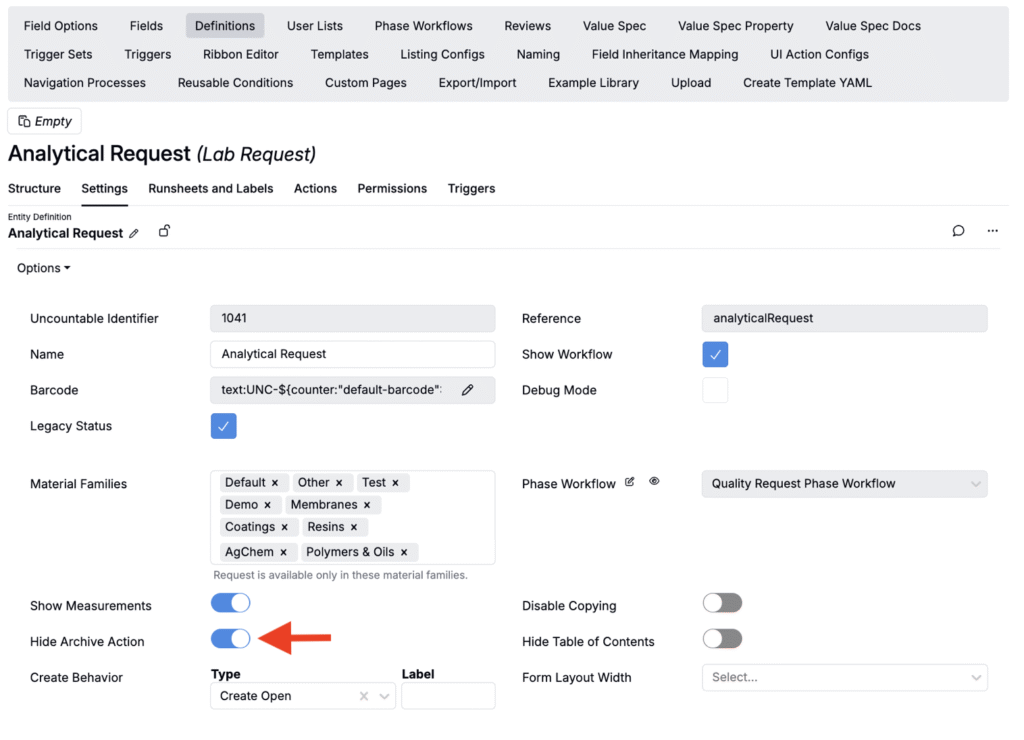
Hide Archive Action on Entities
Entities created within Uncountable typically include an Archive option. For most entities (e.g. lab requests, custom entities), it can be found within the Options menu.
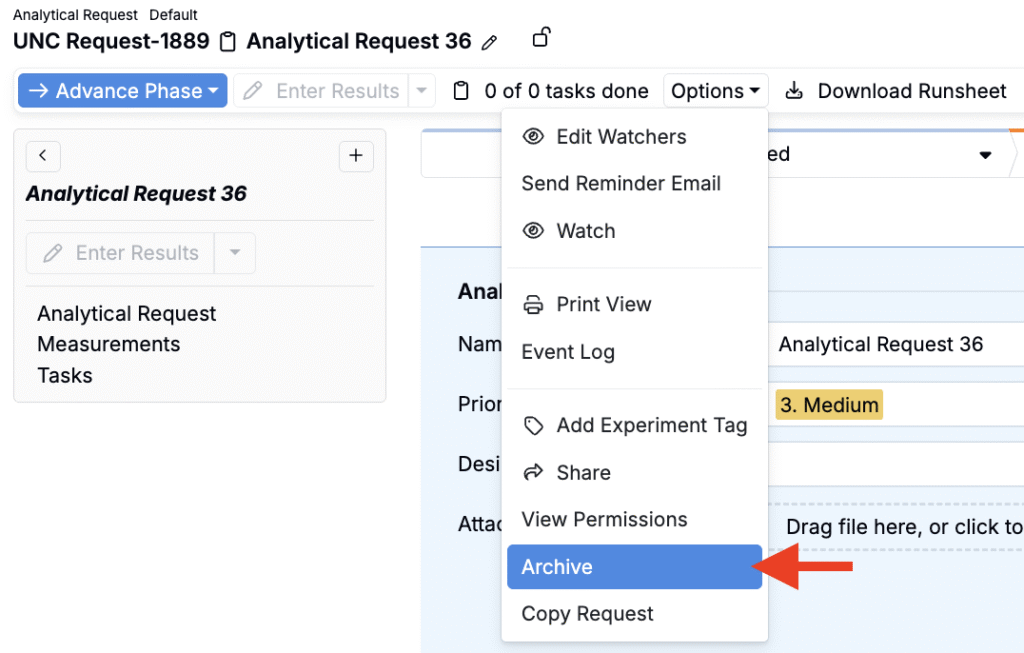
fIn a recent update, definitions created within the platform can now be configured without the Archive option This new setting is useful when archival is managed through custom triggers or workflow steps or when admins want to prevent users from accidentally archiving.
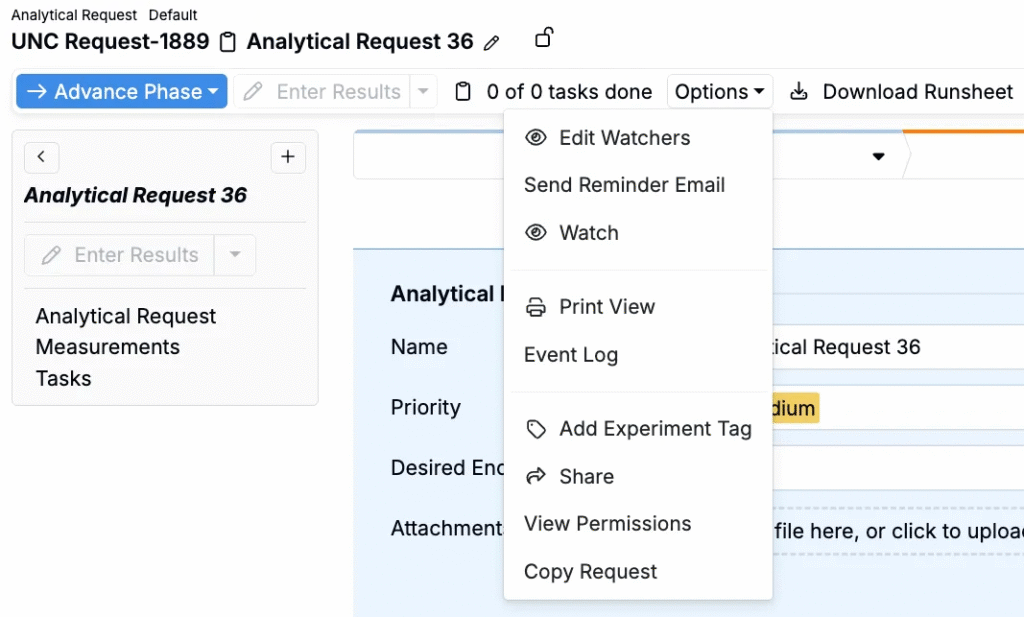
How to:
- On the Definitions tab of the Form Admin page, search for the relevant definition.
- Within the Settings tab of the definition, toggle Hide Archive Action.
- All forms or entities created from this definition will no longer display Archive within the Options menu.