Objective Search identifies the experiments in your workspace that best meet a specification you define. It evaluates every experiment against your chosen goals, assigns each one a score, and ranks them from closest to furthest from the target.
Use it to answer questions like:
- Which existing formulations already meet my specification?
- Which are closest to meeting it, and what’s missing?
- How has performance evolved over time?
Accessing Objective Search
To access the Objective Search tool, click the Calculate tab, then select Objective Search.
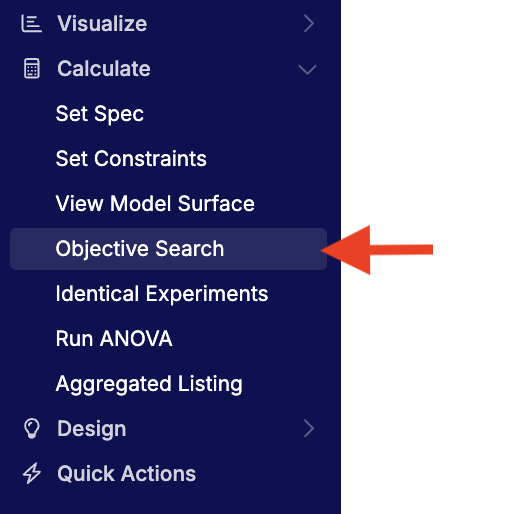
You can also access Objective Search from the All Projects view to search across multiple projects within the same material family.
Core Concepts
- Spec — A spec defines the goals and limits used to evaluate experiments — for example, desired ranges for density, elongation, and cost. Specs can be saved and reused across projects.
- Score — Each experiment receives a numeric score based on how well it meets the goals in the spec. Higher scores indicate closer alignment with your target. Some teams also track this score over time to monitor improvement.
- Priority — Each goal in a spec can be set to High, Medium, or Low priority. Priorities weight how strongly each goal affects scoring.
Running an Objective Search
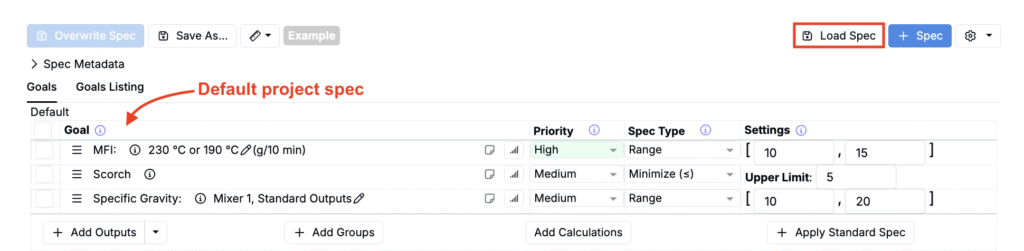
- Load or Import a Spec
- If your project has a default spec, it loads automatically.
- Otherwise, click Load Spec (to load from the current project) or Import Spec (to load from another project).
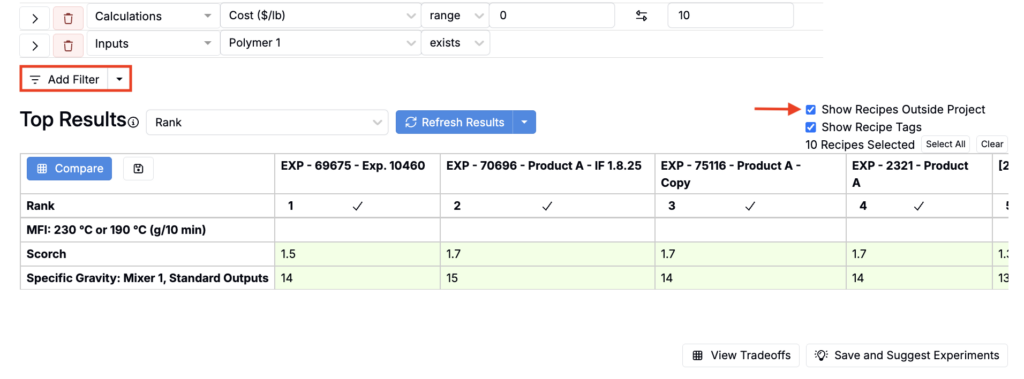
- Apply Filters (Optional)
- Use Add Filter to restrict which experiments are evaluated (e.g., include only a certain polymer or cost range).
- These are hard filters: any experiment that doesn’t meet them is excluded from scoring.
- To limit results to only the current project, remove the check for Show Recipes Outside Project.
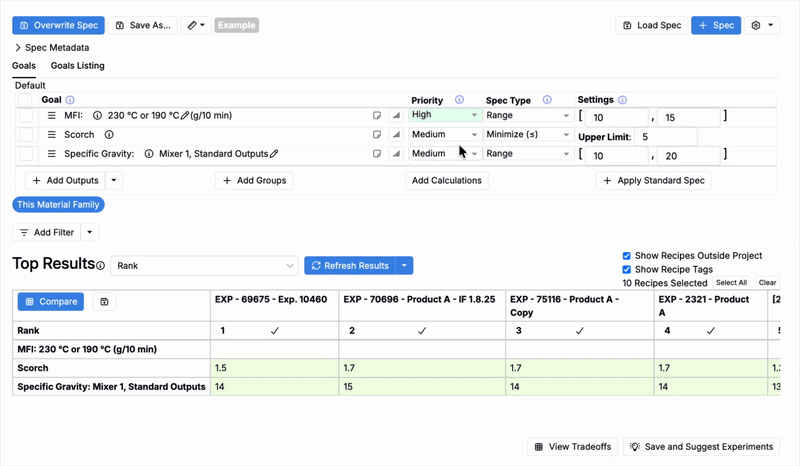
Understanding the Results
After running the search, the Top Results table ranks recipes by how well they meet your spec.
- Columns show recipes, sorted by Rank (best matches on the left).
- Rows list each goal from your spec.
- Cell colors indicate whether a goal is achieved — green means it meets the spec; red means it does not.
Results can include partial matches: formulations slightly outside one goal may still rank highly if they strongly meet others. Unmet goals remain red, and ranking reflects overall closeness to your spec.
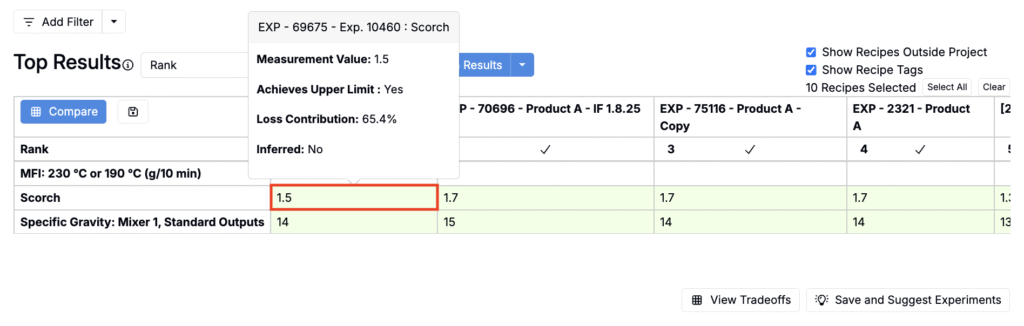
Hover over a cell to view:
- Measurement Value – the recorded value for that goal.
- Achieves <Goal Type> – whether the value meets the defined target or limit.
- Loss Contribution – how much this goal affects the recipe’s overall ranking.
- Inferred – whether the value was estimated because data was missing.
How Scoring Works
Objective Search calculates how close each measurement is to the target and combines these results into a single score for each recipe. Goals set as High, Medium, or Low priority influence the score accordingly. Recipes that best meet all goals rank highest. If data is missing, an average inferred value is used so missing results don’t skew the ranking.
Adjusting Goals and Priorities
You can adjust upper and lower limits, goal types (maximize, minimize, target, range), and priority levels directly in the Objective Search table.
To better differentiate top-performing formulations:
- Use a mix of High, Medium, and Low priorities.
- Review which goals contribute most to loss among the top 5–10 experiments, then tune limits or priorities to reflect your project’s focus areas.
- Once you’ve adjusted goals and priorities, click Refresh Results.
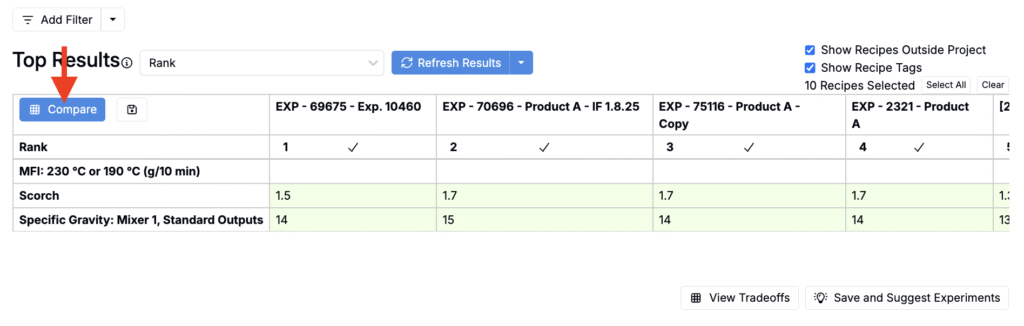
Comparing Top Experiments
Click Compare to open a detailed comparison of the top-ranked experiments.
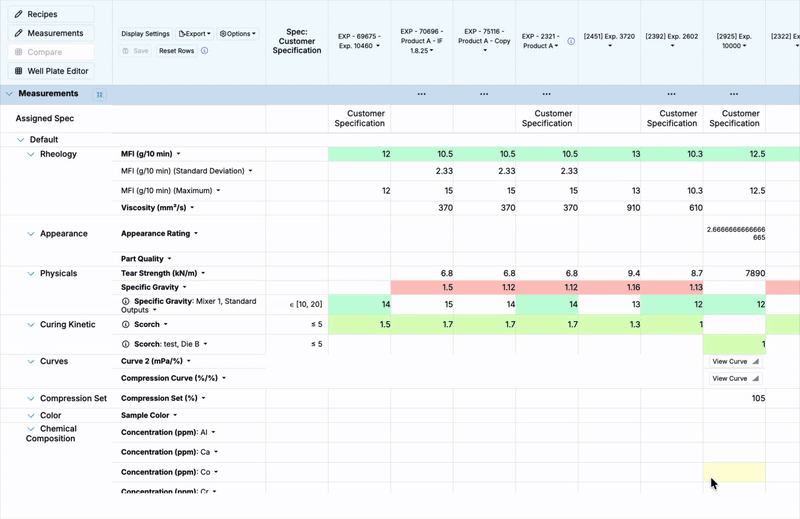
The Compare view shows:
- All input and measurement values
- Spec targets in a separate column
- Color-coded results (green = pass, red = fail)
By default, the top 10 experiments are selected, but you can adjust the selection before comparison.
Searching by Curve Similarity
In addition to ranking experiments by numerical outputs, Objective Search can also identify experiments with curve-shaped outputs that most closely match a target curve. This is especially useful in spectroscopy, thermal analysis, or mechanical testing workflows where the shape of a curve matters as much as the values themselves.
To learn how to run a curve-based search and interpret similarity scores, see Curve Similarity Search.