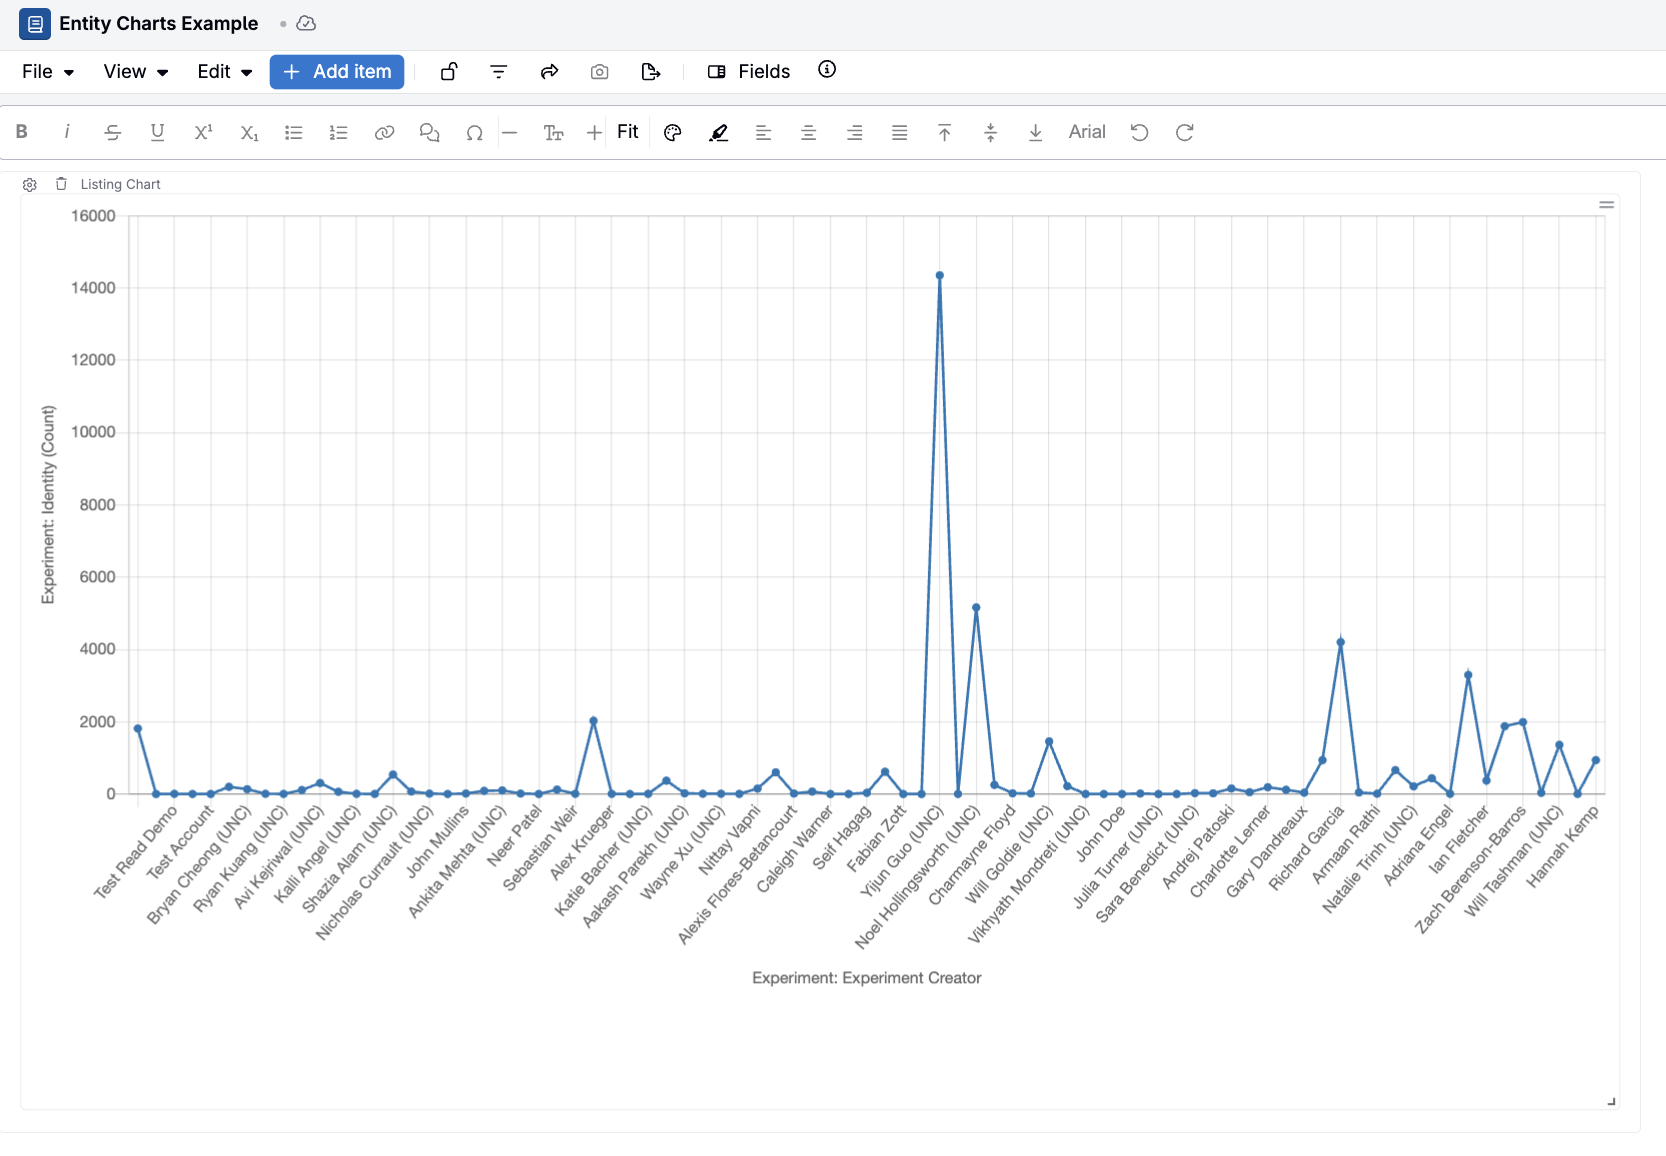
Entity charts turn live entity listing data into a visualization. They most commonly used in dashboard notebooks, where you want a chart and its underlying data table to stay in sync as filters change, but can also be added to standard notebooks.
When to use entity charts
Use entity charts when you want to:
- Visualize counts, averages, totals, or percentages across a set of entities (experiments, lab requests, inventory items, and so on).
- Add a live visualization to a notebook or dashboard that changes as you update filters.
- Pair a chart with its underlying table so people can drill in to the exact rows behind a point or bar.
If you need a one-off “pivot table” style summary outside of a notebook, start with Aggregated Listings from the Calculate menu and optionally save it into a notebook later.
How to create an entity chart
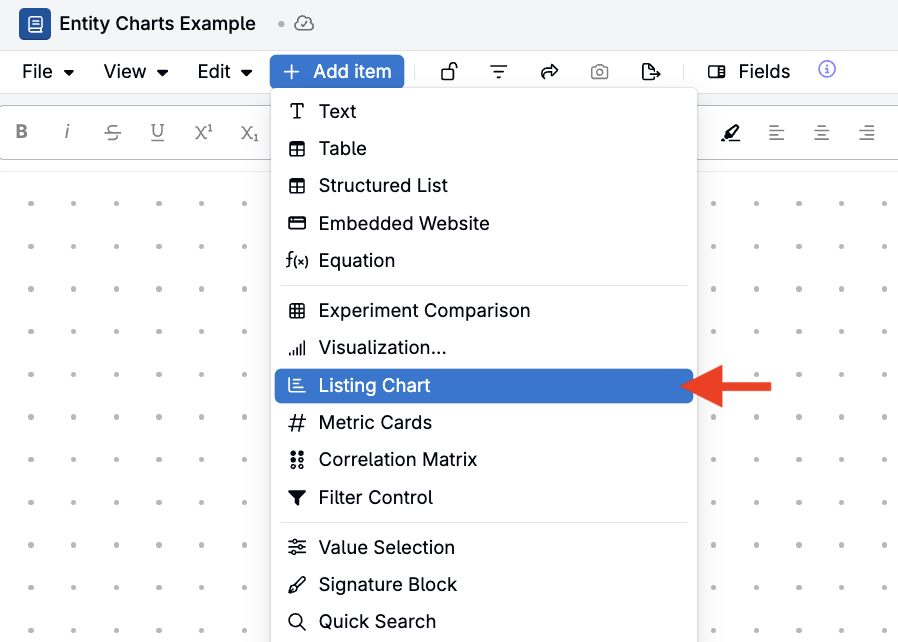
- Open your notebook (or dashboard), then click Add Item.
- Select Listing Chart.
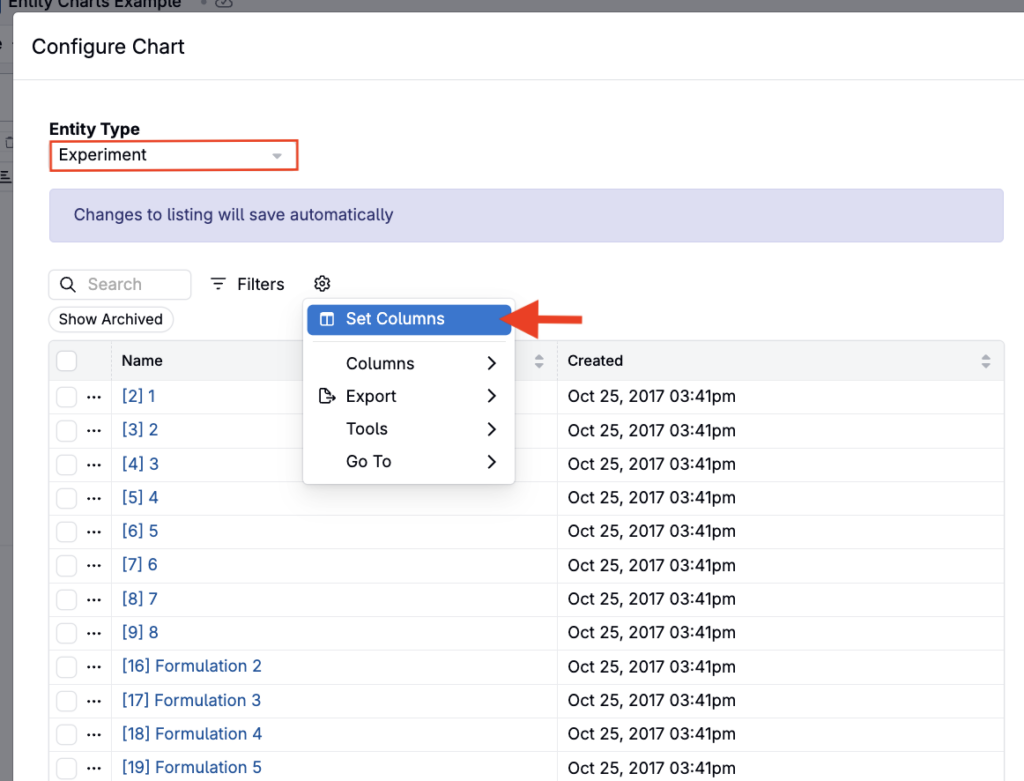
- Click Edit Chart Configuration.
- Choose the Entity Type you want to chart (this is the base entity for the listing).
- Click ⚙️ → Set Columns.
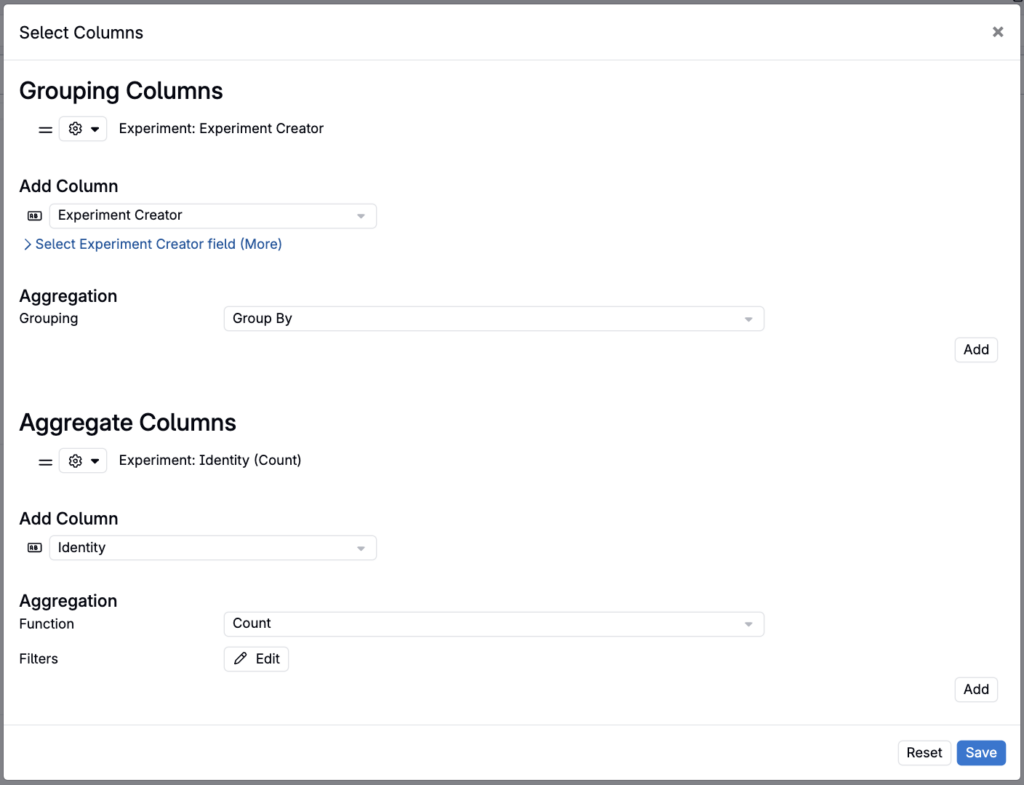
- In the modal, configure either:
- A simple listing (one row per entity), or
- An aggregated listing (recommended for summaries).
- Choose a Chart Type (bar, line, pie, radar, ternary plot).
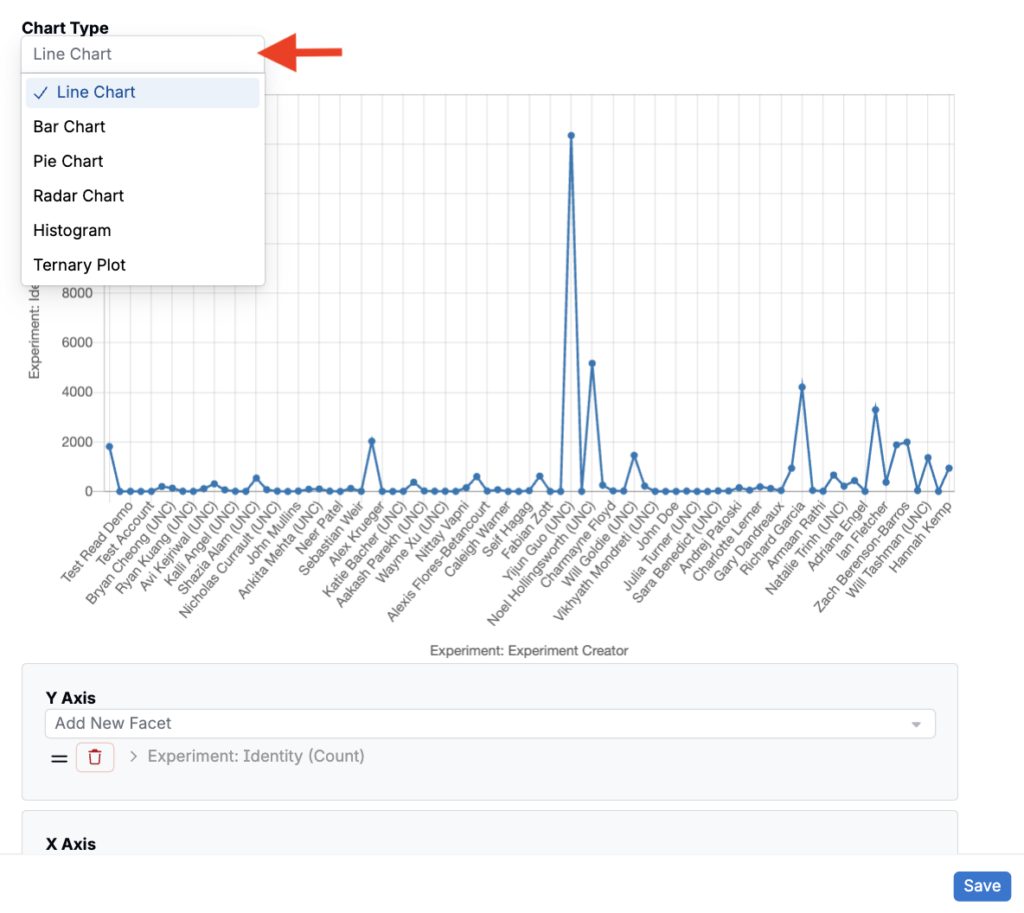
- Assign fields to the axes (the available fields depend on your chart type and columns).
- Click Save.
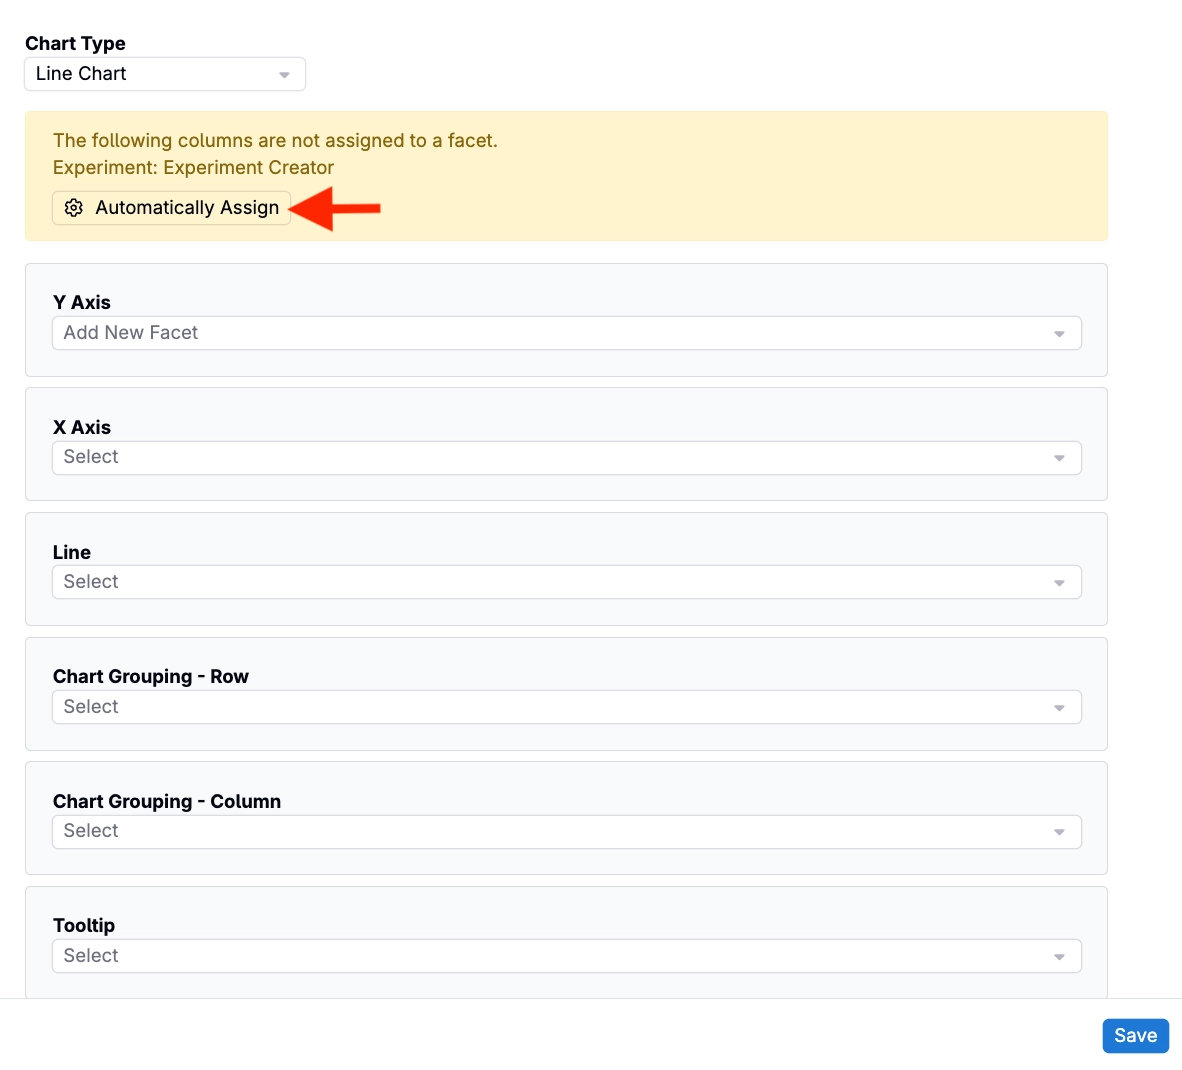
Filters
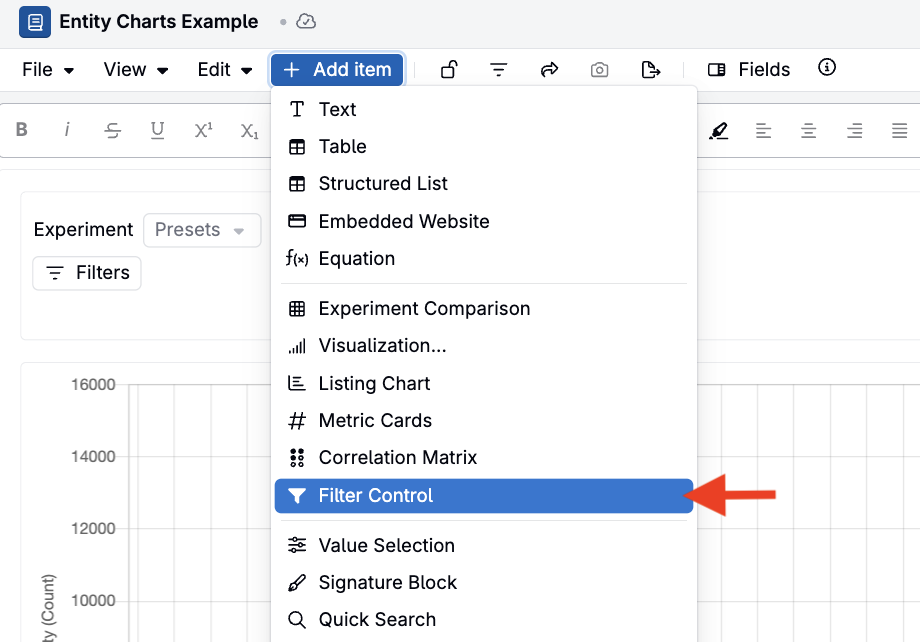
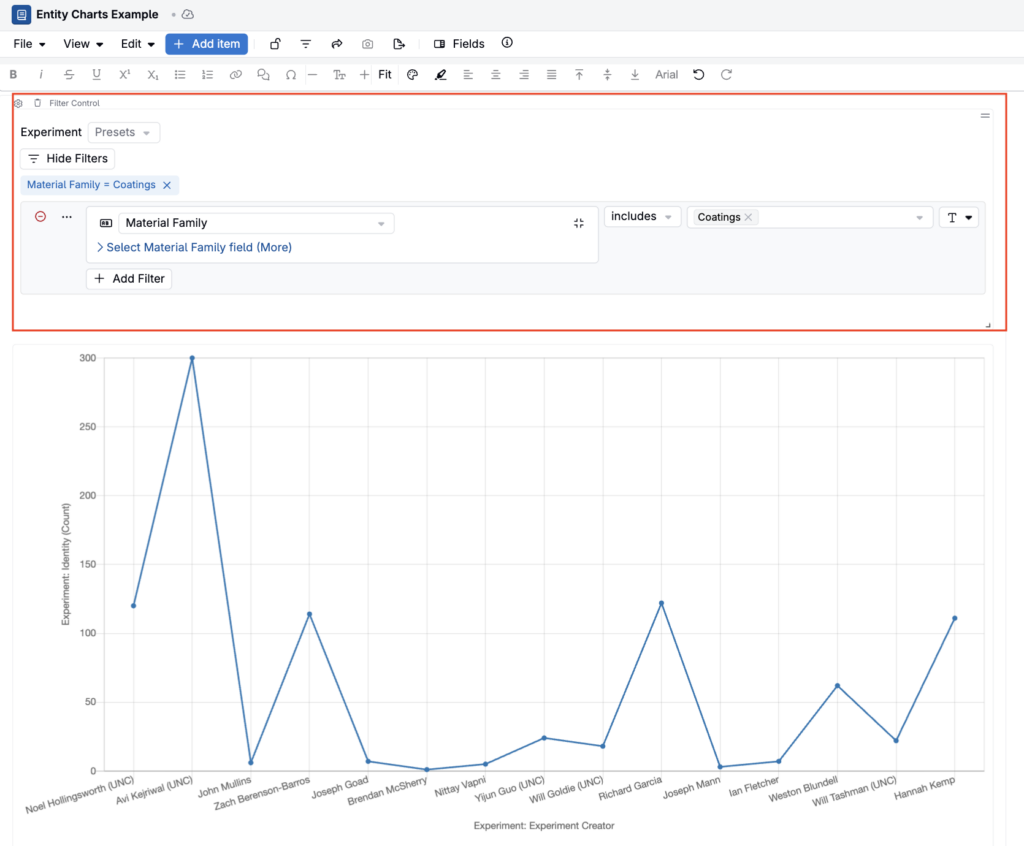
You add Filter Controls to the notebook itself to update the entity charts along with the other notebook data.
Use listing control filters to:
- Limit the rows feeding the notebook (for example, “only lab requests created this quarter”).
- Keep a chart and its underlying table pointed at the same subset, so people can drill into the exact rows behind a point or bar.
- Let readers explore the dashboard by adjusting one filter, instead of reconfiguring each chart.
Aggregate filters
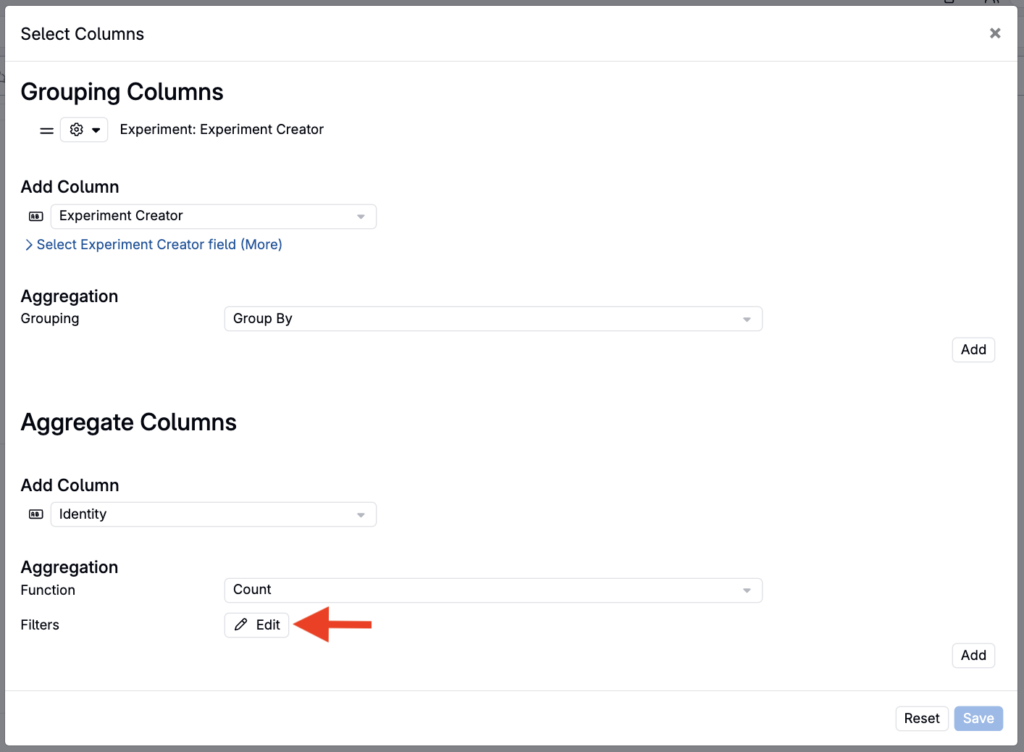
When your chart is based on an aggregated listing, you can add additional aggregate filter controls by clicking the Edit Filters button within the Select Columns modal.
Use aggregate filters when you need to filter rows before the aggregation is computed. This is useful when you want an aggregation like “% of requests repeated per month” to only count requests that match a specific definition or status.