In Uncountable, you can save Explore Data visualizations into Notebook Templates to reuse plot configurations. Template axes and settings are defined on the template, and when the template is loaded in different projects the data automatically resolves to the current project or selected experiments. This allows you to create shareable dashboards across projects without rebuilding plots each time.
Previously, this could be done via Explore Data plot templates. However, this new method allows users to bundles multiple visuals with page layout and defaults into a single, scalable, shareable notebook.
Notebook Template for Plots Example
Using notebook templates lets you package specific plots into a reusable notebook, such as:
- A stability testing template that includes viscosity tests, degradation curves, and long-term performance trends.
- An analytical testing template with visualizations focused on chemical composition and purity measurements.
- A core physical properties template for mechanical strength, viscosity, and other key performance metrics.
Organizing plots in this way gives teams a consistent analysis layout they can apply across projects and experiments.
Setting Up a Notebook Template for Plots
Setting up a notebook template for plots requires two steps.
Create a Notebook Template
First, create a notebook template scoped to All Projects.
- Click the All Projects button on the Select Projects page.
- Navigate to Notebooks listing page.
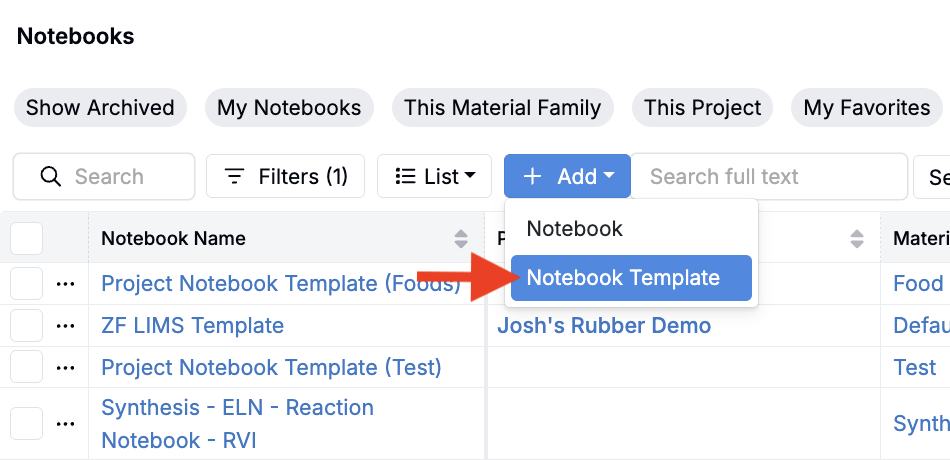
- Create a new Notebook Template (Add > Notebook Template) without filters.
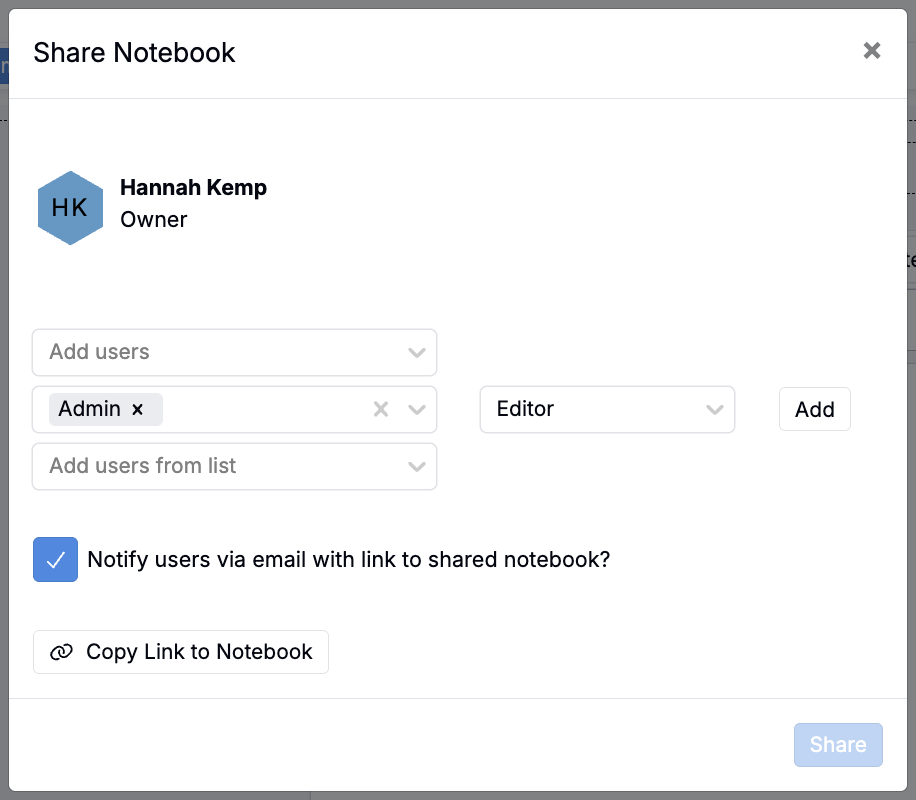
- Share the template with desired users and user groups.
Save Plots to the Template
Next, save Explore Data plots to the notebook template.
- Remove project scoping by clicking the All Projects button on the Select Projects page.
- Navigate to the Explore Data page and create the plots you want to include in your notebook template without filters.
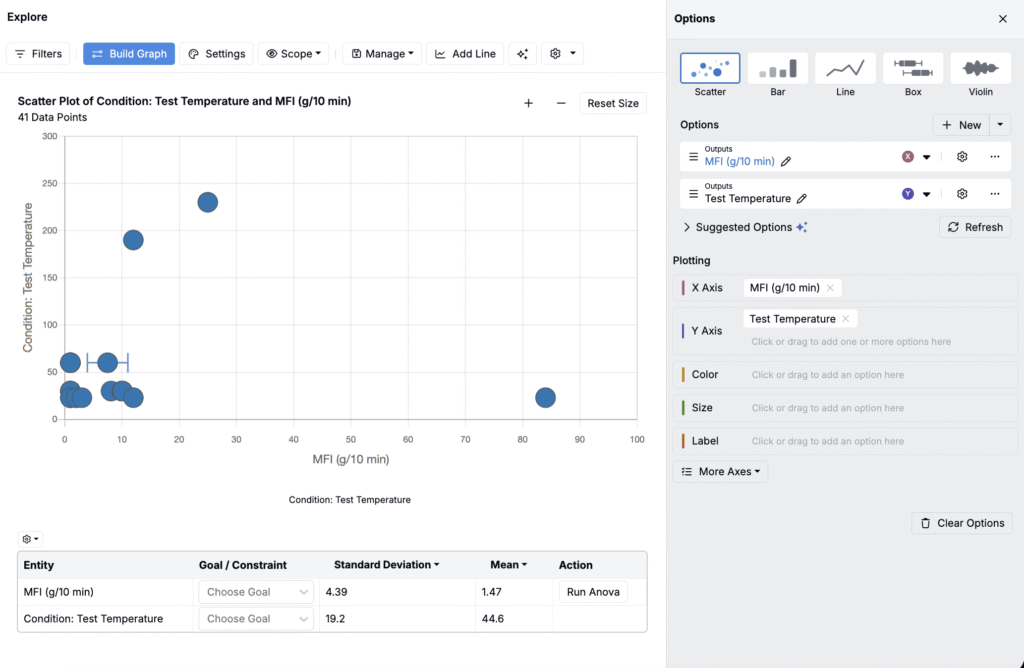
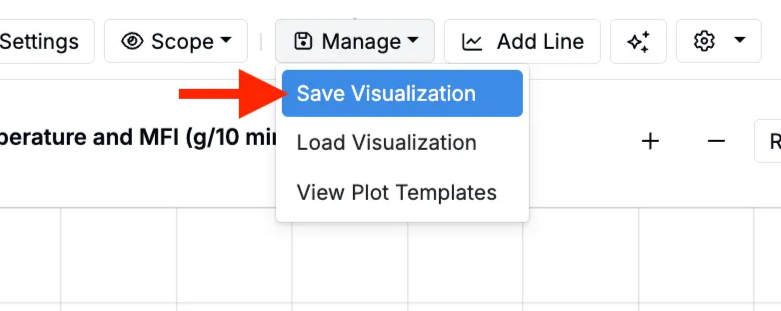
- Save the plots by clicking Manage > Save Visualization.
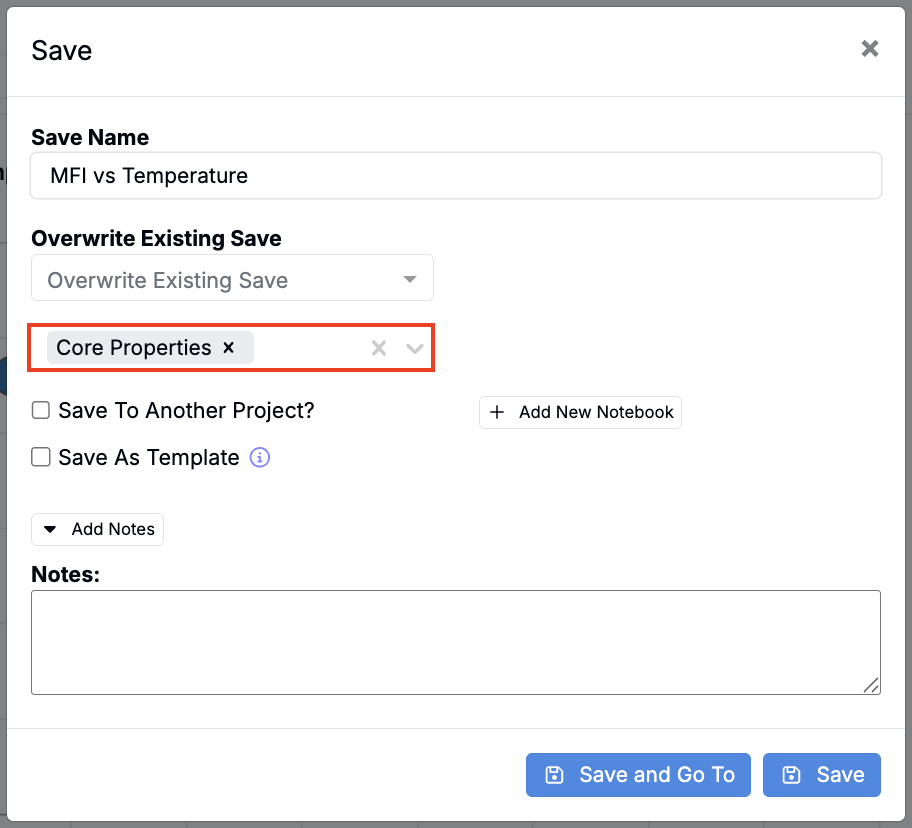
- In the modal, add a Save Name, select your template notebook from the Notebooks to Include Save Field, and save.
Once you’ve finished adding plots, you’ll have a reusable template notebook with all standard visuals for that specific testing group.
Using Notebook Templates
Once the template is complete, it can be used in following common workflows:
Creating Plots from Select Recipes
Notebook templates can be used to create new notebooks from select recipes.
- Select recipes to plot data from the Project Dashboard or Experiment List page.
- In the selection menu, choose Filter Notebook to Selected Recipes. This new option replaces the previous “Plot Templates” button.
- In the modal, search for and select the notebook template.
- This will navigate you to the notebook, filtered down to display only the selected experiments.
Additionally, by clicking the binoculars icon associated with an individual plot, users can adjust the scope:
- Notebook — displays plot data based on the Notebook’s scope (All Projects).
- Current View — displays plot based on selections made or filters added.
Creating Filtered Notebooks from Templates
Notebook templates can also be used to create new notebooks and filter those notebooks to specific data, experiments, or projects.
- Create a new notebook using the notebook template.
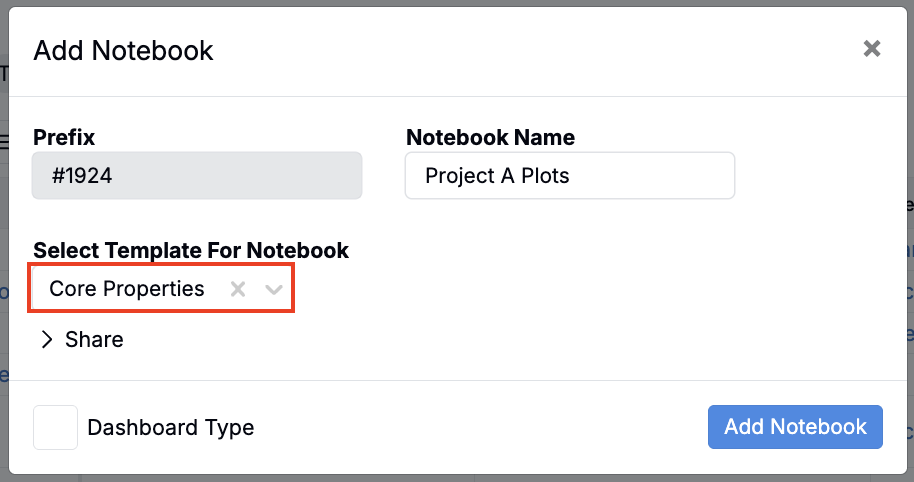
- Add filters to your notebook (e.g. filter to a specific project).
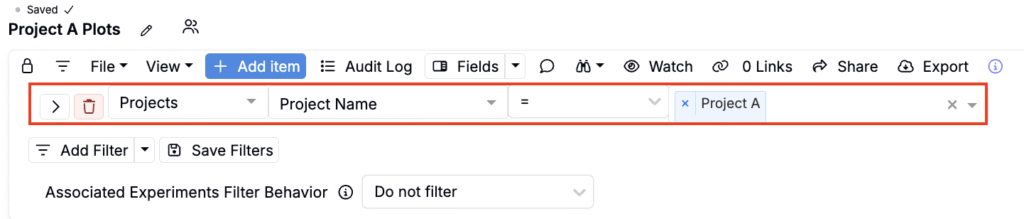
This will filter all plots in the notebook to display only select data for each plot.