Bug Fix: Editable constraints now apply to test sample inputs
We’ve resolved an issue where Editable constraints on measurement groups were not being fully enforced for test samples inputs.
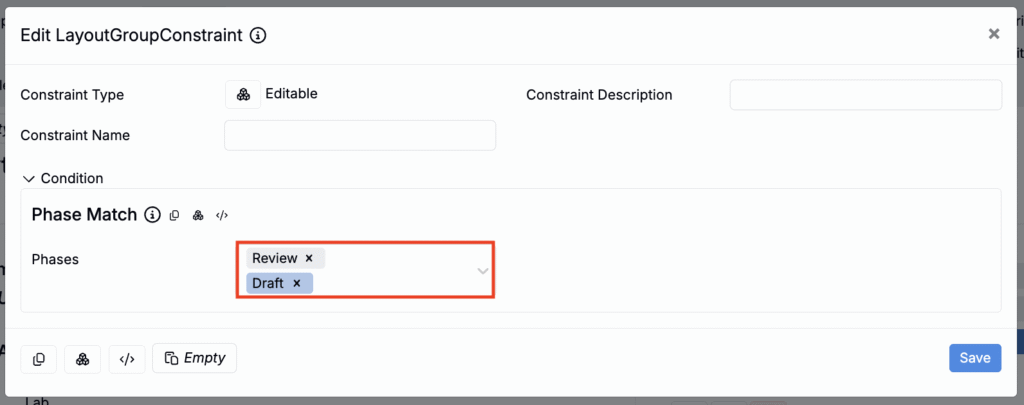
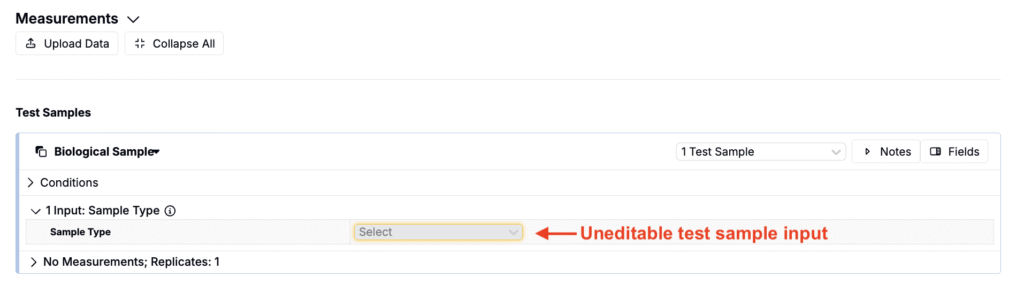
Previously, when a measurement group was configured to be editable only in specific workflow phases, the associated process parameters on test samples could still be edited in phases where they should have been read-only.
With this fix,
- Editable constraints defined in Form Admin for measurement groups now apply consistently across the lab request and any test samples associated with that request
- Process parameters on test samples now become read-only or editable according to the phase-based rules you’ve configured
This ensures editability behaves as expected everywhere measurement group inputs appear.
Add Favorite Links to Notebooks
You can now add Favorite Links as button cells in notebooks and dashboard notebooks. These buttons let users quickly navigate to frequently used pages, listings, entities, custom URLs, or triggers—directly from the notebook view.
This update is part of a broader effort to support using dashboard notebooks as landing pages within the platform. By enabling users to add direct links to key pages, we’re making it easier to build dashboards that serve as starting points for customer workflows.
How to Add a Favorites Link
- On a notebook or dashboard, add a Button cell.
- In the modal, configure the following:
- Title — this will be the button label
- Link Type — select Entity, Page, Listing, Custom, or Trigger
- Select the specific entity, page, listing, url, or trigger.
- Click the blue + to add each button.
- Save changes.
Each link appears as a clickable button that opens the target page in a new tab, giving you fast access to your most-used tools and views.


Evaluate Value Specs in Dashboard Notebooks
Uncountable users can now evaluate Value Specs directly within dashboard notebooks. This update allows you to bring in dynamic data or verify specific information without needing to leave the notebook context.
To use this feature:
- Add a Text cell to the dashboard notebook.
- Enter a value spec using the standard format.
- When you switch to Preview mode, the value spec will be evaluated and the result displayed in place.


Background Colors for Dashboard Notebooks and Cells
You can now personalize the appearance of dashboard notebooks by setting background colors for the entire notebook or for individual cells.
Use color to visually group related content, highlight key sections, or create cleaner, more readable layouts tailored to your workflow.

To set a background color for the full notebook dashboard:
- Open the Fields dropdown from the notebook toolbar.
- Select Set Background Color and choose a color.

To color a specific notebook cell:
- Open the cell settings menu.
- Select Set Background Color and choose a color.

Experiment Listing Fields Now Displayed on the Compare View
Experiment listing fields added to recipes on the Enter Measurements or Enter Recipes pages are now also shown in the Compare view for those recipes. Previously, these fields were only visible on the Enter pages.


To configure this on the Compare view:
- Open the Options dropdown menu.
- Select Show/Hide Rows.
- Toggle Experiment Listing Fields on or off.
- Click OK to apply.


Additionally, if you save a Compare cell to a notebook, the selected listing fields will also be displayed there. Any changes to the experiment listing fields on the Enter pages will not update previously exported Compare cells in notebooks.


New Feature: Data Sets
The new Data Sets feature allows users to group experiments from multiple projects into a single, unified view—without needing a shared project. It was also designed to address a common limitation where users couldn’t view all relevant experiments due to restricted project access within a material family.
By default, the Data Sets page displays all experiments you have full Read access to in the current project or material family. From there, you can create “data sets” by adding additional filters.
Each data set behaves like a project: users can view dashboards, create notebooks, and generate visualizations using the experiments within that set.


Creating a New Data Set
- Access the Data Sets page (Visualize → Data Sets).
- Enter a name in the Data Set Name field (A).
- Apply filters to select experiments from across one or more projects (B).
- Click Create Data Set to generate a new folder (C).
To access past Data Sets, select them from the Existing Data Sets listing at the bottom of the Data Sets page.


To learn more, refer to Data Sets.
Easier Navigation Between Material Families and Projects
You can now switch material families and projects directly from the Navigation Bar—without needing to return to the Select Projects page.
Click the project breadcrumbs (or the compass icon if the Navigation Bar is collapsed) to open a modal where you can choose a new Material Family or Project:
- Selecting a material family takes you to its All Projects page.
- Selecting a project takes you directly to its dashboard.
This update makes it faster and more convenient to move between projects from anywhere in the platform.

New “Maximum Quantity” Option for Experiment Summary Calculations
A new Maximum Quantity option is now available for Experiment Summary input calculations.
Previously, only the First Match behavior was supported, which returned the first matching ingredient in the recipe based on the selected category. Now, with the Maximum Quantity option, the calculation will return the ingredient with the highest quantity among the matches.
This new calculation type offers an easy way to see, at a glance, which ingredient is used the most in a given category—helpful for understanding dominant components in a formulation, prepping materials, or comparing recipes.

How to Configure
- Create a new input calculation and add a calculation name.
- Set the Calculation Format to Experiment Summary.
- Set the Config Type to Ingredients Used.
- Set Multiple Ingredient Behavior to Maximum Quantity.
- Add additional settings (e.g. Input Categories, Percentage Threshold).
- Save the calculation.

Improvements to Analytical Measurement-Type Outputs
The Enter Measurements page now includes new features that make it easier to work with analytical measurement-type outputs (aka “Recipes as Outputs” or “ROAs”). On the measurements view of a recipe with a ROA, users can now:
- Pin Ingredients – You can now pin ROA ingredients, just like pinning calculations. Pinned ingredients stay visible even when data is hidden, helping you keep key components in view.
- Inline Recipe Editing – Click the ➕ icon in to add ingredients to the ROA recipe inline. Ingredient quantities are also now editable directly from this page.
These enhancements allow users to adjust analytical measurement-type output formulations directly on the measurements page, streamlining workflows.


New Load Options in Similar Entity Search
On the Similar Entity Search page, once you’ve selected an ingredient, you can now choose how to load related ingredients using the new Load Ingredient Columns button:
- Load Ingredient Columns – Loads only the ingredients directly included in the selected recipe.
- Load Exploded Ingredient Columns – Includes ingredients from any intermediate recipes used within the selected recipe, giving a more complete view of its composition.
This provides more control over the level of ingredient detail you want to analyze in your similarity search.

New Listing Column Formatting Options
A new set of column formatting tools gives Uncountable users greater control over how information is displayed in listings.
With these updates, user can add font styling to highlight key information in listing columns and create custom layouts that aggregate multiple fields into a single column.
Font Formatting
Users can now apply font formatting (size, bold, italics, color) to individual listing columns.

To add font formatting:
- Click the column header and select Edit Column Format.
- Click the Add Font Format button.
- Select a font format (size, bold, italics, small caps) and font color.
- Click Save to apply changes.
- Remove font formatting within the modal by clicking the Remove Font Format button.
Stacked Columns
Users can also now combine two columns into a single stacked column.

To stack columns:
- Click the column header for the column you want to move.
- Choose Layout → Stack Under Right/Left to stack under the column to the right or left of the selected column.
- To unstack the columns, click into the column header and select Layout → Split Stack.
Layout Columns
By combining stacked layouts with font formatting, users can now build more advanced layout columns—single columns that display multiple fields with custom styling and dividers.
To create a layout column:
- Click the column header and select Edit Column.
- In the Layout tab of the modal, use the Add Parts field to add:
- List Data — choose any list field to include in the column; fields are added inline by default.
- New Line — places the next field on a new line below the previous one.
- Inline Divider — adds a divider between fields, displayed on the same line.
- Select individual layout parts to apply font formatting (e.g., size, color, bold).
- Click Save to apply your changes.


To learn more, refer to Listing Configuration..
New Field Type: Numeric List Fields
We’ve recently added support for a new field type, Numeric List fields. When added to a form, these fields appear as editable lists of numeric values.

Numeric list type fields can also be displayed in listing columns. If the field is configured as Quick Editable, list values can be edited inline on the listing. You can also use numeric list fields in filtering logic.

How to Create a Numeric List Field
- Access the Fields tab of the Form Admin page.
- Add a new field, and select a Numeric list type.
- In the Format tab of the field definition, you can also configure the field’s duration Render format if desired.


This new field type will be useful for workflows that involve managing sets of numeric inputs, such as stability requests.
Filter Test Samples or Outputs on Enter Measurements Page
Uncountable users can now filter which test samples or outputs are shown on the Enter Measurements page.
To access this feature, use search actions to open either the Filter Test Samples Sidepanel or the Filter Outputs Sidepanel.
Each sidepanel will display the full list of test samples or outputs currently visible for the recipe. Add filtering directly within the sidepanel will control which test samples and outputs are displayed on the measurements page.
When filters are active, a notice will appear at the bottom of the screen indicating that test samples or outputs are being filtered out of view.
This update makes it significantly easier to narrow down large datasets and focus only on relevant test samples or outputs—improving data discoverability and supporting more targeted analysis.


Barcode Scanning Triggers
You can now configure triggers in Form Admin to fire when a barcode is scanned, by setting the trigger’s “When” condition to Scan Barcode. This works on both the Enter Recipe page and the Barcode Tracking page.
A common use case is to automatically display hazard warnings or other critical information immediately after scanning a material barcode. However, this capability supports any action available through the trigger system.


New API: Create Mix Orders on Workflow Steps
A new API endpoint is available to create mix orders on any step of a recipe workflow. The endpoint accepts a standard recipe identifier key and a recipe flow step identifier.
To learn more, refer to the Uncountable API documentation.

Input Group Placeholder for Workflow Steps
You can now add an input group placeholder to workflow steps to control where input groups are applied.
When used, the placeholder inserts all ingredients from the selected input group into that specific workflow step, instead of defaulting to the first step.


Input group placeholders also work with workflow variants and test samples. In these cases, the placeholder appears in the creation modal.


Redesigned Barcode Tracking Page
We’re working on an updated Barcode Tracking Page with a modernized interface and improved mobile experience.
Key improvements include:
- A new split layout for easier navigation and visibility
- Enhanced mobile support for better usability on smaller screens
- More efficient use of space with collapsible side panels
This update will make it faster and more intuitive to manage barcode tracking workflows across devices.


Update to Locked and Signed Recipes
Recipes that are locked and signed now display clear icons to indicate their status on key pages across the platform.
Previously, locking a recipe did not reflect whether it had been signed. Now, when a recipe is locked and signed via the Lock/Sign modal, status icons appear on the Enter pages, Experiment Dashboard, and Experiments listing to improve visibility.
In addition, you can now filter listings by signature status, making it easier to find signed recipes and enhance traceability across teams.


