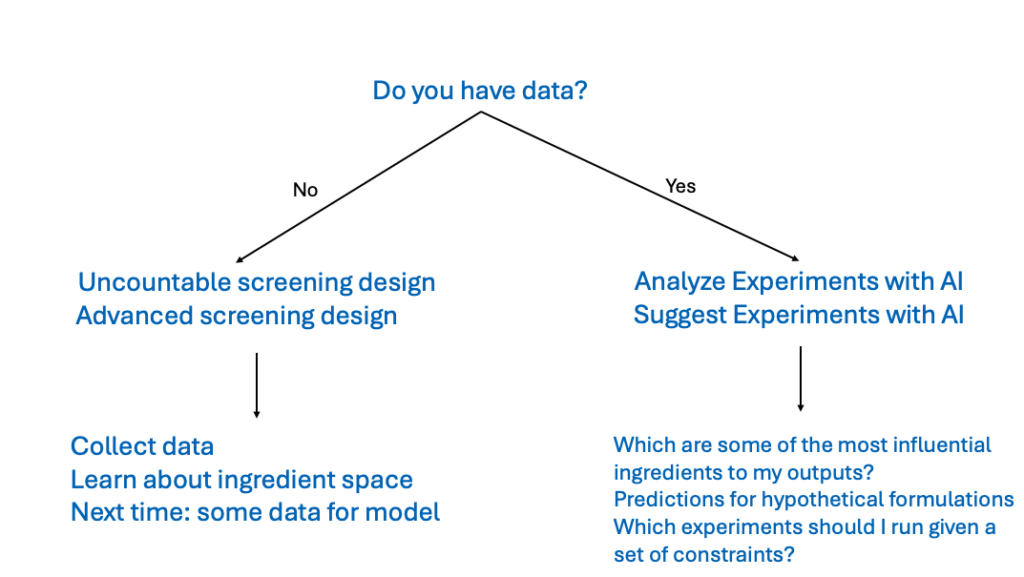
The Uncountable platform includes AI tools designed to analyze past data, generate predictions, and suggest future experiments.
To use these tools, users must have existing experimental data for the platform to create accurate predictive models. If no data is available yet, use Advanced Screening Design (DOE) to generate datasets first.
Once sufficient data has been collected, the Analyze with AI and Suggest with AI tools can help identify which inputs have the strongest influence on outputs, predict outcomes for hypothetical formulations, and guide future experimentation with actionable suggestions.
Suggest with AI
Suggest with AI (Design > Suggest with AI) is a tool for generating recommended formulations that are most likely to achieve specific target outcomes.
Unlike Analyze with AI, which is used to predict outputs from given inputs, Suggest with AI works in reverse: you set desired outcomes (targets), and Uncountable recommends what inputs to change to achieve them. Every Suggest job also runs an Analyze model behind the scenes, plus additional optimization logic to generate recommendations.
Prerequisites
To use Suggest, you need enough prior experimental data to train a model. If you do not have sufficient historical data yet, start with Advanced Screening Design to generate a screening set that helps you collect data across the design space.
Step 1 — Select Experiment Workflow and Units
First, select the experiment workflow and ingredient units.

Step 2 — Select Inputs
Next, define the ingredients and specify the ranges to be used when generating new experiments by selecting a design type.
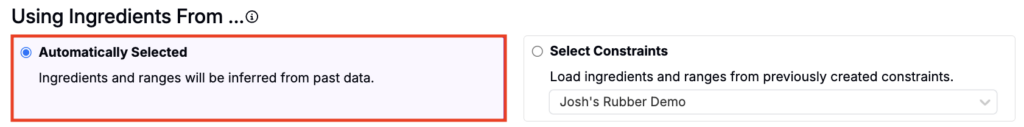
Automatically Selected
Choose Automatically Selected when you want Uncountable to recommend experiments using your existing data and parameters. This allows you to get quick suggestions without setting up detailed constraints.
Select Constraints
The Select Constraints option is ideal when users are working with predefined constraints and want to optimize experiments based on those inputs.
To use train your predictive model off a predefined set of constraints:
- Click Select Constraints and select the constraint from the menu.
- Review constraint inputs, frequency, and ranges to ensure they align with experimental goals.
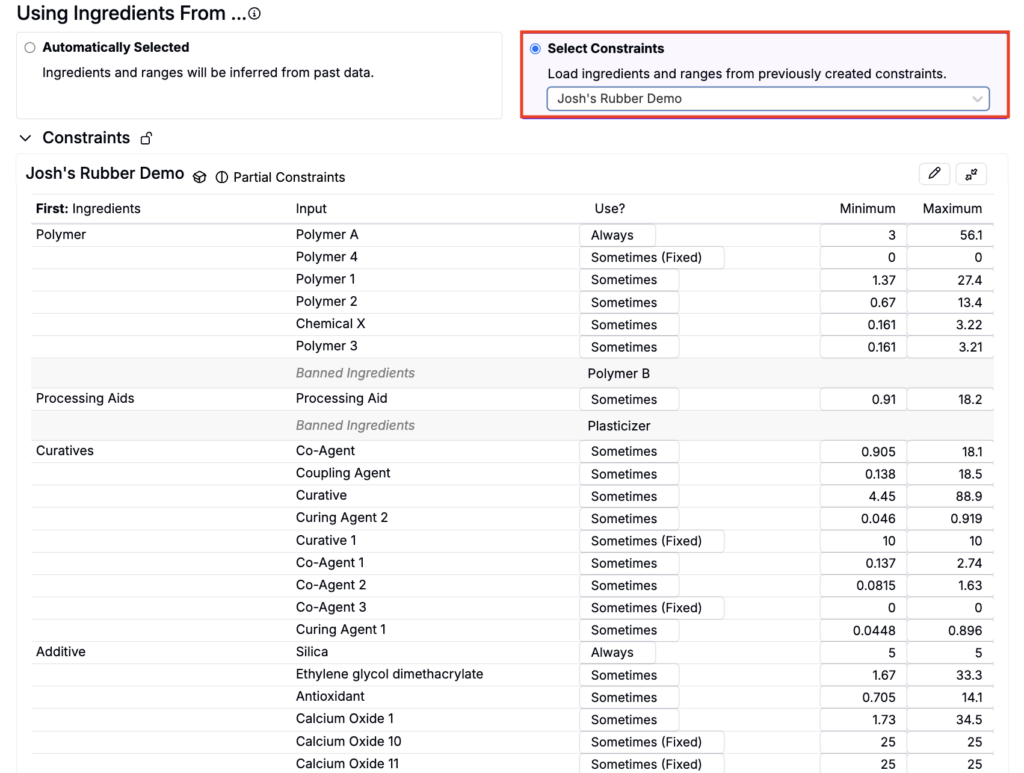
- To exclude irrelevant inputs from the design by, set frequency to Never Use (A).
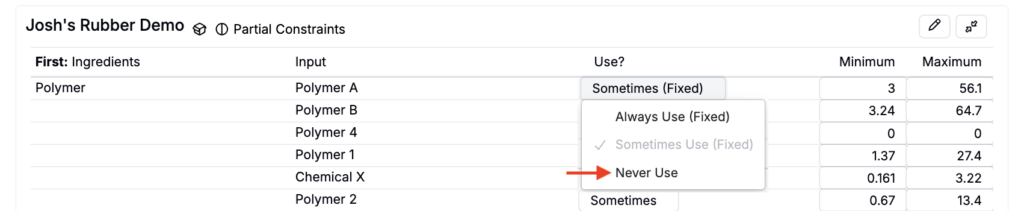
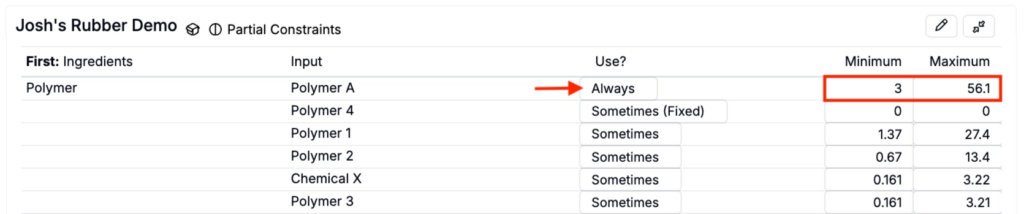
- If you set an ingredient to Always, you must also set a minimum and maximum range for that ingredient. (If the range is missing, the job may fail to generate suggestions.)
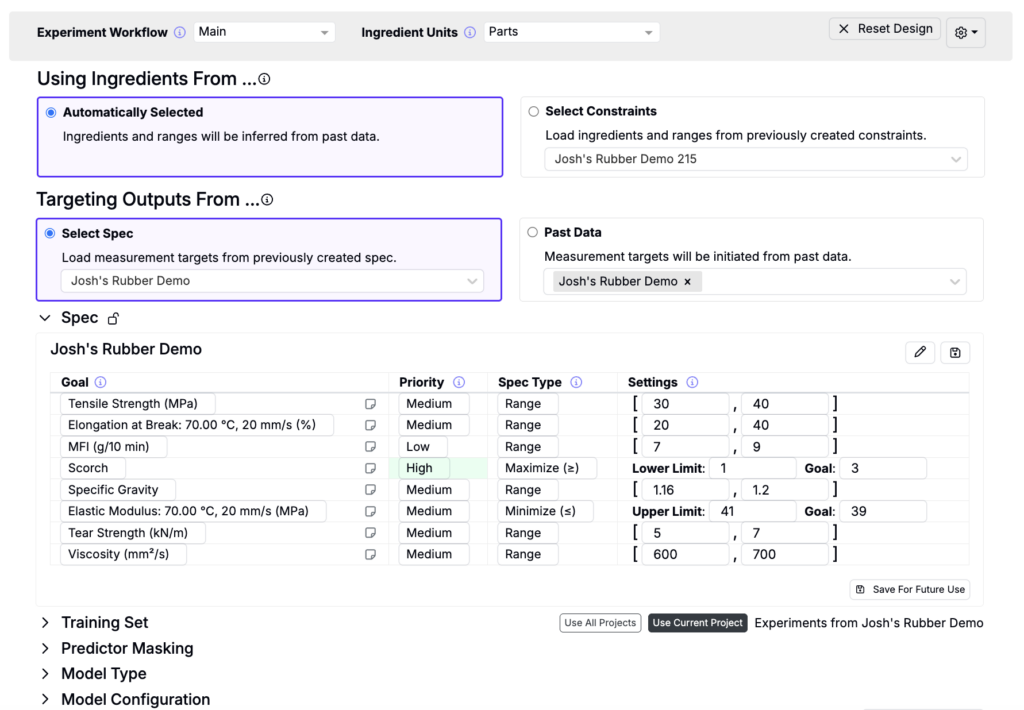
Step 3 — Select Outputs
Define the targets for your experiment by setting goals that align with your project’s objectives. These output targets will determine which predictions are available after experiments are recommended and which measurements are considered when selecting training data.
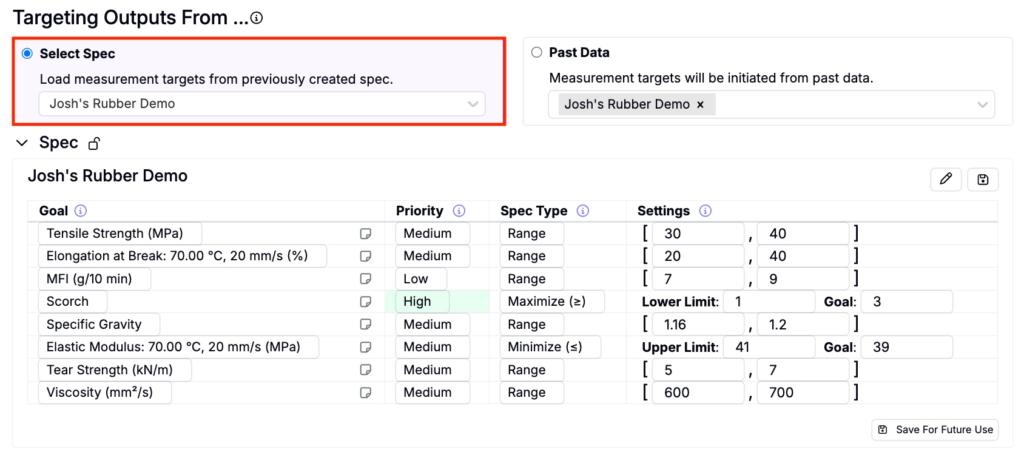
Select Spec
Choose Select Spec to load target measurements from a previously created spec.
Past Data
Choose Past Data to select a project or DOE to load target measurements.
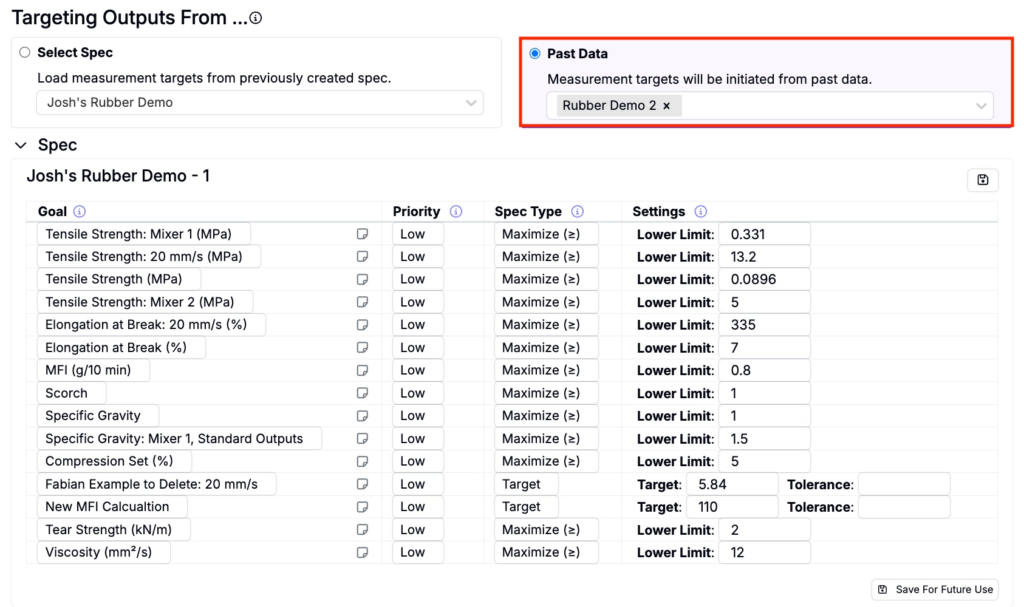
Once the target spec, project, or DOE are selected, review the measurements to ensure they are correctly listed under the appropriate conditions with accurate priorities and goal thresholds. Make sure goal thresholds fall within the range of existing data to avoid skewing the optimization process.
Step 4 — Choosing the Training Set
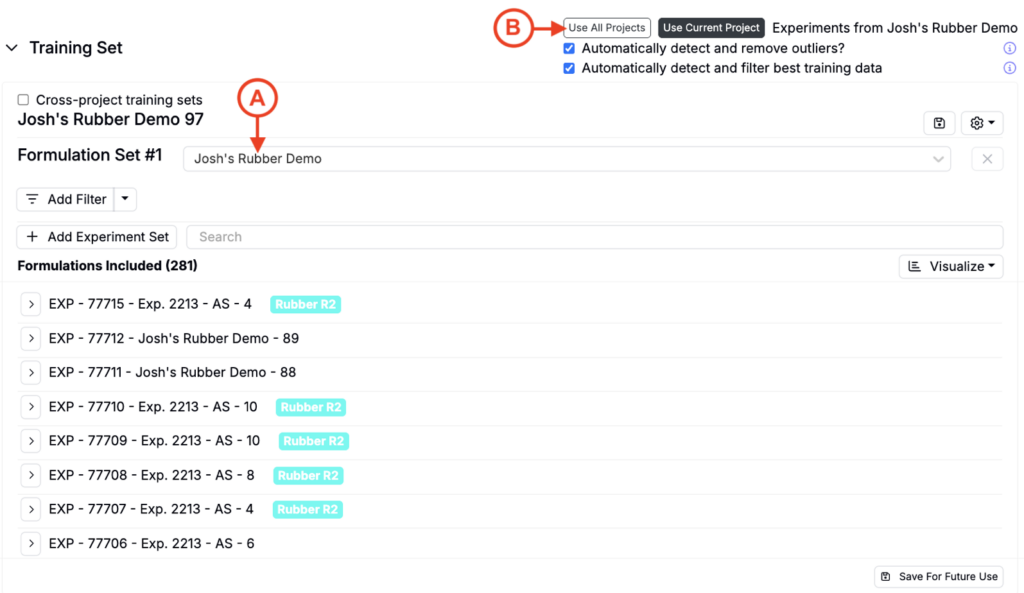
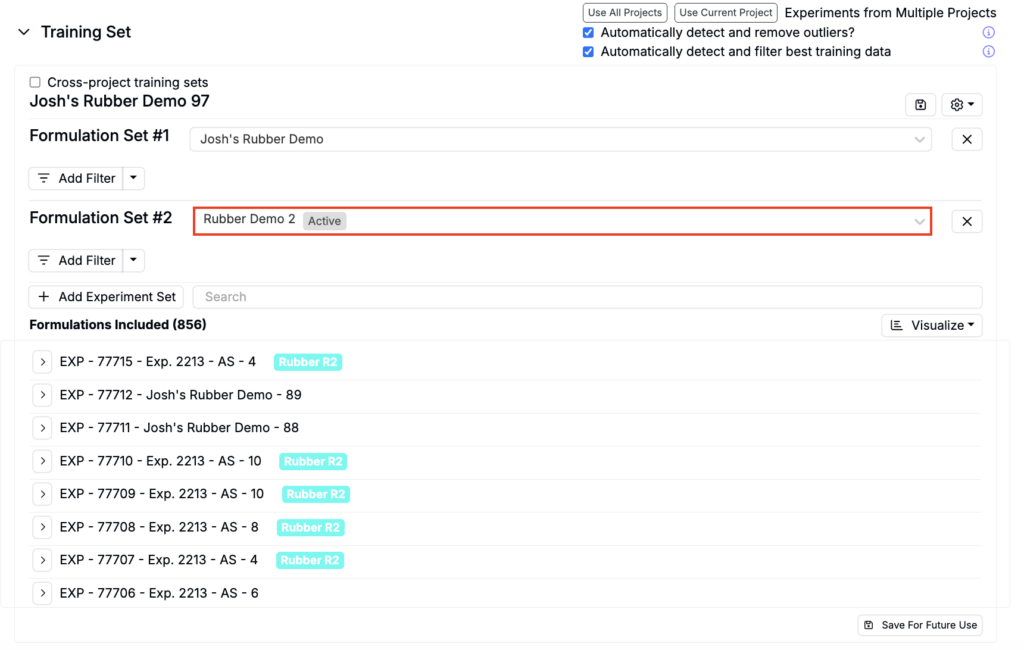
To choose a training set, select a Formulation Set from the dropdown (A) or create one from scratch.
When building a training set, start with experiments from your current project. If you need more coverage, enable the Use All Projects setting (B). To narrow the training data, use filters.
Once a project, or projects, have been selected, there may be instances where excluding or including certain experiments could improve the model. It is generally recommended to include as many experiments as possible within a training batch (e.g. 7 to 10 experiments), although fewer experiments may be necessary for certain types of data.
Excluding Experiments/Measurements
Consider excluding experiments in the following scenarios:
- If they are significant outliers in terms of ingredient types or amounts
- If input data, especially for important parameters, is missing or incomplete
- If data from the experiment is unreliable
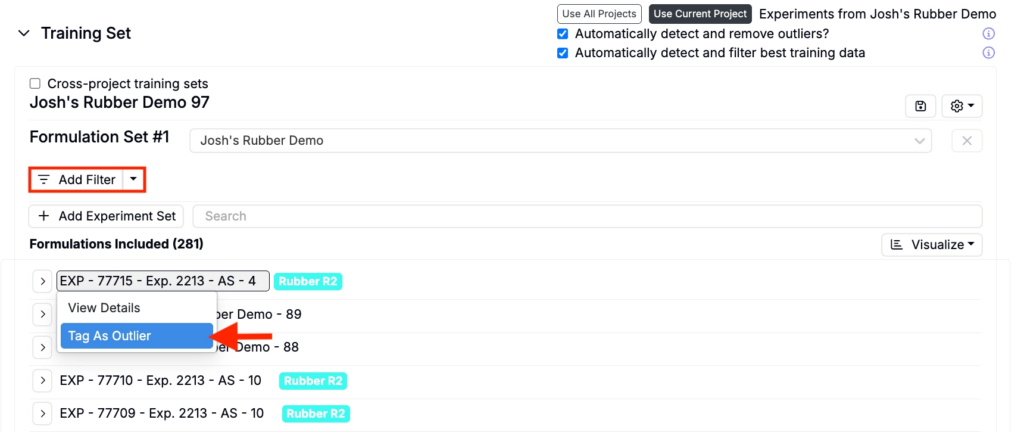
To exclude an experiment add filters or manually mark experiments as outliers by clicking the experiment name and selecting Tag as Outlier.
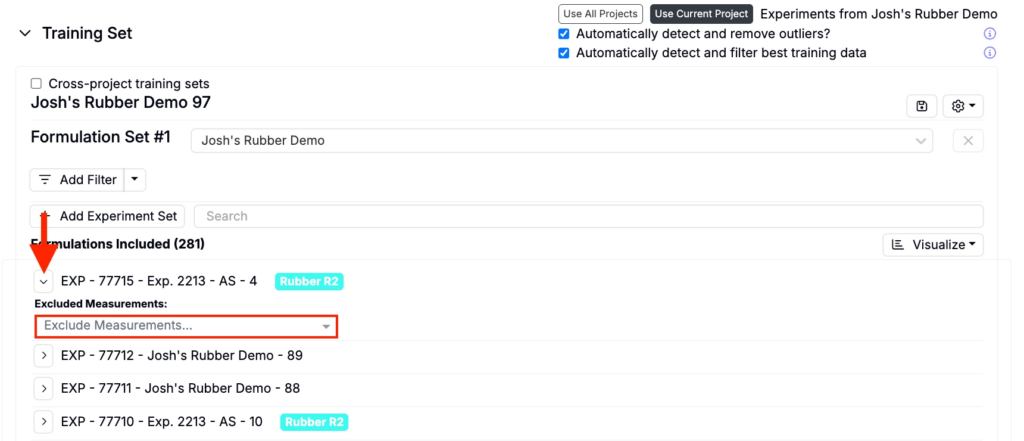
To exclude specific measurements from an experiment, expand the experiment and use Excluded Measurements to select the measurements you want to exclude.
Excluding Outliers
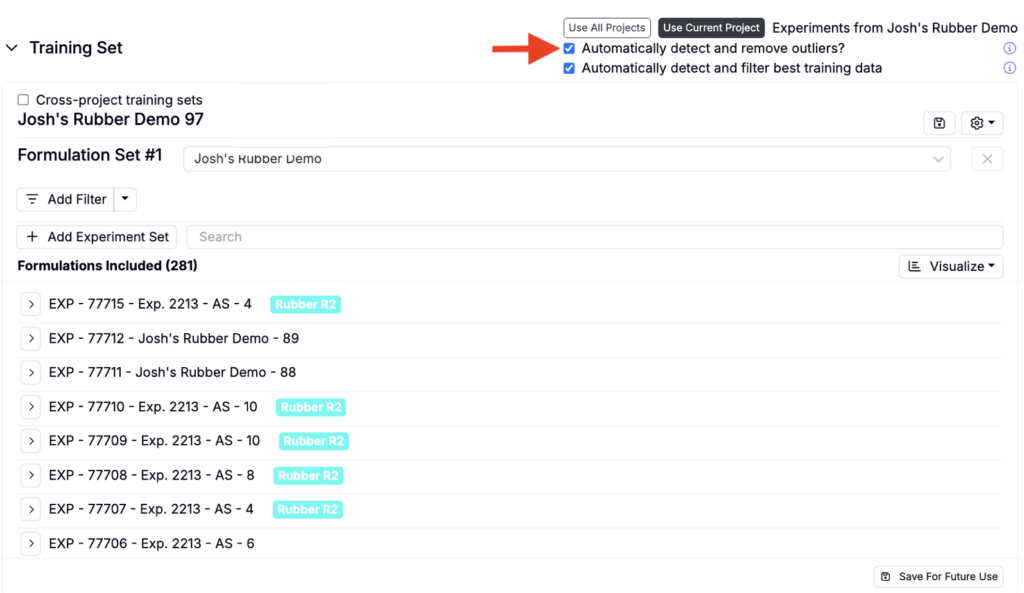
By default, Suggest will automatically detect and remove outliers to exclude data points that fall outside statistical thresholds. To include outliers, uncheck the Automatically detect and remove outliers setting at the top of the Training Set section.
Including Experiments
Experiments should be included when:
- They don’t meet any of the exclusion criteria above, or
- If they belong to a different project but are closely related to your current data set.
To include additional experiments, click the Add Experiment Set button, select a project, and add additional filters.
For more information on how much data is needed to build effective prediction models, refer to this article.
Step 5 — Initial Run and Model
Having chosen the constraints, spec, and training set, you can name the current job run and choose how many experiments to generate. As a rule of thumb, keep this under 20 for most workflows. Click Suggest Formulations to run the job.

Sometimes it is necessary to run a job a second time after assessing the quality of the initial model. Because models can be built relatively quickly, do not hesitate to rerun a job after making changes if you think you can improve the model or its recommendations.
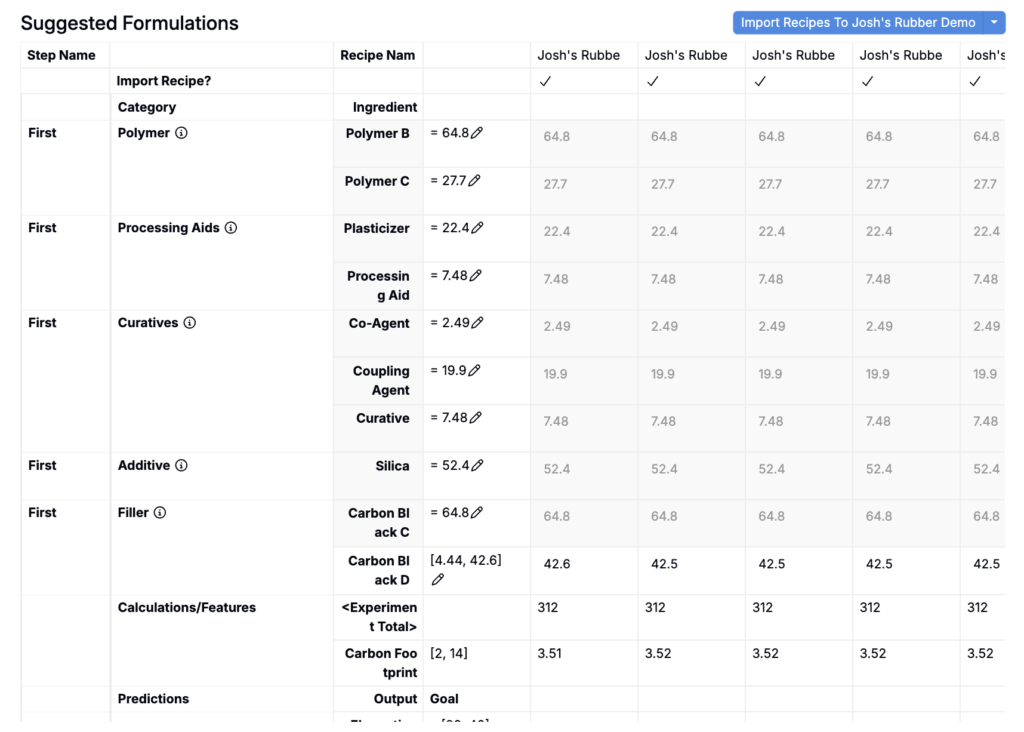
Reviewing Suggested Formulations
One of the main ways you can assess the success of an initial run is to check the suggested experiments. Assess how sensible the recommendations are, in particular:
- Are certain ingredients overused, or used at too high levels? You can lower the maximum allowed for these ingredients by copying the design, adjusting maximum amounts in the Constraint section, and rerunning the Suggest job.
- Are certain compulsory ingredients not used? You can make an ingredient required by copying the design and, in the Constraints section, set the ingredient frequency to Always.
- Are certain rarely used ingredients used too frequently? Go to your project’s Dashboard and check on past experiments that used this ingredient. Were they promising experiments, or are they outliers that ought to be excluded from the Training set?
- Do ingredient totals add up? Are particular categories of ingredients used at too high or low levels? You can adjust these limits in the Constraints section.
- Do the recommendations look very similar to each other? This can happen for several reasons. The two most common are overly restrictive constraints or a spec that puts too much emphasis on a single goal. Check whether you should loosen your Constraint or whether one of the measurement goals is too ambitious. It may also be that the past data is very comprehensive, and the model is highly confident that the best experiments to run are in this region.
Reviewing Effect Sizes
You can also use the Effect Sizes table to see the impact of each input in the model. It can be helpful to quickly check which inputs have the largest positive and negative effect sizes.
Do these ingredients and process parameters have effect sizes that make sense? If not, check the scatter plot for the specific output and input with the suspect effect size to see whether any anomalous experiments are driving it.
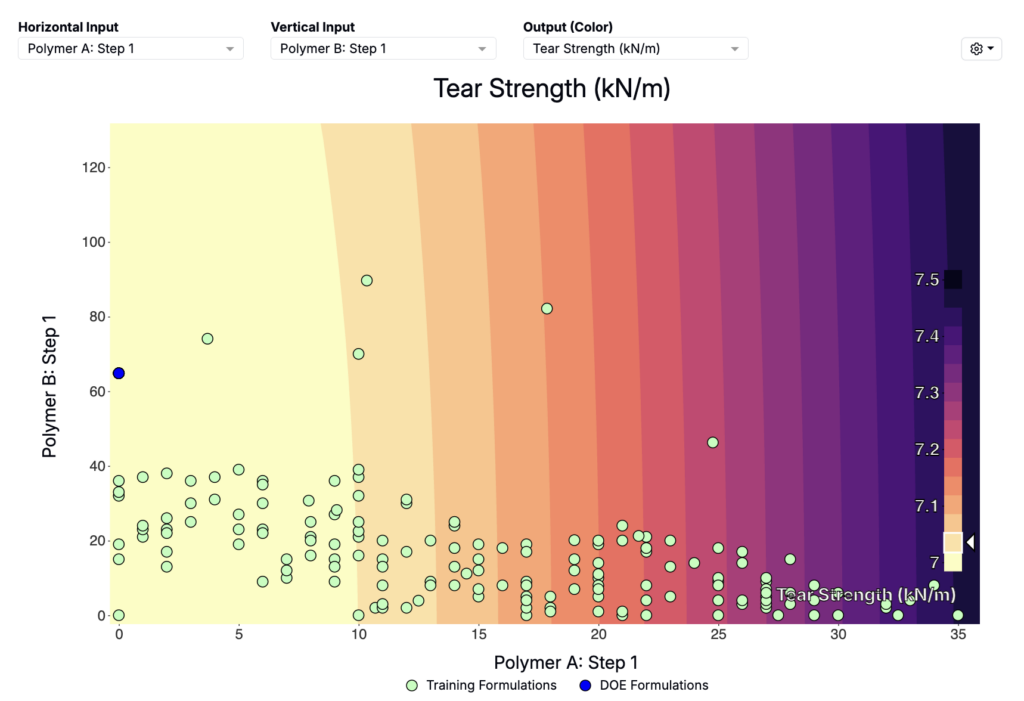
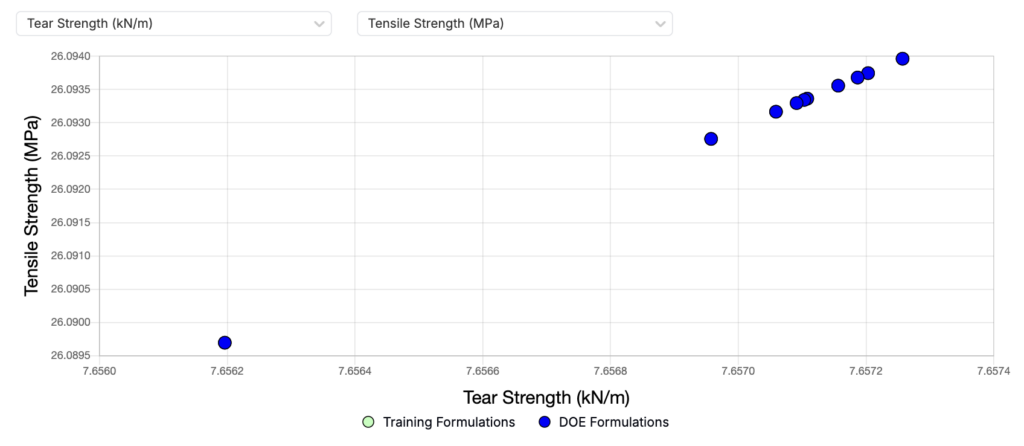
Reviewing Plots and Charts
In Suggest results, surface plots and output charts show:
- Training formulations (green points).
- Newly suggested DOE formulations (blue points).
The numbered DOE formulations correspond to the numbered columns in the suggestions table, which makes it easy to sanity-check where the suggestions fall in the design space.
Assess the Model’s Predictive Accuracy
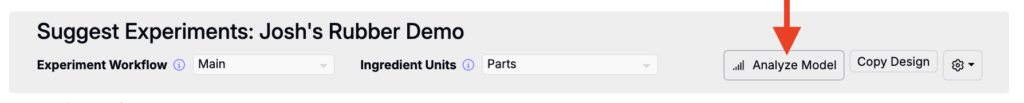
A more in-depth assessment of your model can be made by using the Analyze Model tool at the top of the Suggest page. This will navigate you to the Analyze job, created in tandem to the Suggest job.
Training Accuracy
Use the Training Accuracy table to learn about how well-constructed the model used for optimization is.
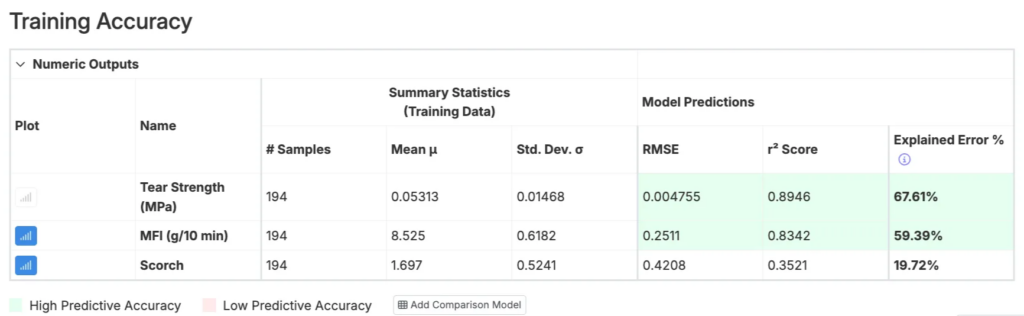
For each output, the table shows:
- RMSE — The model’s predictive error. Lower RMSE indicates more accurate predictions. This RMSE is calculated using a leave-one-out cross-validation procedure.
- r² Score — The Coefficient of Determination. Higher values, closer to 1, indicate stronger explanatory power. This measures how much of the variance in your output data set is explained by the model.
- Explained Error — Compares the RMSE with the standard deviation of your data. Because RMSE is an absolute measure and can vary in magnitude across outputs, normalizing by the standard deviation makes outputs easier to compare. Higher Explained Error, closer to 100%, indicates more accurate predictions.
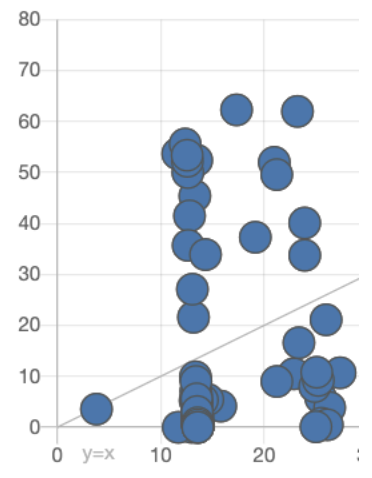
- Scatter Plot of Predicted vs. Actual — One of the most intuitive ways to assess predictive quality. Ideally, points lie close to the diagonal gray line ($y = x$). In the scatter plot view, look for:
- Outliers — If one or two points have predictions that differ from the actual values much more than the rest, check whether those measurements are reliable. If they are not, remove them from the training data set.
- Vertical lines (see figure below) — If the graph of Predicted Measurements vs. Actual Measurements contains vertical lines, this indicates that the model made the same prediction for multiple data points that, in reality, have different measured values. The three most common causes:
- Blank process parameter data, which the model interprets as “0” — To handle this, remove data points with incomplete process parameters or remove these parameters from the model features
- Missing important input features — To address this, make sure all important ingredients are included in the constraint used to create the model
- Hidden subgroups in the data — Check whether the experiments come from different groups or experimental conditions that should not be mixed together.
Step 6 — Optimization
After adjusting constraints, targets, and the training set as needed, rerun the job with the updated settings.
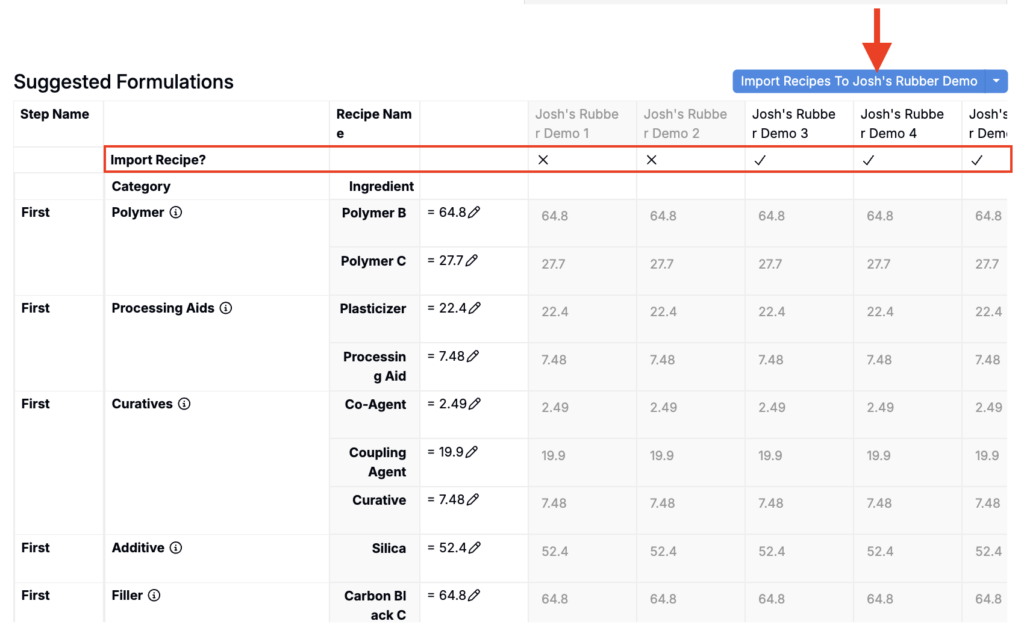
- In the Suggested Formulations table, use the Import Recipe? row to choose which suggested formulations to include or exclude from import.
- To import into your current project, click the Import Recipes button at the top of the table.
- To import into a different project or export to Excel, open the Import Recipes button menu.
Increasing Diversity in Suggested Recipes
If your suggestions look too similar, you can adjust Model Parameter Settings so the sampler’s natural spread dominates (instead of early score-based pruning).
Quick start (most cases)
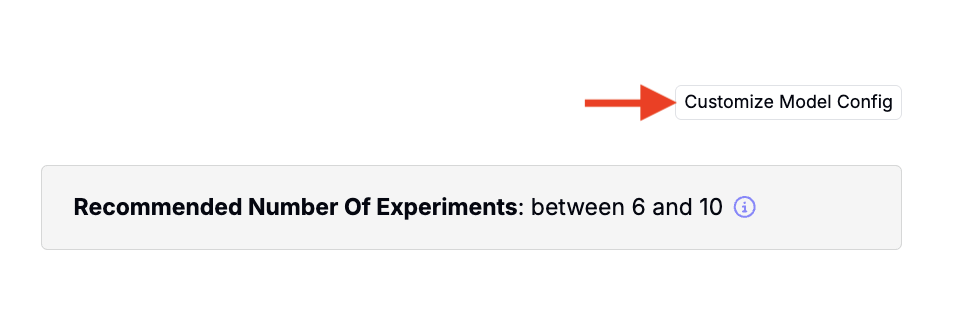
- At the bottom of the page, click the Customize Model Config button.
- Under Model Parameter Settings:
- Set
N ≈ num_keep— When N equals num_keep, nothing is pruned by score and you keep the sampler’s full spread. - Increase
num_keepsubstantially — A large num_keep (e.g., 3e5) paired with deriv_loop = 0 often yields a broader set. - Set
deriv_loop = 0— Disables derivative-based refinement that can collapse variety.
- Set
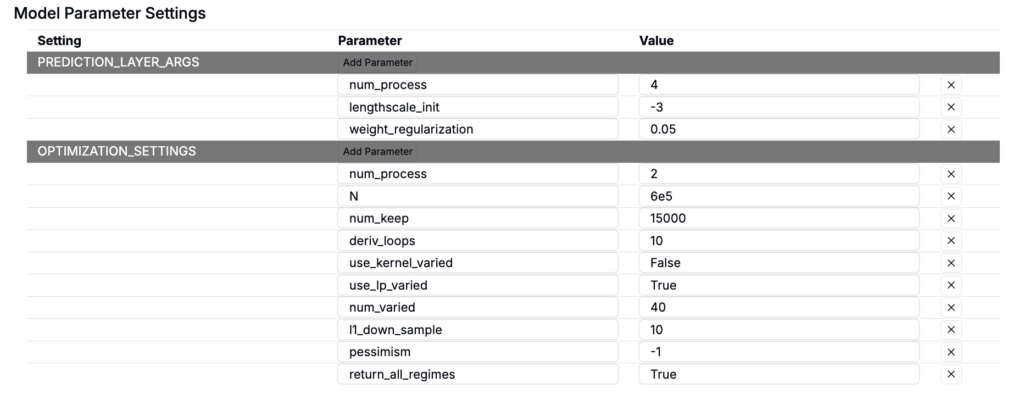
What each parameter does
N— total candidates initially sampled.num_keep— candidates retained for scoring/final selection. Making N ≈ num_keep minimizes score-based pruning and preserves diversity.deriv_loop— number of local refinement iterations; lower values favor coverage over clustering.