In experimental programs, not all outputs behave the same way. Some results measure how much. Others reflect how good. And some simply indicate which type. A measured value, a ranked score, and a labeled category may all sit side by side in a dataset, but they carry different structural assumptions. In Uncountable, the way an output is defined influences how it is handled during modeling and optimization.
Experimental outputs typically fall into three structural types: continuous, ordinal, and categorical.
Continuous outputs are numeric values where magnitude and distance are meaningful. The difference between 10 and 12 carries the same structural meaning as the difference between 20 and 22. These are typical measured quantities: yield, viscosity, tensile strength, concentration, etc.
Ordinal outputs are ordered categories. The relative ranking matters, but the spacing between levels is not guaranteed to be equal. A rating of 4 is higher than a rating of 3, but the distance between those levels is not necessarily uniform across the scale. Many performance scales, visual ratings, or stability grades fall into this category — they carry direction, but not precise spacing.
Categorical outputs are discrete labels with no inherent order. For example, Pass/Fail, defect type, crystal form, or material class indicate distinct outcomes, not positions along a scale. There is no meaningful way to say one category is “closer” to another.
The distinction is structural: continuous outputs assume numeric distance, ordinal outputs assume rank without fixed spacing, and categorical outputs assume no ordering at all.
The remainder of this page goes through how Uncountable handles ordinal and categorical outputs in Analyze and Suggest with AI. For more information on setting up different outputs types, see the links below:
Modeling Implications: Ordinal Outputs
In Uncountable, ordinal outputs are treated as continuous during modeling and optimization. They are treated as numeric targets, and predictions are returned as continuous values.
This can look surprising at first, since ordinal data consists of discrete levels. However, ordinal outputs still encode a meaningful ranking. A rating of 4 is not just different from 3 — it is higher. That directional structure contains more information than a simple category label. By modeling ordinal outputs numerically, Uncountable allows the model to:
- Learn trends across the ranked scale
- Differentiate formulations that are likely to score higher vs lower on the ordinal scale
- Optimize toward higher (or lower) ranked performance in Suggest
Because ordinal outputs are modeled numerically, predictions in Analyze and Suggest will appear continuous. You may see a predicted value for example of 3.6, 4.2, 2.8, etc.
These are not new categories. They represent the model’s estimated position along the ranked scale. You can interpret them as:
- A value between levels (e.g., 3.6 is closer to 4 than 3)
- A continuous estimate that can be paired with uncertainty (uncertainty is available when the Uncountable GP Model is used)
- A way to compare candidate experiments before rounding to discrete levels
In practice, experimental results are still recorded at discrete levels. The continuous prediction simply provides a smoother surface for learning trends and guiding optimization.
The figure below shows a predicted response surface for an ordinal output (consumer rating). Although ratings are recorded at discrete levels, the model learns a smooth trend across the formulation space.
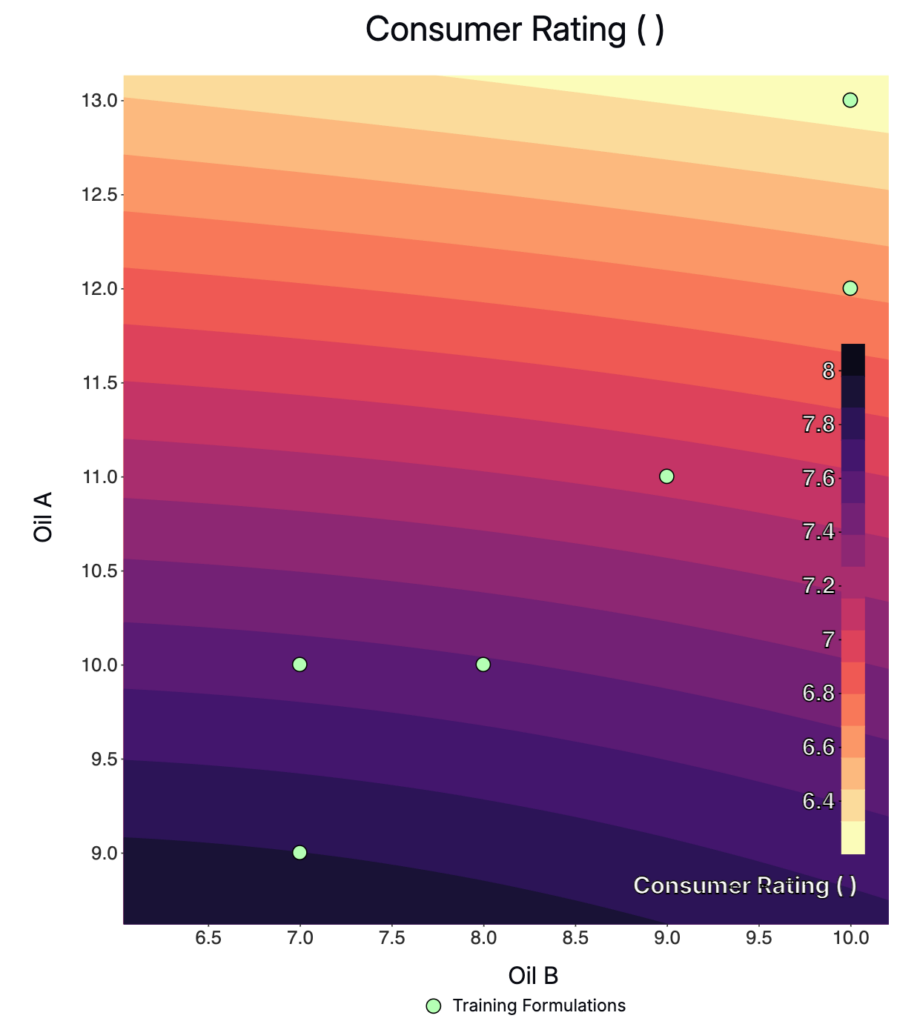
Example predictions for an ordinal output (Consumer Rating). The decimal values and uncertainty reflect the model’s estimated position along the rating scale, not new discrete categories.

The key idea is: Ordinal data has order, and order has direction. Treating it numerically preserves that direction and makes optimization more effective.
Modeling Implications: Categorical Outputs
Categorical outputs are handled differently because they do not have an inherent ordering. The categories represent distinct classes rather than positions along a ranked scale, so there is no meaningful numeric structure for the model to learn.
When a categorical output is included in an Analyze or Suggest job, Uncountable trains a classification model rather than a regression model. Specifically, categorical outputs are modeled using a Random Forest classifier. Instead of predicting a numeric value, the classification model estimates the probability of each possible category based on the experimental data.
Uncountable trains a separate model per output. If you run Analyze or Suggest using the default Uncountable Gaussian Process model, continuous and ordinal outputs will still use this GP model, while categorical outputs automatically use Random Forest. Adding a categorical output does not switch the modeling approach for the other outputs.
Spec Types for Categorical Outputs
When adding a categorical output to the Spec, it it important to select the Spec Type that matches your goals. For the Spec Type for a categorical output, you can choose:
- Multiclass: Categories remain as they are defined (currently supported for Analyze with AI)
- Allowed Options: Allowed Options will convert the categories you select to “Pass” and the rest to “Fail”, then binary classification will be performed by the model
- Disallowed Options: Disallowed Options will convert the categories you select to “Fail” and the rest to “Pass”, then binary classification will be performed by the model
This choice determines how Suggest interprets the output during optimization.
Model Accuracy
Since categorical outputs are classification problems, their evaluation metrics differ from numeric outputs.
For continuous or ordinal outputs, you will see:
- RMSE
- R² score
- Explained Error %
For categorical outputs, you will instead see classification metrics such as:
- Precision
- Recall
- F1 Score
- Confusion Matrix
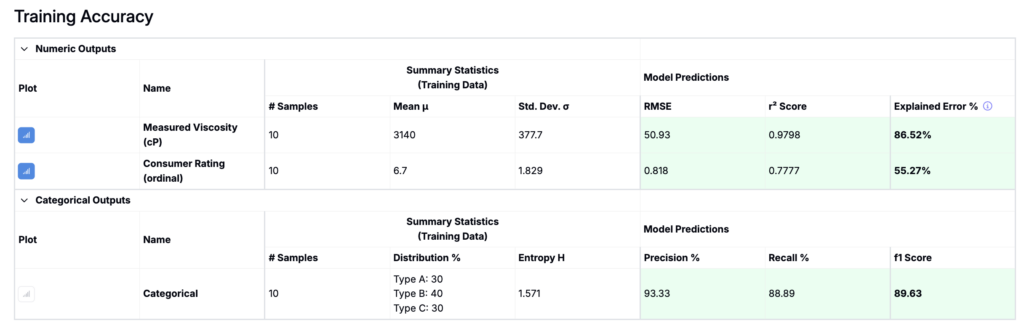
There is no RMSE because there is no numeric distance between classes. Instead, the model is evaluated on how often it correctly predicts the class.
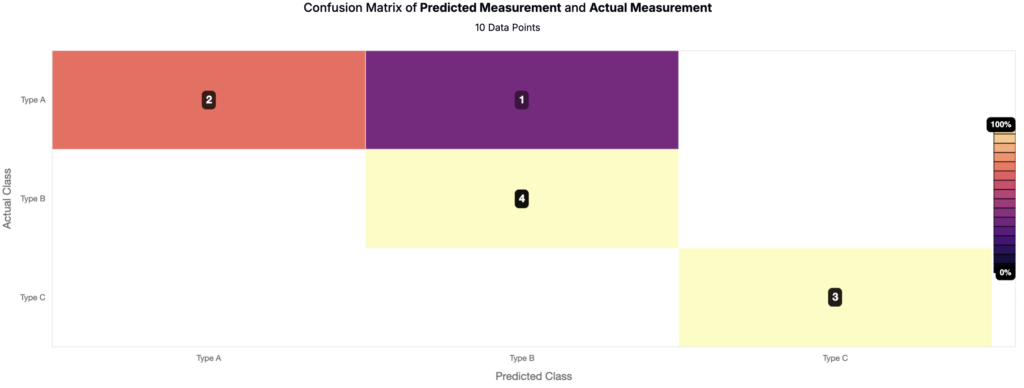
The confusion matrix provides additional detail about where misclassifications occur. Rows represent true classes and columns represent predicted classes. The example below is a confusion matrix for a categorical output with three classes (Type A, Type B, Type C). Correct predictions fall along the diagonal, while off-diagonal entries indicate misclassifications (e.g., Type A predicted as Type B). This view helps identify which classes are well separated and which are difficult for the model to distinguish.
How Suggest uses categorical outputs
For Suggest with AI, categorical outputs are not “maximized” or “minimized.” Instead, you define which categories are acceptable in the Spec.
For example, suppose a categorical output has three possible results: Type A, B, and C. You only consider type B or C acceptable, so you set Allowed Options = {Type B, Type C}.
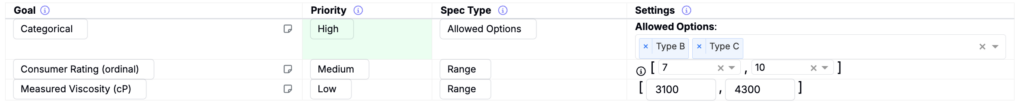
Suggest then prioritizes experiments predicted to fall into the allowed category and avoids those likely to fall into disallowed ones. Below is an example showing predicted outputs from a Suggest job that includes a categorical output:
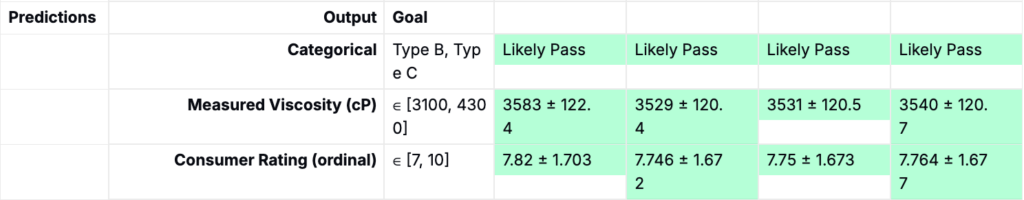
This is fundamentally different from optimizing a numeric output. Continuous and ordinal outputs allow movement along a performance scale. Categorical outputs instead define feasibility or class membership. Improvements are reflected as increases in predicted likelihood for a desired category, not as movement along a numeric continuum.