
A whiteboard is a custom, interactive interface that Bodie AI generates to visualize your data. Ask Bodie to build one and it assembles a layout from the components you need — charts, tables, and other elements pulled from live platform data.
What whiteboards can do
Whiteboards support:
- Customizable layouts built from charts, statistics tiles, listing tables, markdown text cells, and selector cells
- Interactivity via selector components that dynamically change the view
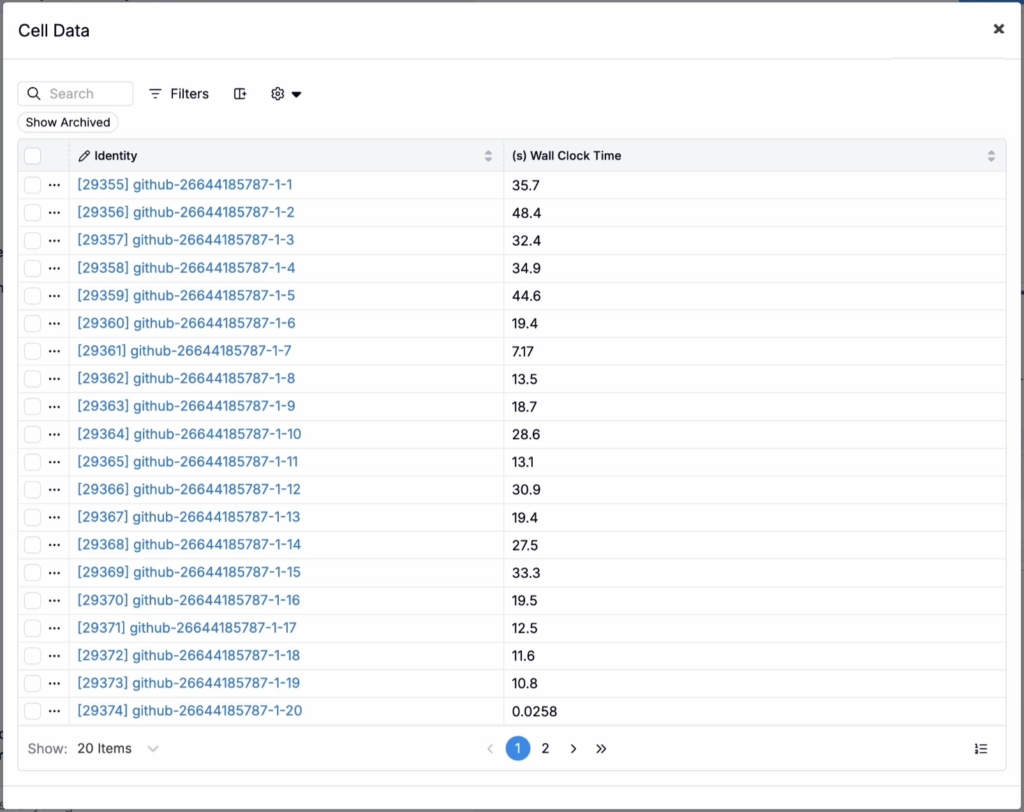
- Cell-level inspection to view the underlying data behind any component
- Drag-and-drop placeholder components, so you can describe exactly the edit you want Bodie to make
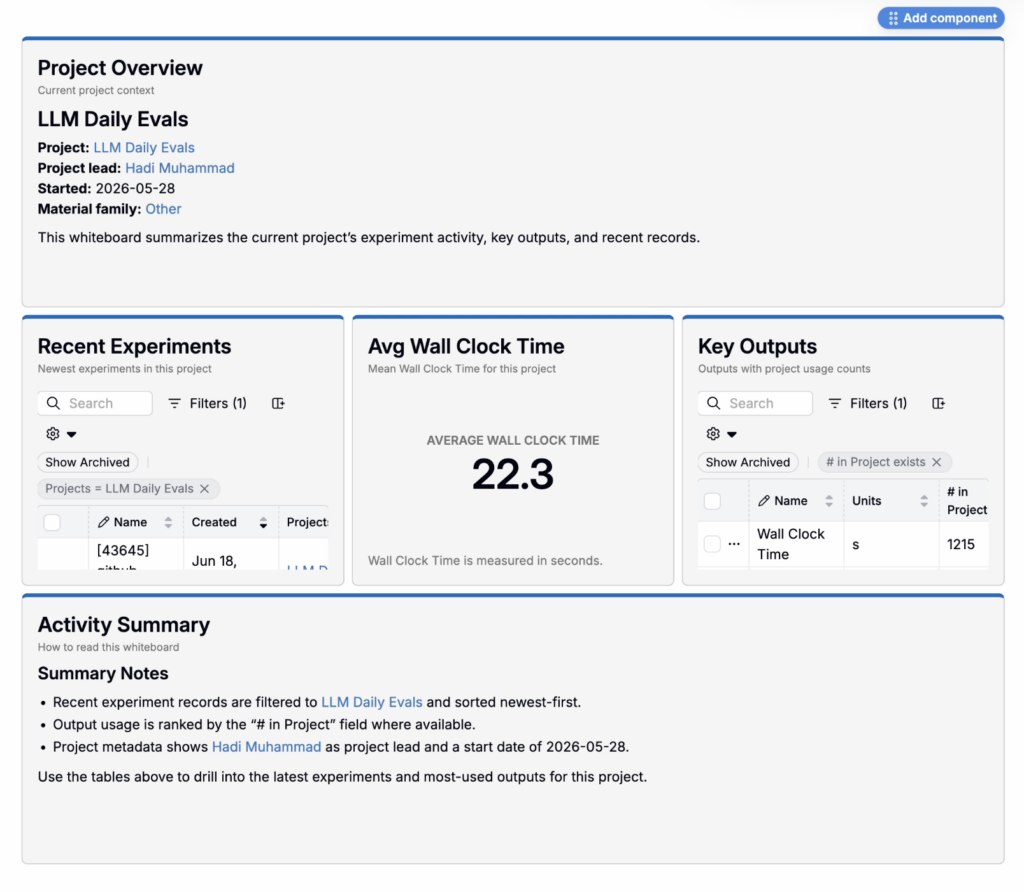
Creating and editing whiteboards
Whiteboards are Bodie-native, which means you create and update them through chat rather than a manual editing interface. Ask Bodie for the layout you want, and it can build or revise the whiteboard for you — from adding a new tile to adjusting a filter.
To create a new whiteboard, try a prompt like:
- “Create a whiteboard summarizing this project.”
- “Build me a dashboard showing my team’s open tickets by status.”
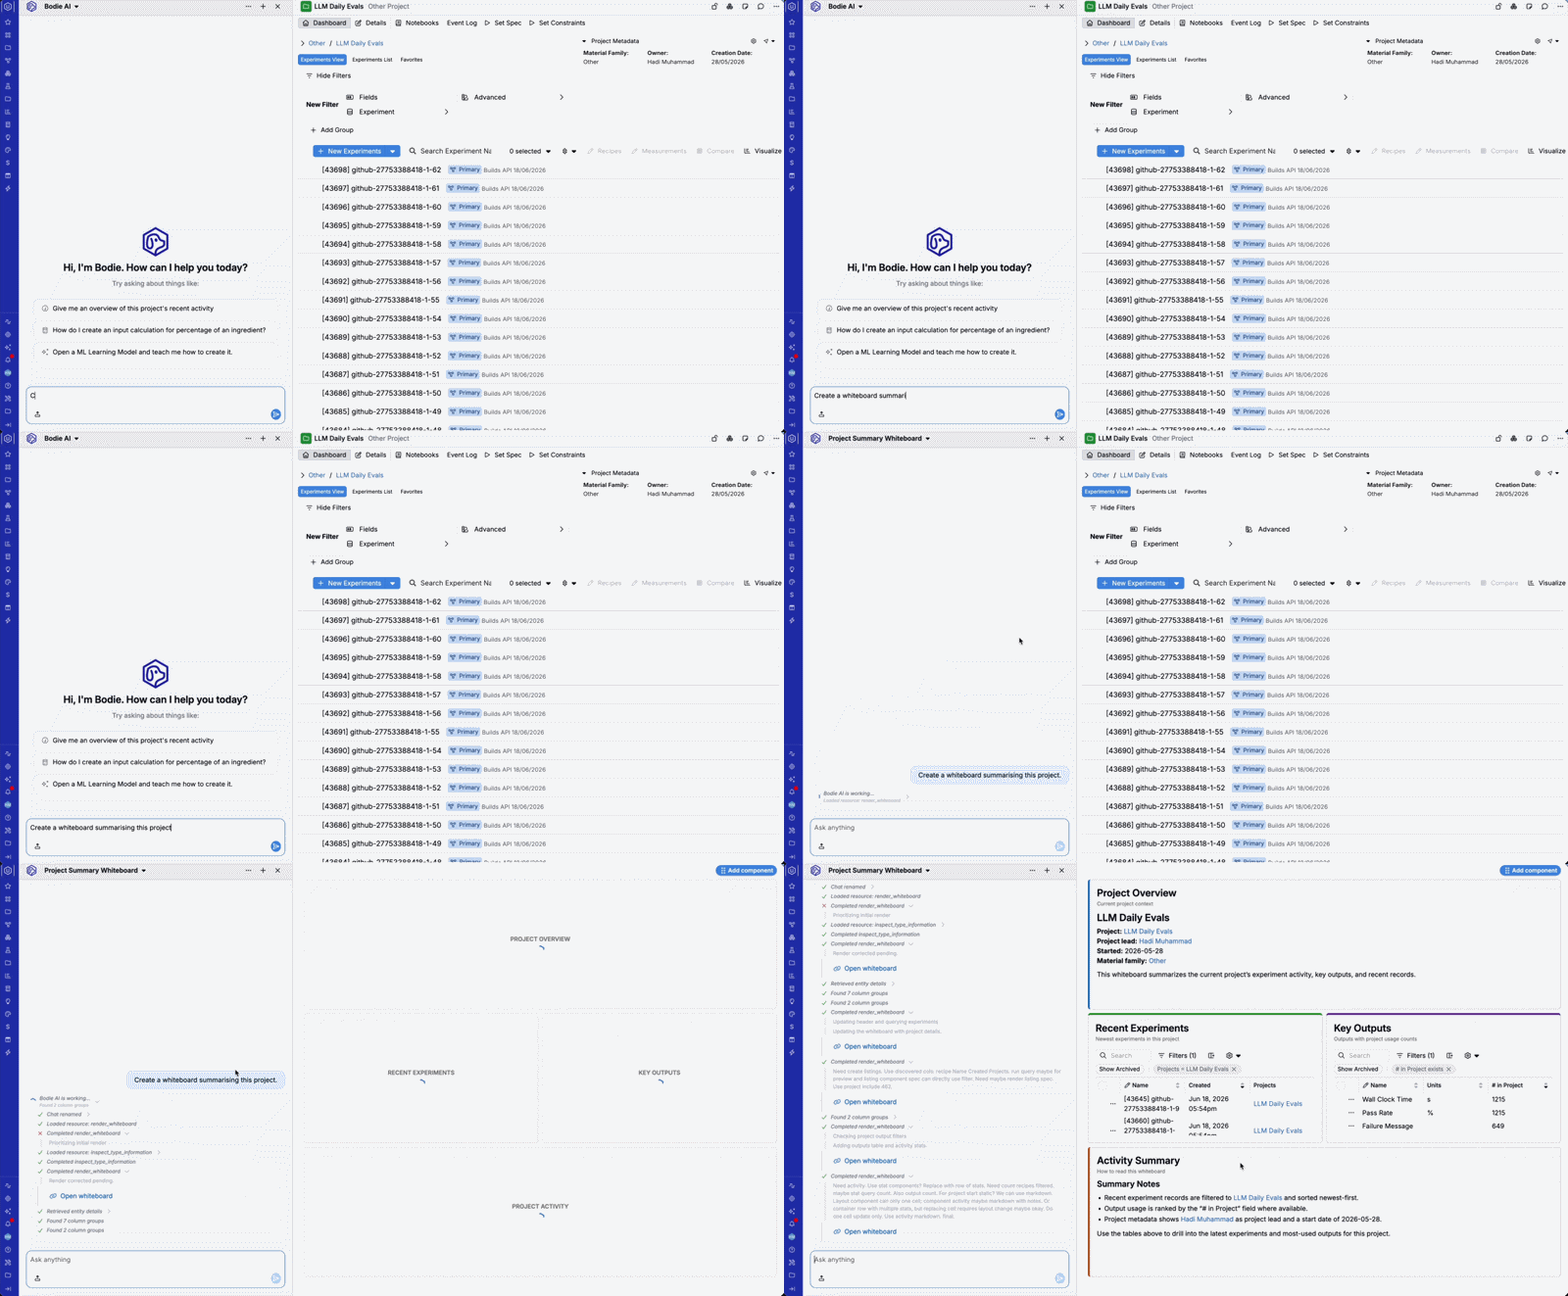
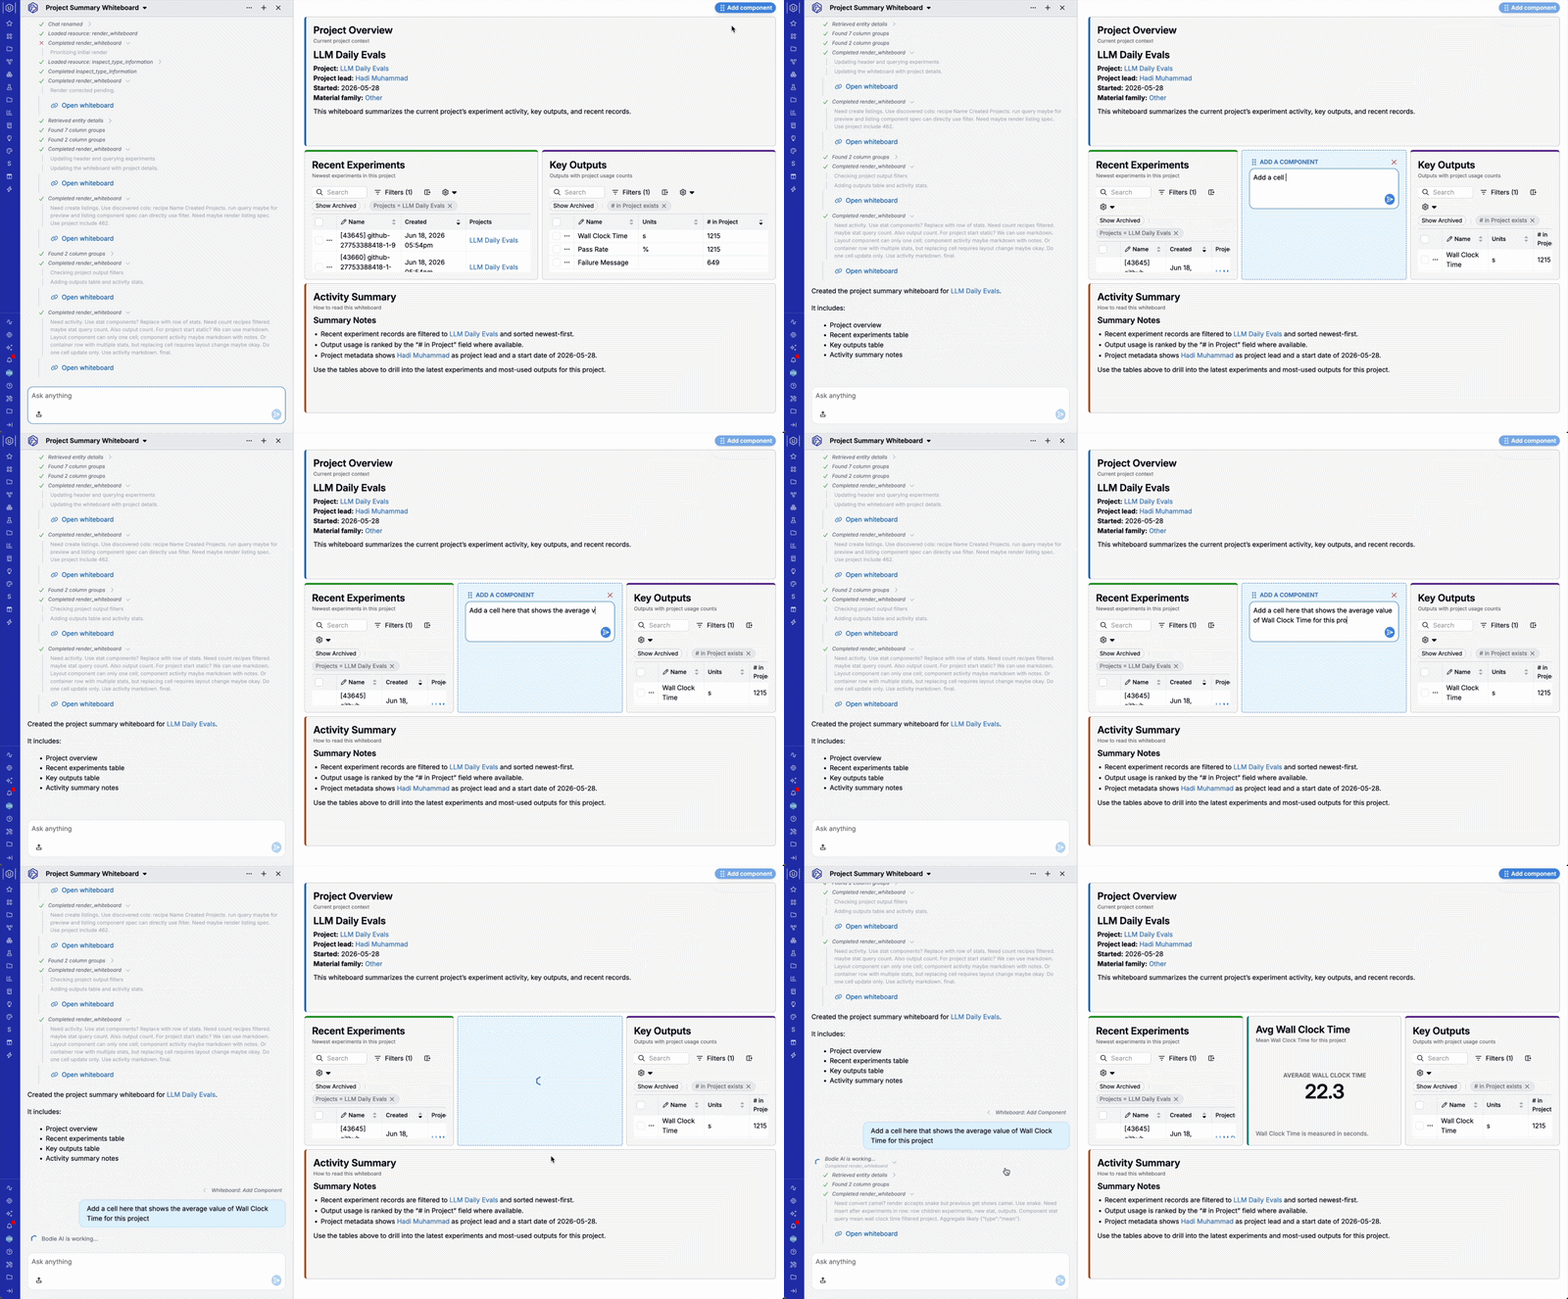
After Bodie creates the whiteboard, you can keep refining it in chat. To add a component, drag the Add Component placeholder into the layout, then describe what the new component should show. For example:
- “Add a chart comparing tensile strength across these experiments.”
- “Turn this into a list I can filter by project.”
You can also ask Bodie to adjust component styling, such as:
- “Change all highlights to be blue and move them to the top of the cell.”
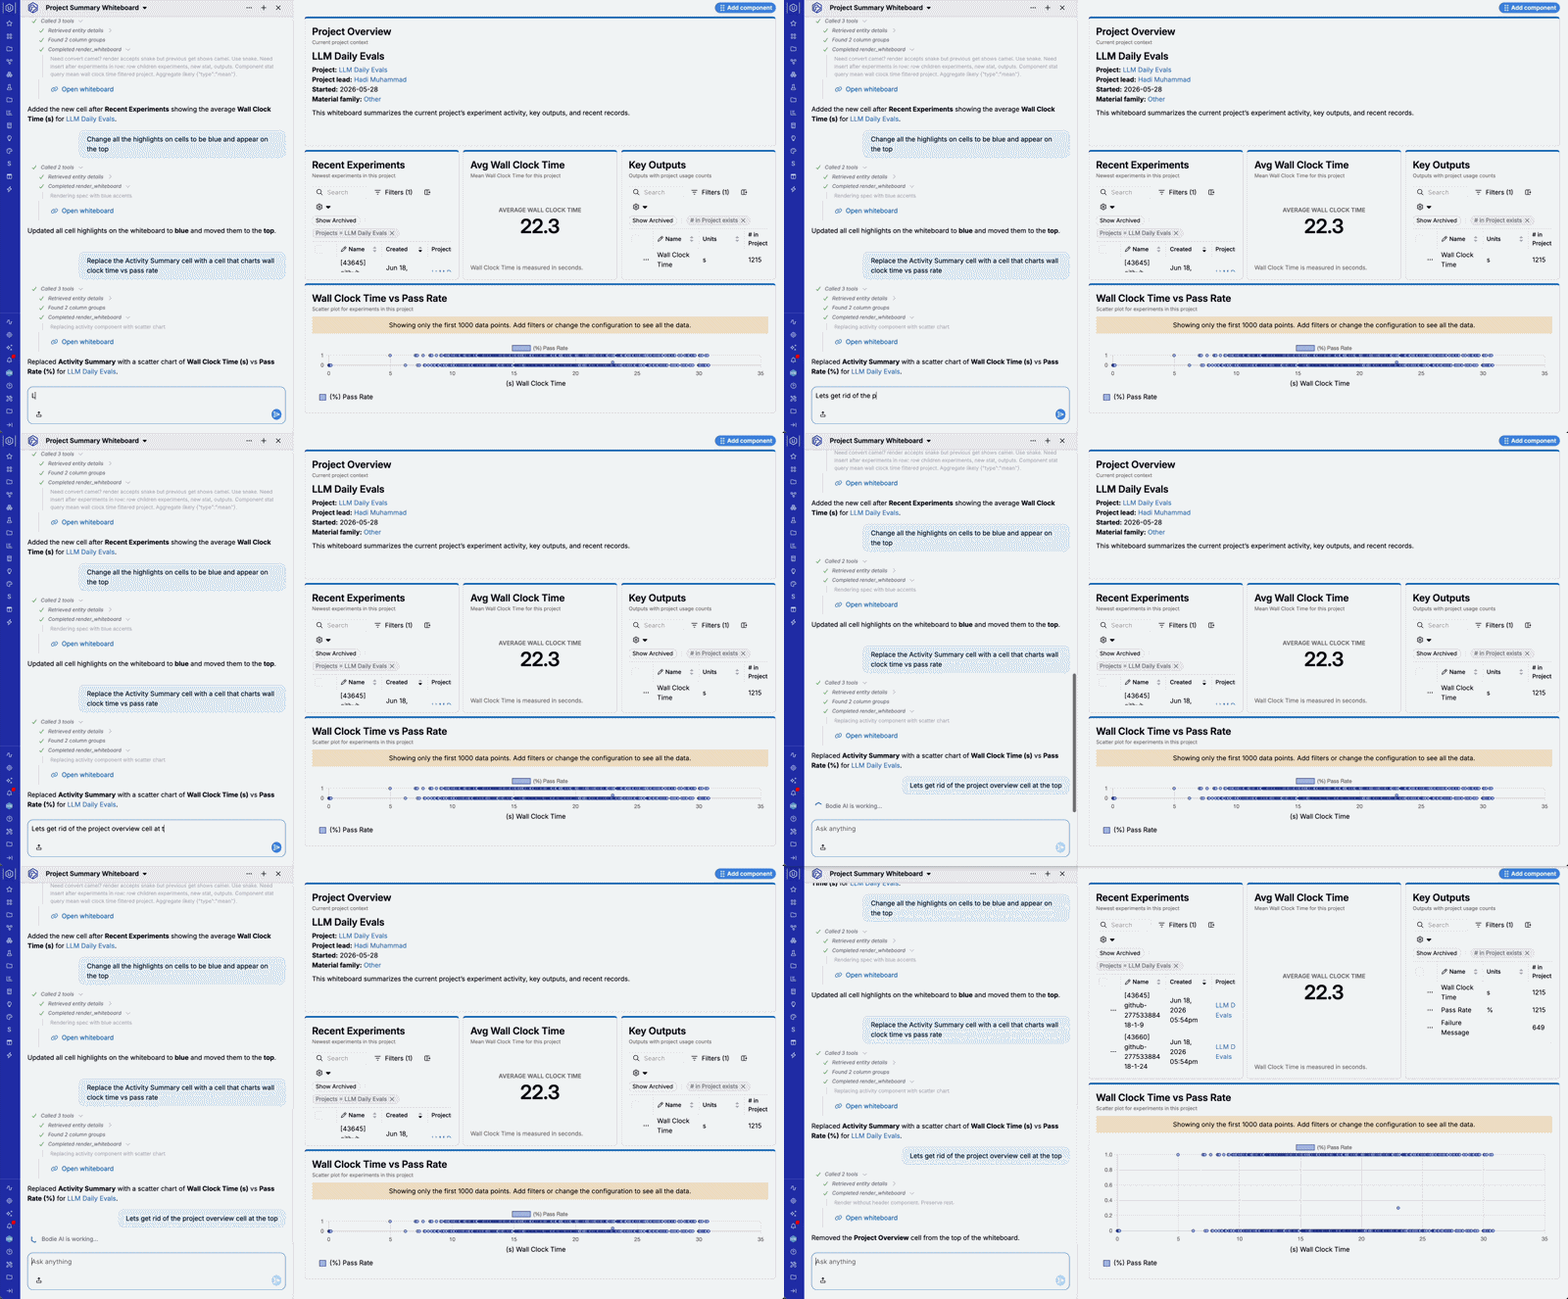
To remove a component, tell Bodie which part of the whiteboard to delete. For example:
- “Let’s get rid of the Project Overview cell at the top.”
Using whiteboards
Use a whiteboard like an interactive dashboard: review the charts, tables, statistics, and markdown cells to understand the underlying data. If the whiteboard includes selector cells, change the selected values to update the connected components and explore different slices of the data.
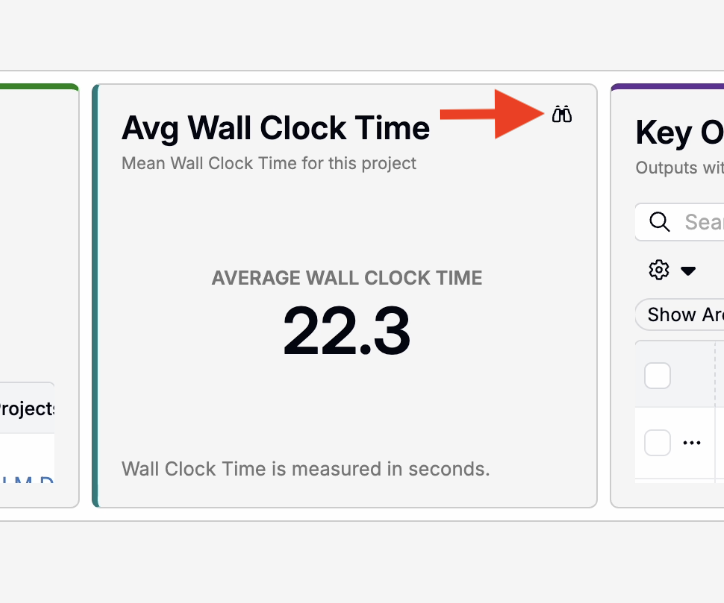
To inspect a specific component more closely, hover over it and click the binoculars icon. This opens the individual cell in a separate modal with more information, so you can review the data or details behind that component without leaving the whiteboard.
Accessing whiteboards
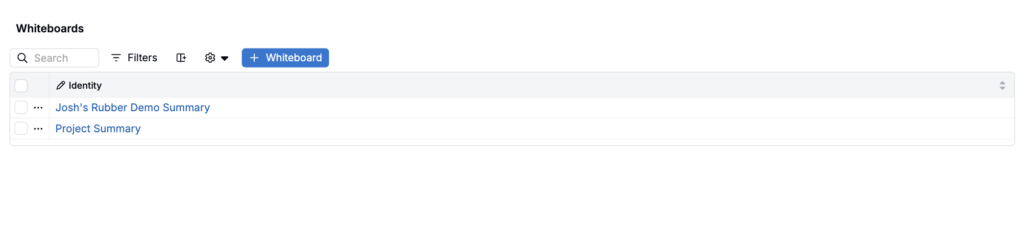
Whiteboards are their own entity type. You can find and open any whiteboard you have access to from Quick Actions (Command + K) by searching for Whiteboard. This will bring you to a listing page of your whiteboards.
Permissions and data
Whiteboards follow standard entity permissions, the same as any other entity type in Uncountable. They’re intended to be shared between users rather than scoped to a single person, so a team can collaborate on the same whiteboard.
The data underlying a whiteboard loads through the same structured listing pathways as the rest of the platform, so it always respects the permissions of whoever is viewing it — a user only sees the underlying data they’d otherwise have access to, regardless of who built the whiteboard.