The Ingredient Plot tool lets you compare ingredients within a material family and see how ingredient properties relate to each other. You choose what appears on the X and Y axes, which property drives color, and which drives point size— making trends and clusters easy to spot.
Accessing Ingredient Plot
From the Ingredients listing page, you can access the Ingredient Plot tool by clicking Options > Visualize Ingredients.
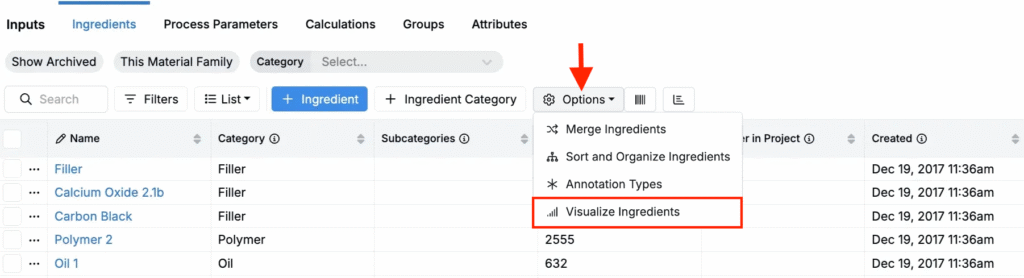
You can also use Quick Actions and search for “Visualize Ingredients.”
Configuring the Plot
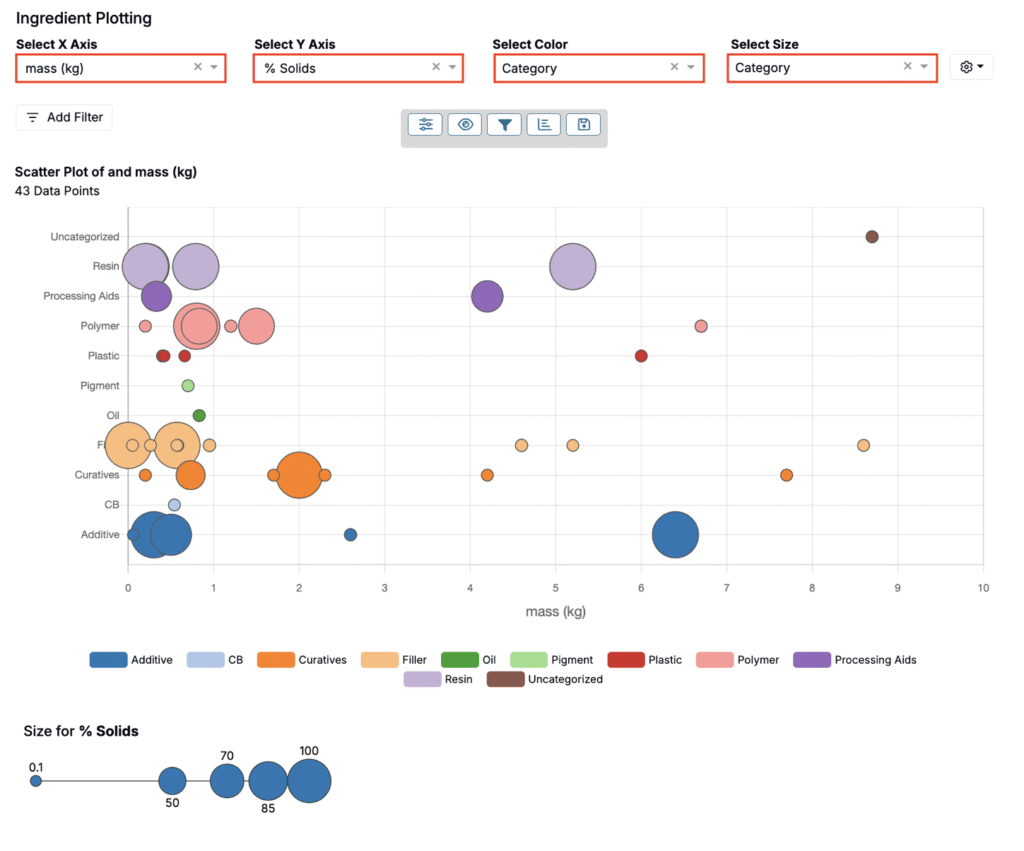
At the top of the page you’ll see four selectors that define the chart:
- Select X Axis — Choose the ingredient property for the horizontal axis (e.g., Mass (kg)).
- Select Y Axis — Choose the ingredient property for the vertical axis (e.g., Solids %).
- Select Color — Choose a property to group and color-code points.
- Select Size — Choose a property to scale point sizes.
When selecting axes, you’ll get better results by selecting properties shared across many ingredients.
Exploring the Plot
Once you have made your selections, you can:
- Hover over a point to see a tooltip with the key properties you selected (e.g. mass and
- Click a point to open the ingredient’s detail page. Here, you can view and edit ingredient categories, metadata, and attributes.